





Google Announced Leader in 2021 Gartner Magic Quadrant for Cloud Infrastructure and Platform Services

3560
Of your peers have already read this article.
3:00 Minutes
The most insightful time you'll spend today!
For the fourth consecutive year, Gartner has positioned Google as a Leader in the 2021 Gartner Magic Quadrant for Cloud Infrastructure and Platform Services (formerly titled as Magic Quadrant for Cloud Infrastructure as a Service upto 2014 Infrastructure as a Service, or (IaaS).
With our customers and communities adjusting to new ways of working and doing business, Google Cloud has remained focused on building services and platforms that help you be more resilient and derive even more value from your cloud infrastructure. We believe Gartner’s analysis and recognition gives our customers the confidence needed to choose Google as the platform for customer-centric innovation. Here are just a few recent examples.
Ready for the most demanding, mission-critical workloads
Our enterprise-ready cloud provides you the uptime, performance, and scale to run even your most demanding workloads. Examples of recent launches:
- The largest single-node GPU-enabled VM in the industry with up to 16 NVIDIA A100 instances so that our customers can run their ML workloads
- The only cloud to support scale-out out 96TB SAP HANA so that customers can confidently bring their most critical workloads to GCP
- Strategic partnerships with leading partners like SAP
- Several regions and an expanded global network footprint including new subsea cables, Firmina, Dunant, Blue and Raman
- High bandwidth 50/75/100Gbps networking for VMs
- Persistent Disk Extreme (block storage) with 120K IOPS
- Filestore High Scale scale-out NFS for HPC
Saves you money
Save money with a transparent and innovative approach to pricing and intelligent recommendations. In the past year, we’ve launched several innovations to help you save costs:
- Tau VMs, which offer the best price-performance among leading clouds for scale-out workloads
- Machine-learning-driven predictive auto-scaling for VMs and GKE Autopilot, enabling infrastructure to scale up and down as needed with minimal waste
- Standard network tier which routes traffic over the internet for cost optimization
Open
We have a long history of leadership in open technologies—from projects like Kubernetes, the industry standard in container orchestration and interoperability, to TensorFlow, a platform to help anyone develop and train machine learning models. Here are a few recent improvements we’ve made to ensure your cloud is an open cloud:
- Extended Anthos to bare metal and Microsoft Azure to support customers who want a multi-cloud and hybrid cloud posture.
- Announced a new network dataplane for Google Kubernetes Engine (GKE) and Anthos that supports eBPF, an open-source Linux kernel technology optimized for Kubernetes.
- Google Kubernetes Engine (based on the Kubernetes standard) received the top overall score based on 2021 Gartner Solution Scorecard for Google Kubernetes Engine.
Secure
Google Cloud’s trusted infrastructure uses layers of security to protect your data with advanced technologies and operations, keeping your organization secure and compliant. For example, we offer:
- Confidential VMs and Confidential GKE with in-memory encryption and encryption keys controlled by you, with a single checkbox
- Enhanced security for Cloud Run
- Strong support against DDoS attacks. In 2017, our infrastructure absorbed the largest-known DDoS attack at 2.5Tbps with no impact to customers.
Sustainable
Google Cloud helps customers transform their business sustainably. We operate the cleanest cloud in the industry to make sure your digital footprint doesn’t leave a carbon one. Here are a few proof points:
- Google has been carbon neutral since 2007, and for the past four years has matched 100% of the electricity we consume globally with wind and solar purchases. Everything you run on Google Cloud is net carbon neutral.
- We continue to innovate towards greater energy efficiency in our data centers, and compared with five years ago, now deliver around seven times as much computing power with the same amount of electrical power.
- Recently we announced new features to help customers reduce the carbon footprint of their applications and infrastructure, including a region picker to help with architecture decisions, and low carbon indicators in the Google Cloud Console.
Supporting our customers
Most importantly, our field organizations and partner organizations work with a singular focus to ensure customer success. This has made Google Cloud the fastest growing hyperscaler, with a rapidly expanding customer base across all geos and industries.
Since launching Customer Care last year, we consolidated and simplified the post-sales engagement with customers, increased the support channels, created an API to allow programmatic case creation, and combined product specific support into a single package for all of Google Cloud. Enterprises with Customer Care continue to report high levels of satisfaction with their focused technical account managers (TAMs), helping them get the most business value out of Google Cloud.
We are committed to sustaining and accelerating the pace of customer-centric innovation. You can download a complimentary copy of the 2021 Magic Quadrant for Cloud Infrastructure and Platform Services on our website.
Join us to learn much more about Google Cloud at the upcoming Google Cloud Next ‘21 digital conference.
Gartner, Magic Quadrant for Cloud Infrastructure and Platform Services, Raj Bala | Bob Gill | Dennis Smith | Kevin Ji | David Wright, 27 July 2021
Gartner, Solution Scorecard for Google Kubernetes Engine, Tony Iams | Traverse Clayton | Megan Bain, 12 April 2021
Gartner does not endorse any vendor, product or service depicted in its research publications, and does not advise technology users to select only those vendors with the highest ratings or other designation. Gartner research publications consist of the opinions of Gartner’s research organization and should not be construed as statements of fact. Gartner disclaims all warranties, expressed or implied, with respect to this research, including any warranties of merchantability or fitness for a particular purpose.
Cloud Bigtable Helps Fraud-detection Company Meet Scalability Demands and Secure Customer Data

7134
Of your peers have already read this article.
3:00 Minutes
The most insightful time you'll spend today!
Editor’s note: Today we are hearing from Jono MacDougall , Principal Software Engineer at Ravelin. Ravelin delivers market-leading online fraud detection and payment acceptance solutions for online retailers. To help us meet the scaling, throughput, and latency demands of our growing roster of large-scale clients, we migrated to Google Cloud and its suite of managed services, including Cloud Bigtable, the scalable NoSQL database for large workloads.
As a fraud detection company for online retailers, each new client brings new data that must be kept in a secure manner and new financial transactions to analyze. This means our data infrastructure must be highly scalable and constantly maintain low latency. Our goal is to bring these new organizations on quickly without interrupting their business. We help our clients with checkout flows, so we need latencies that won’t interrupt that process—a critical concern in the booming online retail sector.
We like Cloud Bigtable because it can quickly and securely ingest and process a high volume of data. Our software accesses data in Bigtable every time it makes a fraud decision. When a client’s customer places an order, we need to process their full history and as much data as possible about that customer in order to detect fraud, all while keeping their data secure. Bigtable excels at accessing and processing that data in a short time window. With a customer key, we can quickly access data, bring it into our feature extraction process, and generate features for our models and rules. The data stays encrypted at rest in Bigtable, which keeps us and our customers safe.
Bigtable also lets us present customer profiles in our dashboard to our client, so that if we make a fraud decision, our clients can confirm the fraud using the same data source we use.

We have configured our bigtable clusters to only be accessible within our private network and have restricted our pods access to it using targeted service accounts. This way the majority of our code does not have access to bigtable and only the bits that do the reading and writing have those privileges.
We also use Bigtable for debugging, logging, and tracing, because we have spare capacity and it’s a fast, convenient location.
We conduct load testings against Bigtable. We started at a low rate of ~10 Bigtable requests per second and we peaked at ~167000 mixed read and write requests per second at absolute peak. The only intervention that was done to achieve this was pressing a single button to increase the number of nodes in the database. No other changes were made.
In terms of real traffic to our production system, we have seen ~22,000 req/s (combined read/write) on Bigtable in our live environment as a peak within the last 6 weeks.
Migrating seamlessly to Google Cloud
Like many startups, we started with Postgres, since it was easy and it was what we knew, but we quickly realized that scaling would be a challenge, and we didn’t want to manage enormous Postgres instances. We looked for a kind of key value store, because we weren’t doing crazy JOINS or complex WHERE clauses. We wanted to provide a customer ID and get everything we knew about it, and that’s where key value really shines.
I used Cassandra at a previous company, but we had to hire several people just for that chore. At Ravelin we wanted to move to managed services and save ourselves that headache. We were already heavy users and fans of BigQuery, Google Cloud’s serverless, scalable data warehouse, and we also wanted to start using Kubernetes. This was five years ago, and though quite a few providers offer Kubernetes services now, we still see Google Cloud at the top of that stack with Google Kubernetes Engine (GKE). We also like Bigtable’s versioning capability that helped with a use case involving upserts. All of these features helped us choose Bigtable.
Migrations can be intimidating, especially in retail where downtime isn’t an option. We were migrating not just from Postgres to Bigtable, but also from AWS to Google Cloud. To prepare, we ran in AWS like always, but at the same time we set up a queue at our API level to mirror every request over to Google Cloud. We looked at those requests to see if any were failing, and confirmed if the results and response times were the same as in AWS. We did that for a month, fine tuning along the way.
Then we took the big step and flipped a config flag and it was 100% over to Google Cloud. At the exact same time, we flipped the queue over to AWS so that we could still send traffic into our legacy environment. That way, if anything went wrong, we could fail back without missing data. We ran like that for about a month, and we never had to fail back. In the end, we pulled off a seamless, issue-free online migration to Google Cloud.
Flexing Bigtable’s features
For our database structure, we originally had everything spread across rows, and we’d use a hash of a customer ID as a prefix. Then we could scan each record of history, such as orders or transactions. But eventually we got customers that were too big, where the scanning wasn’t fast enough. So we switched and put all of the customer data into one row and the history into columns. Then each cell was a different record, order, payment method, or transaction. Now, we can quickly look up the one row and get all the necessary details of that customer. Some of our clients send us test customers who place an order, say, every minute, and that quickly becomes problematic if you want to pull out enormous amounts of data without any limits on your row size. The garbage collection feature makes it easy to clean up big customers.
We also use Bigtable replication to increase reliability, atomicity, and consistency. We need strong consistency guarantees within the context of a single request to our API since we make multiple bigtable requests within that scope. So within a request we always hit the same replica of Bigtable and if we have a failure, we retry the whole request. That allows us to make use of the replica and some of the consistency guarantees, a nice little trade-off where we can choose where we want our consistency to live.https://www.youtube.com/embed/0-eH5u7rrQQ?enablejsapi=1&
We also use BigQuery with Bigtable for training on customer records or queries with complicated WHERE clauses. We put the data in Bigtable, and also asynchronously in BigQuery using streaming inserts, which allows our data scientists to query it in every way you can imagine, build models, and investigate patterns and not worry about query engine limitations. Since our Bigtable production cluster is completely separate, doing a query on BigQuery has no impact on our response times. When we were on Postgres many years ago, it was used for both analysis and real time traffic and it was not the optimal solution for us. We also use Elasticsearch for powering text searches for our dashboard.
If you’re using Bigtable, we recommend three features:
- Key visualizer. If we get latency or errors coming back from Bigtable, we look at the key visualizer first. We may have a hotkey or a wide row, and the visualizer will alert us and provide the exact key range where the key lives, or the row in question. Then we can go in and fix it at that level. It’s useful to know how your data is hitting Bigtable and if you’re using any anti-patterns or if your clients have changed their traffic pattern that exacerbated some issue.
- Garbage collection. We can prevent big row issues by putting size limits in place with the garbage collection policies.
- Cell versioning. Bigtable has a 3d array, with rows, columns, and cells, which are all the different versions. You can make use of the versioning to get history of a particular value or to build a time series within one row. Getting a single row is very fast in Bigtable so as long as you can keep the data volume in check for that row, making use of cell versions is a very powerful and fast option. There are patterns in the docs that are quite useful and not immediately obvious. For example, one trick is to reverse your timestamps (MAXINT64 – now) so instead of the latest version, you can get the oldest version effectively reversing the cell version sorting if you need it.
Google Cloud and Bigtable help us meet the low-latency demands of the growing online retail sector, with speed and easy integration with other Google Cloud services like BigQuery. With their managed services, we freed up time to focus on innovations and meet the needs of bigger and bigger customers.
Learn more about Ravelin and Bigtable, and check out our recent blog, How BIG is Cloud Bigtable?
Google Cloud Featured at TechCrunch Disrupt 2021

4943
Of your peers have already read this article.
1:30 Minutes
The most insightful time you'll spend today!
Startups need to move quickly and focus their limited resources on areas where they can differentiate. If infrastructure isn’t your differentiator, don’t put a lot of energy into your infrastructure when someone else can do it for you. What’s more, time-to-market matters to startups more now than ever. Successful early stage companies know this, and leverage existing tools, libraries, frameworks and innovations whenever possible.
Next week Google Cloud will be featured at TechCrunch Disrupt, the iconic annual event where “founders and investors shaping the future of disruptive technology” come together to share stories, network, and learn from each other. Google Cloud will host a session and Google Cloud engineers will be available in a virtual booth to answer startup questions.
The session, “Demo Derby – How startups are disrupting the status quo with innovative data analytics, AI and modern app development” will be a fun, fast-paced set of presentations showing short demos of startups and startup projects built with Google Cloud.
Demo Derby Presenters
- Andrea Le Vot, Chief Data Protection Officer with startup BlueZoo will deliver a demo showing how they are revolutionizing the property insurance industry with AI and Cloud – and doing so while actually protecting people’s privacy.
- Dale Markowitz and Zack Akil, Applied AI Engineers, will show how easy it is to use AI for everything from video search to editing to automated translation.
- Vidya Nagarajan, Group Product Manager from Google Cloud will deliver a fast paced demo that shows how startups can drive developer productivity with serverless innovations.
“Disrupt is iconic for its engagement with founders, investors, and the broad community of early stage companies,” said Andrea Le Vot, Chief Data Protection Officer at BlueZoo. “We are thrilled to share our insights with others in our community, and to show how we have partnered with Google Cloud to innovate faster than most of the larger, well funded insurance companies in our market.”
The series of snippet sized demos will be followed by a roundtable discussion with the demo developers focused on lessons learned, best practices, how to reduce time-to-market, and how to focus on where you can most effectively differentiate.
The session will air on Day One of the event: Tuesday September 21, 2021 at 1pm PT and will be available on demand after the event for all Disrupt attendees.
Impact of Cloud FinOps on Your Business Can be Measured with Five Key Metrics!

3106
Of your peers have already read this article.
6:00 Minutes
The most insightful time you'll spend today!
Value of Establishing a Baseline for Metrics
As organizations continue to leverage cloud investments to drive their business growth and top line revenue, business, finance, and technology executives need to become increasingly connected in their efforts to deliver strong business outcomes. More than ever before, executives need to quantify the value of their investments in business and technology capabilities. As such, business and IT leaders need a set of value metrics that cover both operational and strategic outcomes, as well as risks and opportunities. Nevertheless, operational IT metrics are often disconnected from business outcomes, and executives need to establish the connection between technology and business outcomes to facilitate a meaningful dialogue between IT and business leaders.
Like many aspects of IT operations, metrics and KPIs are commonly a journey. Organizations typically start this journey with unit metrics focusing on cloud costs and eventually progress toward a set of clearly defined business value metrics.
As we define the set of metrics across the five key building blocks of Cloud FinOps, which include Accountability & Enablement, Measurement & Realization, Cost Optimization, Planning & Forecasting, and Tools & Accelerators, we ensure that these metrics are easily measurable and commonly attainable across the organizations that are on the journey of digital transformation.
Accountability and Enablement Metric
The Accountability and Enablement pillar is foundational to building a culture of cost and value awareness and charts the course for both the process and cultural transformation journey in cloud FinOps. The primary goal is to help drive financial accountability and accelerate business value realization by streamlining IT financial processes and enabling frictionless cloud governance. Enablement empowers IT, finance, and business teams with training to better understand cloud resources and strategies to efficiently deploy and manage them. Driving accountability and enablement starts with a charter and core governance policies, and then guides the transformation of processes that link finance, IT, and business owners.
We recommend adopting Cloud Enablement % as the standard metric for the accountability and enablement pillar, measured by the # of business leaders trained and certified / total # of business leaders in the organization.

This is an important metric as many organizations fail to adopt Cloud FinOps because of lack of awareness and training. This cloud enablement metric will help business leaders better understand the value of cloud and how it can be an enabler to drive sustainable business outcomes.
The cloud enablement metric can easily be implemented through a set goal based on the number of identified business leaders across the organization. With that said, it is important to utilize the Pareto principle of 80/20 rule here and identifying the key business leaders who are extensively consuming services on the cloud should be the primary focus. Google Cloud recently published a new Cloud Digital Leader certification that is aimed for business leaders and executives. By obtaining the Cloud Digital Leader certification, it ensures the individual is well-versed in basic cloud concepts and can demonstrate a broad application of cloud computing knowledge in a variety of applications and how Google Cloud services can help achieve desired business goals. In addition, the FinOps Foundation also provides training and certification to practitioners in a large variety of cloud, finance and technology roles to validate their FinOps knowledge and enhance their professional credibility.

Ultimately, we see that a target goal of over 70% of business leaders achieving the Cloud Digital Leader certification can significantly drive alignment and adoption of Cloud FinOps across the organization and leverage cloud technologies as an enabler to create sustainable business outcomes.
Measurement and Realization Metric
Foundational to any good process is accurate data and effective metrics, which starts with the notion of cloud costs visibility and traceability. This is driven by proper resource hierarchy and project structure standards and supported by a labeling and tagging data architecture behind your organization’s use of cloud resources. While many common tags include IT-driven designators such as application, environment, and project, it is important to design a direct connection to your P&L into your labeling and tagging architecture, by including cost centers or the chart of accounts as tags. Furthermore, automation of tagging ensures that all taggable resources are deployed with consistent and accurate labels and feed FinOps metrics with reliable data.
Establishing consistent and detailed tagging is essential to attributing cloud resources not only to specific products and projects, but also to detailed cost centers aligned with lines of business and associated P&Ls. In order to establish a full chargeback of typical cloud services, customers will need to attribute costs associated with 3 types of cloud resources. The first and most straightforward will be attributing taggable resources (compute instances, databases, and storage buckets) that are aligned to a specific P&L, such as where a given application is solely consumed by one line of business.
The second situation is where taggable resources are shared across multiple lines of business. Many customers will resort to using traditional P&L allocation models, such as using business revenue or headcount of the associated business units to divy up the costs. In order to more accurately allocate shared application costs, leading-edge customers use elements in their cloud microservices architecture, such as API calls, to specifically measure the relative consumption of shared applications.
The third type of cloud resources are those that cannot be tagged. Common examples include support, networking costs, and third party Marketplace costs. Here, traditional P&L allocation models as described above (using headcount or revenue) are commonly used. Some customers will use the relative distribution of their taggable resource allocations to appropriate non-taggable costs to their business units, while some types of costs, such as networking, are allocated based on API calls.
To measure the effectiveness of the Measurement & Realization pillar of cloud FinOps across these three types of cloud resources, we recommend adopting Cloud Allocation % as the lead metric. This metric is measured as the percentage of total cloud costs (taggable resources consumed by individual business units, taggable resources shared across multiple business units, and non-taggable resources) allocated to responsible business owners.

This metric can be used to support both Showback (cloud costs held in a central IT P&L but reported to business units) and Chargeback models (cloud costs fully charged to business unit P&Ls), and reflects the underlying effectiveness and accuracy of resource tagging and cost attribution to business units. Cloud Allocation % can be implemented in two ways. The basic implementation would qualify costs apportioned by any P&L metric (either by consumption or by traditional P&L allocation such as by revenue or headcount). The more advanced implementation of this metric would only qualify those resources (both specific and shared) that use either tagging or API calls to measure consumption and attribute associated costs to business units.

Customers evolving from a Crawl to a Walk stage of implementation will seek to allocate 70% or more of their total cloud costs, while those moving to a Run state will achieve 90% or greater cost attribution based on direct consumption measures.
Cost Optimization Metric
Cloud cost optimization is not just about cutting costs—it’s about knowing where to spend your money to maximize the business value. It is an iterative and continuous process that provides a consistent methodology to visualize and manage cloud consumption in a most cost effective way. Success in cost optimization can result not only in significant reductions of cloud spend, but sometimes also in improved application performance to manage higher traffic (user requests per seconds or transaction processed) within the same cost envelope.
It is important for an organization to automate reports generated by ingesting billing usage and cost data as well as recommendations generated for optimizations. These optimizations reflect the potential savings (also known as unrealized savings) which allows the team to prioritize implementations to realize the cost savings.
Typically potential savings contains adoption of:
- Pricing optimizations like Committed Use Discounts (resource-based and spend-based), BigQuery reservations, etc.
- Resource optimizations of wasteful resources (including aged snapshots, idle instances, and over-sized databases) that don’t provide any business value.

Capturing this metric is important as it allows the organization to keep a pulse on inefficiencies that exist in the organization and allows businesses to focus on achieving cost savings thereby capturing true value of running their workloads in the cloud.
The cost optimization metric can be implemented by integrating Recommendation Hub in your FinOps workflows. Recommendations Hub is part of Active Assist that contains a portfolio of intelligent tools and capabilities to help you optimize your workloads with minimal effort. It surfaces a summary of all recommendations across your projects along with potential cost savings ($) so you can prioritize your cost optimization effort. We have seen customers realize savings by taking action on recommendations generated by idle VM recommender, Committed Use Discount recommender, VM machine type recommender and many more.

Ultimately we see customers achieving realized savings of over 90% on total cloud service optimizable. We have seen customers reinvest these savings into creating differentiated products and offerings and improving their customer experience, thus accelerating business value realization from the cloud.
Planning and Forecasting Metric
Financial planning is a foundational capability within finance organizations that will directly influence each company’s capabilities of cloud computing forecast accuracy. Financial planning focuses on accurately forecasting financial metrics that are set on an annual basis to guide the company’s financial objectives. The annual plans are measured on a quarterly basis and adjusted based on performance throughout the year; the forecast performance is monitored on a monthly basis to help influence operational results.
Planning and forecasting cloud computing costs is typically the responsibility of the team responsible for cloud operations. Operational forecast planning is based on consumption workload plans, historical trajectory, seasonality and leading indicators. Transformational projects also create material risks to forecast accuracy.
Establishing accurate financial forecasting in the cloud spend requires rethinking traditional approaches to asset depreciation run-outs and trend-based forecasting of maintenance and licensing costs. Using workload-specific forecasting models that leverage a combination of trend-based models for steady-state workloads, driver-based models for scaling applications, as well as monthly variance analysis can greatly improve the accuracy of dynamic cloud needs.
Capturing and measuring forecast accuracy enables companies to understand if they do what they plan. Companies get what they measure and so by measuring and discussing variances to forecast accuracy it enables better control of cloud spend allocations.
Cloud computing forecast accuracy should be included as a topic that Finance and Cloud operations teams discuss at least monthly. The cloud operations team should monitor forecast trajectory during the month and evaluate adjustments when they identify unexpected shifts.
An effective forecast accuracy is one that avoids surprises to company executives and investors. Cloud computing often has more variability and seasonality than depreciation of capex from on prem environments. Coordinating project and sprint agile management can help avoid surprises. If a development change creates an unexpected jump in spending then change management processes should be reviewed to avoid future surprises.
Tools and Accelerators Metric
Employing proper tools and accelerators are important to fully benefiting from FinOps practices. In earlier stages, companies may have limited their ability to report detailed analysis of cloud spend. As practices mature and improve, labeling and tagging of resources proves valuable to understanding costs for specific projects/teams and for building unit cost metrics.
These capabilities can become even more powerful through automated monitoring of resources that offers insights on spend, value, compliance and recommendations.
Therefore the recommended measure of Tools & Accelerators maturity is to evaluate the # of automated recommendations that have been implemented as a % of total list of automated recommendations generated that results in cost savings
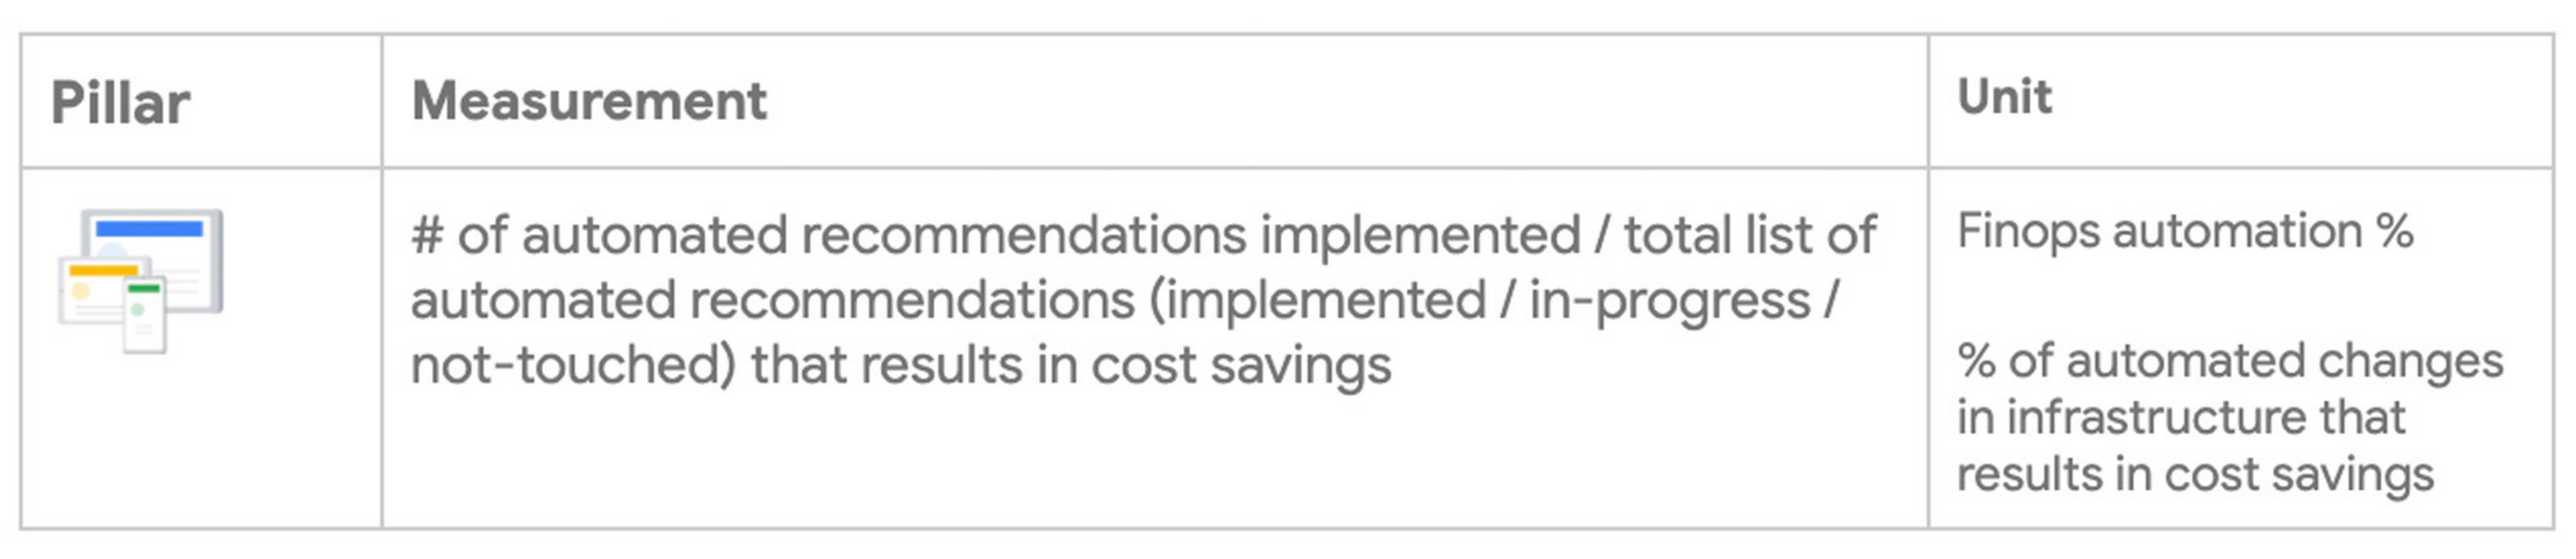
This is an important metric because as the organization onboards newer workloads to the Cloud environment, lack of robust actionable recommendations and monitoring can lead to increased cloud waste. This has been a key component prohibiting organizations from realizing the total value of their cloud investment.
Customers starting on their tool maturity journey can leverage Google’s out of the box recommendations Hub to get started. The Recommendation Hub is a place in the Google Cloud Console where you can view, prioritize, and apply these recommendations. Some examples include VM right sizing recommendations, BQ slot optimizations, Committed use Discount etc, Idle resource recommendations. This can further be integrated into any existing enterprise tooling using the recommendations API. As organizations mature, they can leverage Cloud Monitoring to create advanced recommendations based on custom business logic.
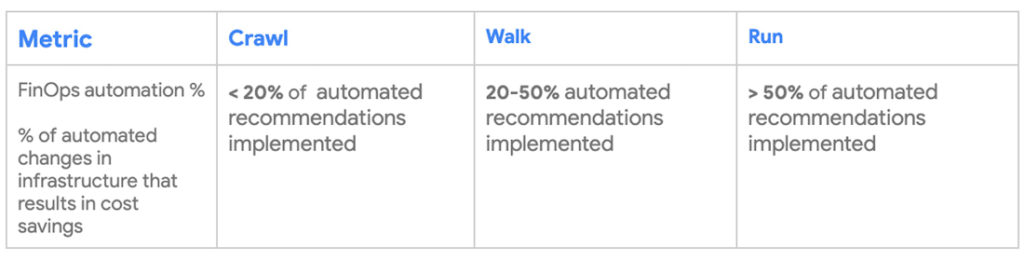
Ultimately, we see that a target goal of over 50% of automated recommendations implemented as the tooling for surfacing recommendations matures and this will ensure that the organization can minimize and eliminate cloud waste to maximize value from cloud investment.
Bringing this together with a Cloud FinOps Dashboard
As technology and business goals continue to evolve over time, it is essential to establish a process where the Cloud FinOps metrics are continuously reviewed whenever the goals change. Furthermore, it is important to note that not all organizations need to achieve the “Run” state of the identified metrics target. The metrics are means to achieve the business outcomes based on the organization’s priorities. By collaborating with cross-functional teams to quantify and measure the impact of the Cloud FinOps metrics, executive leaders can quickly obtain buy-in, highlight common-shared goals, and move fast.
At Google Cloud, we have developed solutions to help our customers build a Cloud FinOps Dashboard to capture these metrics to drive a culture of change and equip the transformation and business leaders with the tools to share and track the results of the key metrics. Successful adoption of the Cloud FinOps metrics enable organizations to focus on the business outcomes and the dashboard provides a meaningful feedback loop to report on the impact and drive visibility across the organization.
So, where are you now in your FinOps journey, and how do you move beyond the challenges ahead? Google can help you start the conversation and accelerate your path to maximizing business value with the cloud.
No matter where you are on the cloud transformation journey, through an interactive session with Google, we can bring executives across the organization together to work toward a shared vision and a plan to accelerate and realize business value in the cloud. If you are interested in more information, please contact us.
Special thanks to Daniel Pettibone, Amitai Rottem, Bruce Warner, Jon Naseath, and Nihar Jhawar for co-authoring and contributing to this blog post and the members of the FinOps Foundation including J.R. Storment, Vas Markanastasakis, Anders Hagman, John McLoughlin, Mike Bradbury, and Rich Hoyer for providing their domain expertise and continuous support to this important cloud FinOps topic.
How One Company Improved Security Significantly–Without Increasing Staff

6468
Of your peers have already read this article.
2:45 Minutes
The most insightful time you'll spend today!
Quanta Services is the leading specialty contractor with the largest and highly-skilled trained workforce in North America. It provides fully-integrated solutions for the electric power
pipeline industrial and telecommunications industries the company’s geographic footprint which includes North America Latin America and Australia.
It’s network of companies ensures world-class execution with local delivery and has over 40,000 employees.
“The exciting thing about Backstory is it allows us to land massive amounts of data from all of our different security tools and then Chronicle worries about how to correlate and aggregate this information for us. We can then focus on the highest priority threats.”
Richard Breaux, Manager Security Operations Quanta Services
Because Quanta Services’ customers provide energy and telecommunications to their customers, they have world-class cybersecurity requirements.
“We must ensure that Quanta leads the industry given the fact that our business is building the core infrastructure that powers people’s lives. It’s crucial that we meet their cybersecurity requirements,” says James Stinson, VP-IT, Quanta Services.
To support this goal Quanta implemented a number of security tools that generate terabytes of security telemetry. Over time, however, these systems generated an information overload for the company’s limited pool of qualified security resources.
“Our logging tools also couldn’t keep up with the rapidly growing information. With limited resources we need to focus our security analysts time on high quality work instead of digging through mountains of data,” says Stinson.
They achieve this by implementing Backstory and Chronicle, which is on Google Cloud.
“The exciting thing about Backstory is it allows us to land massive amounts of data from all of our different security tools and then Chronicle worries about how to correlate and aggregate this information for us. We can then focus on the highest priority threats,” says Richard Breaux, Manager Security Operations Quanta Services.
As a result, the company’s security team spends less time getting to the core information they need to address these incidents.
“What used to take us 15 minutes or more, we can now accomplish in seconds,” says Breaux.
3639
Of your peers have already watched this video.
1:30 Minutes
The most insightful time you'll spend today!
How McKesson Gains Insights by Running SAP on Google Cloud
McKesson, a 185-yeal old, $200 billion, Fortune 6 pharmaceuticals and health information technology company, with over 80,000 employees migrated their SAP solution to Google Cloud for advanced healthcare analytics.
With changing consumer expectations, the company needed to change its architecture to be able to better serve its customers. And the old on-premise infrastructure was hindering the company from being able to meet those expectations.
Watch this video as Andrew Zitney, SVP and CTO at McKesson, explains how SAP on GCP helps the 180-year old company modernize and meet the changing expectations.
More Relevant Stories for Your Company




Skincare Firm Scales 4X in Minutes with SAP on Google Cloud
As the number one skincare brand in the United States, Rodan + Fields must support its team of over 300,000 of independent contractors as well as work to ensure a really personalized experience for customers. To keep pace with the company’s growth, Rodan + Fields realized it needed a more



Google Cloud’s ML-based Image Classification App: A Key to Global Wildlife Conservation
Wildlife provides critical benefits to support nature and people. Unfortunately, wildlife is slowly but surely disappearing from our planet and we lack reliable and up-to-date information to understand and prevent this loss. By harnessing the power of technology and science, we can unite millions of photos from [motion sensored cameras]

Google’s New Climate Innovation Challenge to Fight Energy Crisis and Build Climate Resilience
At Google, we believe that when it comes to solving a problem as big and urgent as climate change, we get more done when we collaborate. From beekeepers in Germany to urban foresters in Los Angeles, we support the work of nonprofits, scientists, and organizations that are working to mitigate

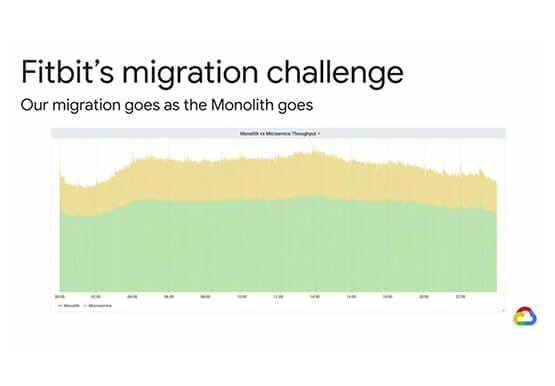
Fitbit’s Zero-Downtime Migration to GCP
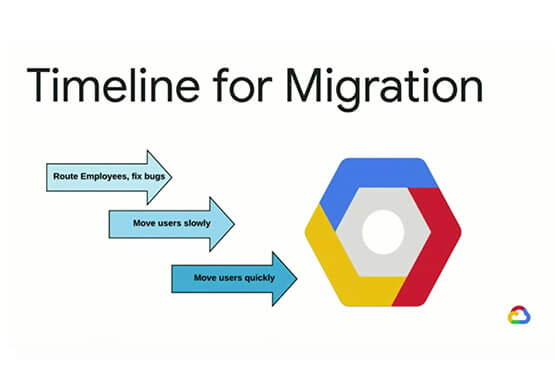
In 2019, Fitbit moved all of its production operations from managed hosting to Google Cloud Platform without any downtime. The Fitbit experience is provided by a monolithic application backed by 200+ data stores, making the task of moving service by service impossible. So, Fitbit decided to run services in both
