





Apache and Dataflow Help with Real-time Indices Processing for Financial Institutions
4907
Of your peers have already read this article.
4:00 Minutes
The most insightful time you'll spend today!
Financial institutions across the globe rely on real-time indices to inform real-time portfolio valuations, to provide benchmarks for other investments, and as a basis for passive investment instruments including exchange-traded products (ETPs). This reliance is growing—the index industry dramatically expanded in 2020, reaching revenues of $4.08 billion.
Today, indices are calculated and distributed by index providers with proximity and access to underlying asset data, and with differentiating real-time data processing capabilities. These providers offer subscriptions to real-time feeds of index prices and publish the constituents, calculation methodology, and update frequency for each index.
But as new assets, markets, and data sources have proliferated, financial institutions have developed new requirements. Financial institutions will need to quickly create bespoke and frequently updating indices that represent a specific actual or theoretical portfolio, with its unique constituents and weightings.
In other words, existing index providers and other financial institutions alike will need mechanisms for rapid creation of real-time indices. This blog post’s focus—an index publication pipeline collaboratively developed by CME Group and Google Cloud—is an example of such a mechanism.
The pipeline closely approximates a particular CME Group index benchmark, but with far greater frequency (in near real time vs. daily) than its official counterpart. It does so by leveraging open-source models such as Apache Beam and cloud-based technologies such as Dataflow, which automatically scales pipelines based on inbound data volume.

Machine learning’s production problem
In the past decade, advances in AI toolchains have enabled faster ML model training—and yet a majority of ML models are still not making it into production. As organizations endeavor to develop their ML capabilities, they soon realize that a real-world ML system is comprised of a small amount of ML code embedded in a network of complex and large ancillary components. Each component brings its own development and operational challenges, which are met by bringing a DevOps methodology to the ML system, commonly referred to as MLOps (Machine Learning Operations). To apply ML to business problems, a firm must develop continuous delivery and automation pipelines for ML.
This index publication collaboration is instructive because it demonstrates MLOps best practices for just such a pipeline. One Apache Beam pipeline, suited for operating on both batch and streaming data, extracts insights and packages them for downstream consumers. These consumers may include ML pipelines that, thanks to Apache Beam, require only one code path for inference across batch and real-time data sources. The pipeline is run inside Google Cloud’s Dataflow execution engine, greatly simplifying management of underlying compute resources.
But the collaboration’s value is not constrained to the ML and data science realm. The project shows that consumers of the Apache Beam pipeline’s insights may also include traditional business intelligence dashboards and reporting tools. It also demonstrates the simplicity and economy of cloud-based time series data such as CME Smart Stream, which is metered by the hour, quickly and automatically provisioned, and consumable at a per-product-code (not per-feed) level.
A focus on real-time processing for financial services
To illustrate the above points, the collaboration applies data engineering and MLOps best practices to a financial services problem. We chose the financial services domain because many financial institutions do not yet have real-time market data processing or MLOps capabilities today, owing to a significant gap on either side of their ML/AI objectives.
Upstream from ML/AI models, financial institutions often experience a data engineering gap. For many financial institutions, batch processes have sufficiently addressed business requirements. As a result, the temporal nature of the time series data underlying these processes is deemphasized. For example, the original purpose of most trade booking systems was to capture a trade and ensure that it found its way to the middle and back office for settlement. It was not built with ML/AI in mind, and its underlying data therefore has not been packaged for consumption by ML/AI processes.
And downstream from ML/AI models, financial institutions often encounter the aforementioned “ML production problem.”
As ML/AI becomes ever more strategic, these two gaps have left many financial institutions in a conundrum—unable to train ML models for lack of properly packaged time series data, and unmotivated to package time series data for lack of ML models. By recreating a key energy market index using open-source libraries and cloud-based tools, this collaboration demonstrates that for the financial services domain a solution to this conundrum is more accessible today than ever.
Creating a new index
We modeled our new index after one of CME Group’s many index benchmarks. The particular index expresses the value of a basket of three New York Mercantile Exchange—listed energy futures as a single price. Today, CME Group publishes the index at the end of the day by calculating the settlement price of each underlying futures contract, and then weighing and summing these values.
While CME Group does not currently publish this index in real time, this collaboration aims to create a near real-time solution leveraging Google Cloud capabilities and CME Group market data delivered via CME Smart Stream. However, in order to publish the value so frequently—every five seconds, with 40-second publish latency—this collaboration’s pipeline has to solve a number of challenges in near-real time.
First, the pipeline must process sparse data from three separate trades feeds in memory to create open-high-low-close (OHLC) bars. More specifically, for five-second windows for each of the three front-month (and sometimes second-month) energy contracts, a bar must be produced. This is solved by using the Apache Beam library to implement functions which, when executed on Dataflow, automatically scale out as input load increases. The bars must be time-aligned across the underlying feeds, which is greatly simplified by Beam’s watermark feature. And for intervals in which no tick data is observed, the Beam library is used to pull forward the last value received, yielding perfect gap-free bars for downstream processors.
Second, the pipeline must calculate volume-weighted average price (VWAP) in near real-time for each front-month contract. The VWAP calculations are also written using the Beam API and executed on Dataflow. Each of these functions requires visibility of each element in the time window, so the functions cannot be arbitrarily scaled out. Nonetheless, this is tractable because their input—OHLC bars—is manageably small.
Third, the pipeline must replicate CME Group’s specific settlement price methodology for each contract. The rules specify whether to use VWAP or another source as price, depending on certain conditions. They also specify how to weigh combinations of monthly contracts during a roll period. The pipeline again encapsulates these requirements as an Apache Beam class, and joins the separate price streams at the correct time boundary.
The end result is a new stream publishing bespoke index data to a Google Cloud Pub/Sub topic thousands of times daily, enabling AI models as well as traditional industry index usage, dashboards, and other tools to assist real-time decision making. The stream’s pipeline uses open source libraries that solve common time series problems out-of-the box, and cloud-based services to reduce the user’s operational and scaling burden.

The importance of cloud-based data
The promise of cloud-based pipeline execution services cannot be realized using legacy data access patterns, which often require market data users to colocate and configure servers and network gear. Such patterns inject expense and scaling complexity into the pipeline’s overall operation, diverting resources from the adoption of MLOps best practices. Instead, a newer, cloud-based access pattern—in which resources subscribe to data streams inexpensively, rapidly and programatically—is necessary.
In 2018, CME Group identified the customer need for accessible futures and options market data. CME Group collaborated with Google Cloud to launch CME Smart Stream, which distributes CME Group’s real-time market data across Google Cloud’s global infrastructure with sub-second latency. Any customer with a CME Group data usage license and a Google Cloud project can consume this data for an hourly usage fee, without purchasing and configuring servers and network gear.
CME Smart Stream met this index pipeline’s requirements for cost-effective, cloud-based streaming data, but this is just one use case. Since the launch of a CME Smart Stream offering on Google Cloud, globally dispersed firms have adopted the solution. For example, Coin Metrics has been using the offering to better inform its customers in the crypto markets. According to CME Group, Smart Stream has become popular with new customers as the fastest, simplest way to access CME Group’s market data from anywhere in the world.
Adapt the design pattern to your needs
By combining cloud-based data, open-source libraries, and cloud-based pipeline execution services, we created a real-time index using the same constituents as its end-of-day counterpart. Additionally, financial institutions will find this approach addresses many other challenges—real-time valuation of a large set of portfolios; benchmark creation for new ETPs; or external publication of new indices.
Give it a try
This approach is available to help you meet your organization’s needs. Please review our user guide, whose Tutorials section provides a step-by-step guide to constructing a simple Apache Beam pipeline to generate metrics on streaming data in real-time, and connecting a new data source to the pipeline. We’ll be discussing this topic in CME Group’s webinar End-to-End Market Data Solutions in the Cloud at 10:30 am ET on June 16th.
3021
Of your peers have already watched this video.
19:00 Minutes
The most insightful time you'll spend today!
Driving Business Transformation in Healthcare Using Google Cloud and AI/ML
Before the COVID-19 pandemic, when you thought of healthcare and AI, a number of ideas sprang to mind. But the world, especially as it relates to healthcare has seen a completely different type of transformation as a result of COVID-19.
This video is about how Google Cloud is helping organizations respond to COVID-19 leveraging AI and ML and Google Cloud’s healthcare and life sciences products as well as some of the work that its partners are doing.
Joe Corkery, Director, Product Management – Google Cloud, and Thomas C. Tsai, MD, MPH – Department of Surgery at Brigham and Women’s Hospital, will run over the application of AI to COVID forecasting, how Google Cloud’s healthcare-specific product offerings are being used to address COVID-19 and highlight work being done by one a Google Cloud partner in that area and how it’s being used to combat COVID-19.
BigQuery ML for Sentiment Analysis: How to Make the Most of Your Data

1812
Of your peers have already read this article.
4:30 Minutes
The most insightful time you'll spend today!
Introduction
We recently announced BigQuery support for sparse features which help users to store and process the sparse features efficiently while working with them. That functionality enables users to represent sparse tensors and train machine learning models directly in the BigQuery environment. Being able to represent sparse tensors is a useful feature because sparse tensors are used extensively in encoding schemes like TF-IDF as part of data pre-processing in NLP applications and for pre-processing images with a lot of dark pixels in computer vision applications.
There are numerous applications of sparse features such as text generation and sentiment analysis. In this blog, we’ll demonstrate how to perform sentiment analysis with the space features in BigQuery ML by training and inferencing machine learning models using a public dataset. This blog also highlights how easy it is to work with unstructured text data on BigQuery, an environment traditionally used for structured data.
Using sample IMDb dataset
Let’s say you want to conduct a sentiment analysis on movie reviews from the IMDb website. For the benefit of readers who want to follow along, we will be using the IMDb reviews dataset from BigQuery public datasets. Let’s look at the top 2 rows of the dataset.
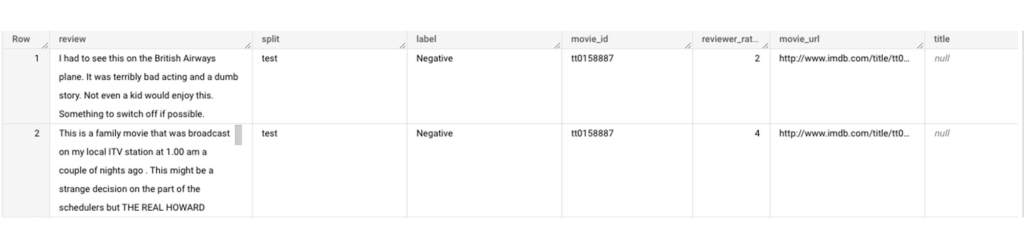
Although the reviews table has 7 columns, we only use reviews and label columns to perform sentiment analysis for this case. Also, we are only considering negative and positive values in the label columns. The following query can be used to select only the required information from the dataset.
SELECT
 review,
 label,
FROM
 `bigquery-public-data.imdb.reviews`
WHERE
 label IN ('Negative', 'Positive')
The top 2 rows of the result is as follows:
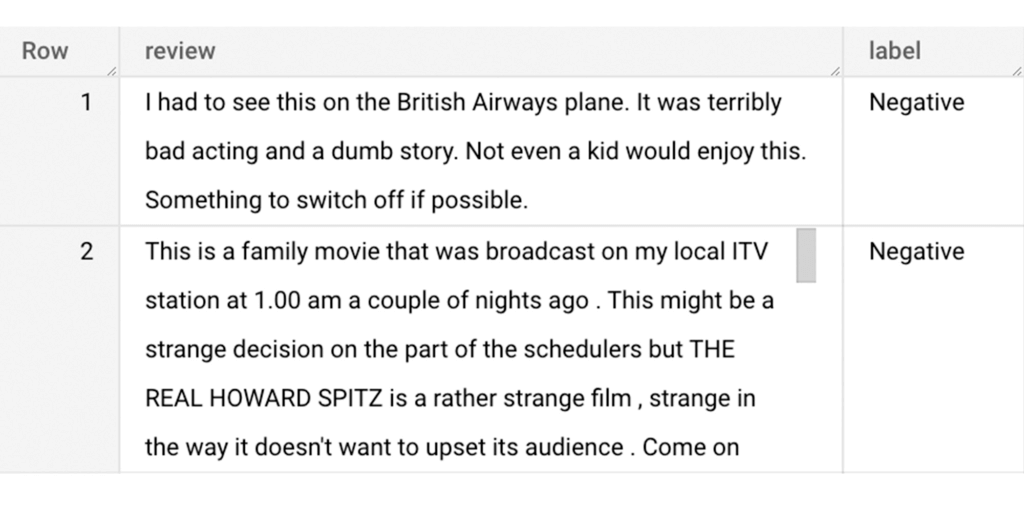
Methodology
Based on the dataset that we have, the following steps will be carried out:
- Build a vocabulary list using the review column
- Convert the review column into sparse tensors
- Train a classification model using the sparse tensors to predict the label (“positive” or “negative”)
- Make predictions on new test data to classify reviews as positive or negative.
Feature engineering
In this section, we will convert the text from the reviews column to numerical features so that we can feed them into a machine learning model. One of the ways is the bag-of-words approach where we build a vocabulary using the words from the reviews and select the most common words to build numerical features for model training. But first, we must extract the words from each review. The following code creates a dataset and a table with row numbers and extracted words from reviews.
-- Create a dataset named `sparse_features_demo` if doesn’t exist
CREATE SCHEMA IF NOT EXISTS sparse_features_demo;


-- Select unique reviews with only negative and positive labels
CREATE OR REPLACE TABLE sparse_features_demo.processed_reviews AS (
 SELECT
   ROW_NUMBER() OVER () AS review_number,
   review,
   REGEXP_EXTRACT_ALL(LOWER(review), '[a-z]{2,}') AS words,
   label,
   split
 FROM (
   SELECT
     DISTINCT review,
     label,
     split
   FROM
     `bigquery-public-data.imdb.reviews`
   WHERE
     label IN ('Negative', 'Positive')
 )
);
The output table from the query above should look like this:
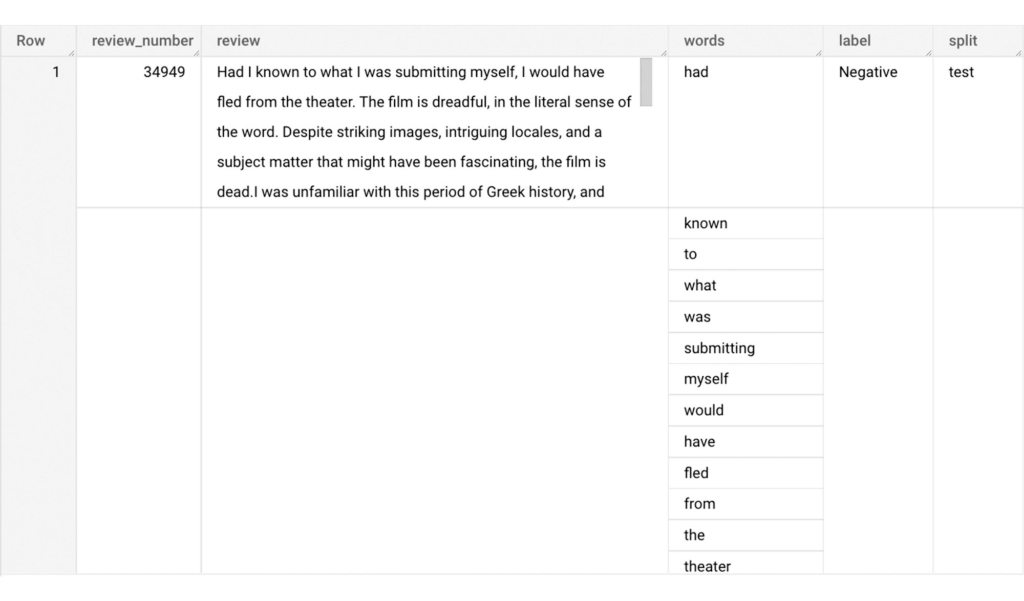
The next step is to build a vocabulary using the extracted words. The following code creates a vocabulary including word frequency and word index from reviews. For this case, we are going to select only the top 20,000 words to reduce the computation time.
-- Create a vocabulary using train dataset and select only top 20,000 words based on frequency
CREATE OR REPLACE TABLE sparse_features_demo.vocabulary AS (
 SELECT
   word,
   word_frequency,
   word_index
 FROM (
   SELECT
     word,
     word_frequency,
     ROW_NUMBER() OVER (ORDER BY word_frequency DESC) - 1 AS word_index
   FROM (
     SELECT
       word,
       COUNT(word) AS word_frequency
     FROM
       sparse_features_demo.processed_reviews,
       UNNEST(words) AS word
     WHERE
       split = "train"
     GROUP BY
       word
   )
 )
 WHERE
   word_index < 20000 # Select top 20,000 words based on word count
);
The following shows the top 10 words based on frequency and their respective index from the resulting table of the query above.
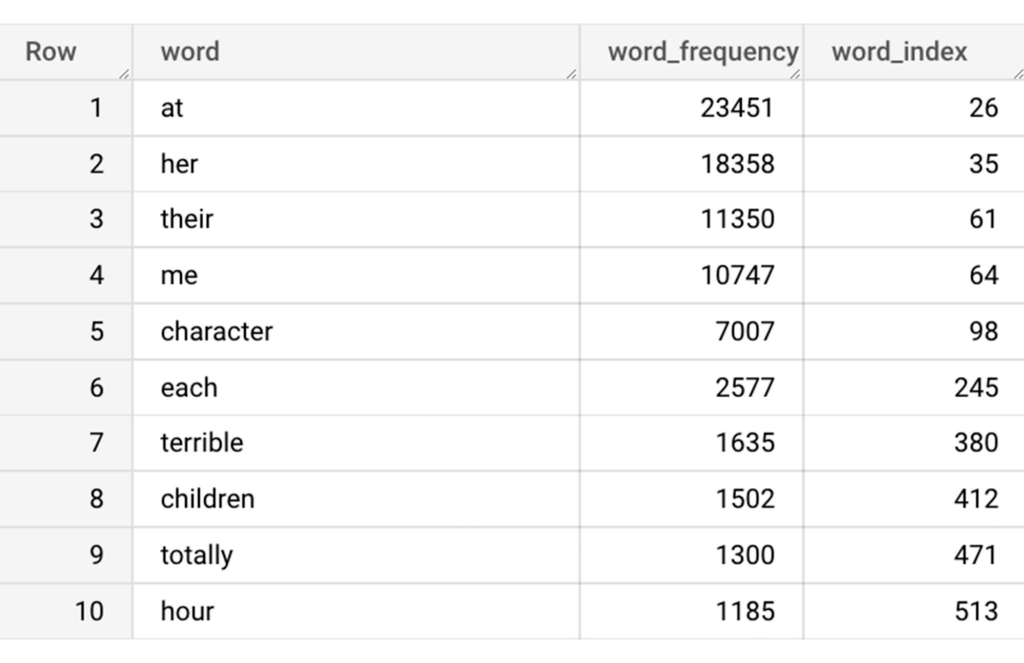
Creating a sparse feature
Now we will use the newly added feature to create a sparse feature in BigQuery. For this case, we aggregate word_index and word_frequency in each review, which generates a column as ARRAY[STRUCT] type. Now, each review is represented as ARRAY[(word_index, word_frequency)].
-- Generate a sparse feature by aggregating word_index and word_frequency in each review.
CREATE OR REPLACE TABLE sparse_features_demo.sparse_feature AS (
 SELECT
   review_number,
   review,
   ARRAY_AGG(STRUCT(word_index, word_frequency)) AS feature,
   label,
   split
 FROM (
   SELECT
     DISTINCT review_number,
     review,
     word,
     label,
     split
   FROM
     sparse_features_demo.processed_reviews,
     UNNEST(words) AS word
   WHERE
     word IN (SELECT word FROM sparse_features_demo.vocabulary)
 ) AS word_list
 LEFT JOIN
   sparse_features_demo.vocabulary AS topk_words
   ON
     word_list.word = topk_words.word
 GROUP BY
   review_number,
   review,
   label,
   split
);
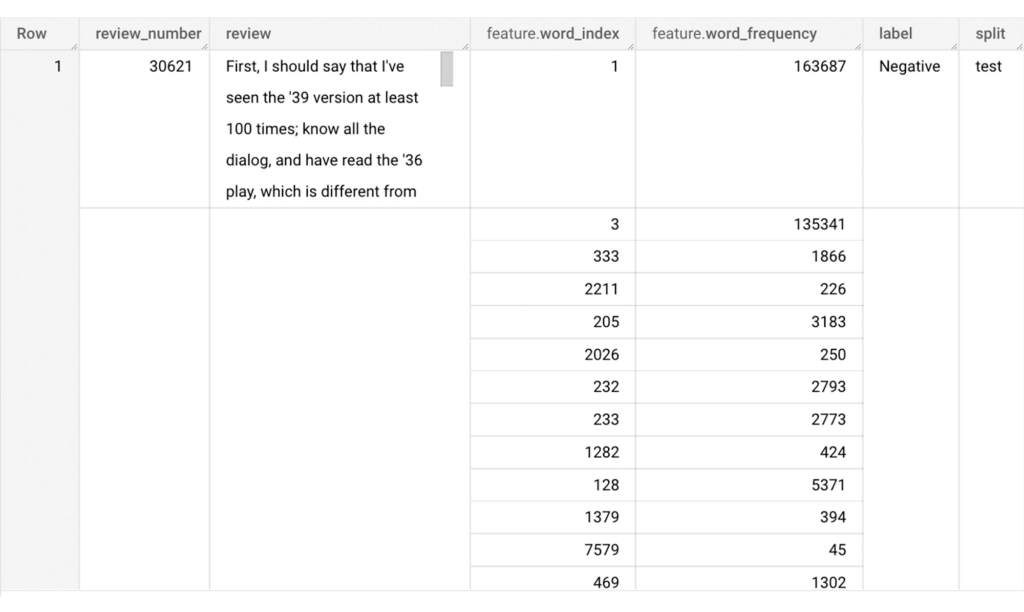
Once the query is executed, a sparse feature named `feature` will be created. That `feature` column is an `ARRAY of STRUCT` column which is made of `word_index` and `word_frequency` columns. The picture below displays the resulting table at a glance.
Training a BigQuery ML model
We just created a dataset with a sparse feature in BigQuery. Let’s see how we can use that dataset to train with a machine learning model with BigQuery ML. In the following query, we will train a logistic regression model using the review_number, review, and feature to predict the label:
-- Train a logistic regression classifier using the data with sparse feature
CREATE OR REPLACE MODEL sparse_features_demo.logistic_reg_classifier
 TRANSFORM (
   * EXCEPT (
       review_number,
       review
     )
 )
 OPTIONS(
   MODEL_TYPE='LOGISTIC_REG',
   INPUT_LABEL_COLS = ['label']
 ) AS
 SELECT
   review_number,
   review,
   feature,
   label
 FROM
    sparse_features_demo.sparse_feature
 WHERE
   split = "train"
;
Now that we have trained a BigQuery ML Model using a sparse feature, we evaluate the model and tune it as needed.
-- Evaluate the trained logistic regression classifier
SELECT * FROM ML.EVALUATE(MODEL sparse_features_demo.logistic_reg_classifier);
The score looks like a decent starting point, so let’s go ahead and test the model with the test dataset.

-- Evaluate the trained logistic regression classifier using test data
SELECT * FROM ML.EVALUATE(MODEL sparse_features_demo.logistic_reg_classifier,
 (
   SELECT
     review_number,
     review,
     feature,
     label
   FROM
     sparse_features_demo.sparse_feature
   WHERE
     split = "test"
 )
);
The model performance for the test dataset looks satisfactory and it can now be used for inference. One thing to note here is that since the model is trained on the numerical features, the model will only accept numeral features as input. Hence, the new reviews have to go through the same transformation steps before they can be used for inference. The next step shows how the transformation can be applied to a user-defined dataset.
Sentiment predictions from the BigQuery ML model
All we have left to do now is to create a user-defined dataset, apply the same transformations to the reviews, and use the user-defined sparse features to perform model inference. It can be achieved using a WITH statement as shown below.
WITH
 -- Create a user defined reviews
 user_defined_reviews AS (
   SELECT
     ROW_NUMBER() OVER () AS review_number,
     review,
     REGEXP_EXTRACT_ALL(LOWER(review), '[a-z]{2,}') AS words
   FROM (
     SELECT "What a boring movie" AS review UNION ALL
     SELECT "I don't like this movie" AS review UNION ALL
     SELECT "The best movie ever" AS review
   )
 ),


 -- Create a sparse feature from user defined reviews
 user_defined_sparse_feature AS (
   SELECT
     review_number,
     review,
     ARRAY_AGG(STRUCT(word_index, word_frequency)) AS feature
   FROM (
     SELECT
       DISTINCT review_number,
       review,
       word
     FROM
       user_defined_reviews,
       UNNEST(words) as word
     WHERE
       word IN (SELECT word FROM sparse_features_demo.vocabulary)
   ) AS word_list
   LEFT JOIN
     sparse_features_demo.vocabulary AS topk_words
     ON
       word_list.word = topk_words.word
   GROUP BY
     review_number,
     review
 )


-- Evaluate the trained model using user defined data
SELECT review, predicted_label FROM ML.PREDICT(MODEL sparse_features_demo.logistic_reg_classifier,
 (
   SELECT
     *
   FROM
     user_defined_sparse_feature
 )
);
Here is what you would get for executing the query above:
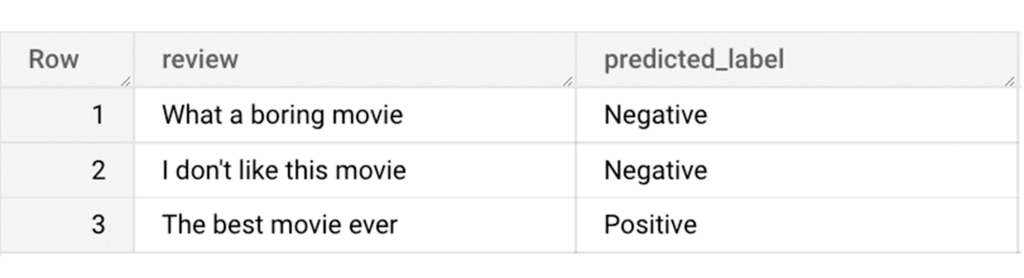
And that’s it! We just performed a sentiment analysis on the IMDb dataset from a BigQuery Public Dataset using only SQL statements and BigQuery ML. Now that we have demonstrated how sparse features can be used with BigQuery ML models, we can’t wait to see all the amazing projects that you would create by harnessing this functionality.
If you’re just getting started with BigQuery, check out our interactive tutorial to begin exploring.
Sainsbury’s Uses AI to Figure Out How the World Eats

8979
Of your peers have already read this article.
4:45 Minutes
The most insightful time you'll spend today!
Retail will forever be an industry that must constantly reinvent itself in response to, and anticipation of, ever-changing consumer demands.
Digital transformation is fueling these changes and we’ve previously spoken about how businesses including Ulta Beauty and Kohl’s are taking advantage of Google Cloud to put data at the center of what they do and deliver the best possible shopping experience and product offerings for their customers.
Leveraging Google Cloud machine learning platform, Sainsbury is able to develop predictive analytics models to spot trends and adjust inventory, providing shoppers with a better experience.
Sainsbury’s, one of Britain’s best-known supermarkets, is another great example of a business transforming the way it engages with its customers with the cloud.
With over 150 years of service, Sainsbury’s vision is to be the most trusted retailer, where people love to work and shop. It makes customers’ lives easier, by offering great quality and service at fair prices.
The food industry and the way that customers shop is rapidly changing. From foodie hashtags on Instagram, to the latest cooking fads, customers want to stay connected to the latest trends and Sainsbury’s is empowering them do that.
To help Sainsbury’s achieve this goal, its Commercial and Technology teams, in partnership with Accenture, are building cutting-edge machine learning solutions on Google Cloud Platform (GCP) to provide new insights on what customers want and the trends driving their eating habits.
With the help of Google Cloud Platform, we are generating new insights into how the world eats and lives, to help us stay ahead of market trends and provide an even better shopping experience for our customers.
–Phil Jordan, Group CIO, Sainsbury’s
Sainsbury’s solution relies on data from multiple structured and unstructured sources. Using Google Cloud’s powerful cloud-based analytics tools to ingest, clean and classify that data, and a custom-built front-end interface for internal users to seamlessly navigate through a variety of filters and categories, Sainsbury’s is able to gain advanced insights in real time.
As a result, Sainsbury’s has been able to develop predictive analytics models to spot trends and adjust inventory, providing shoppers with a better experience.
Phil Jordan, Group CIO of Sainsbury’s believes this project will have a big impact.
“The grocery market continues to change rapidly. We know our customers want high quality at great value and that finding innovative and distinctive products is increasingly important to them. With the help of Google Cloud Platform, we are generating new insights into how the world eats and lives, to help us stay ahead of market trends and provide an even better shopping experience for our customers.”
This project is also a great example of the successes Google Cloud customers have when they work with the company’s partners.
“We’re delighted to partner with Google Cloud to help the Sainsbury’s Commercial team apply predictive analytics to the identification of new and emerging trends in grocery,” says Adrian Bertschinger, Managing Director for Retail, Accenture.
“The food sector is experiencing significant, rapid disruption, and this new, cloud-based insights platform will help Sainsbury’s identify trends much earlier and adapt their product assortment in a faster, more informed way—all for the benefit of customers.”
Whatever the next food or shopping trend may be, Sainsbury’s is looking to the cloud to help them stay a step ahead.
Making Your Pictures Worth a Thousand Labels! (with Cloud Vision API)

1202
Of your peers have already read this article.
2:30 Minutes
The most insightful time you'll spend today!
In this post, I’ll be showing some amazing ways the Vision API can extract meaning from your images – keep reading, or jump directly into a tutorial using Python, Node.js, Go, or Java! This tutorial can be completed at no cost within the Google Cloud Free Tier.
They say a picture is worth a thousand words. But how do you make those words available and useful? Around the world, we are generating more images than ever before, and it’s no surprise that businesses are turning to image recognition technology to help meet the immense opportunities created with this growing set of data.
Cloud Vision API is a powerful tool that enables you to perform a variety of tasks including label detection, text recognition, and object tracking on your image data. Whether it’s identifying products in a retail store, analyzing social media posts for brand mentions, or scanning through millions of images to find a specific object, the Cloud Vision API can help businesses automate their image analysis workflows and gain valuable insights from their visual data. To protect privacy, and help you build responsibly, the Cloud Vision API offers features to limit personal identification, such as person blur, which hides identifiable features.
Let’s explore a few of the key features of the Cloud Vision API.
Detect famous landmarks
Landmark detection allows you to analyze images to identify specific landmarks such as buildings, natural features, and other recognizable locations. Cloud Vision API recognizes landmarks and provides information about them, including their name, location, and other relevant details. Perhaps you are trying to identify the landmarks in images shared by customers as part of social campaigns, or want to build a mobile app that provides information to tourists on famous landmarks.
In the below left-hand side image, Cloud Vision API has detected the Eiffel Tower, shown in the visualized response. Not shown in this visualization here, but also detected, were Pont de Bir-Hakeim (the bridge) and Champs de Mars (the park in front of the Eiffel Tower).

Detect objects and label images
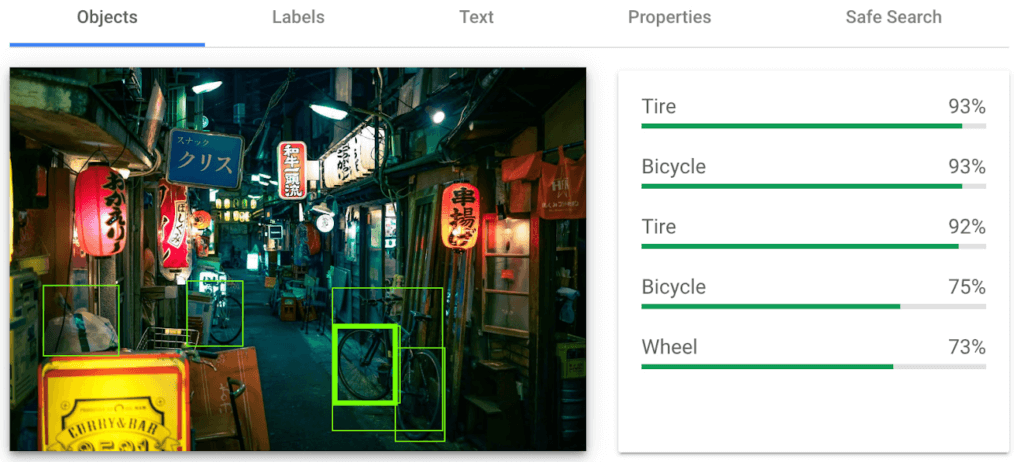
Object detection and labels are two related features that enable you to identify and classify objects within an image. Object detection detects and locates objects within an image, and provides information such as the position, size, and orientation of each object. Labels, on the other hand, provide a general classification of the content within an image.
Object detection has practical applications in many industries such as self-driving vehicles (where it’s critical), retail, manufacturing and more, while labels can be used to help classify and organize large collections of images, or to categorize and filter content.
You can see the similarities and differences in the responses provided by the object detection and labeling features in this image taken in Setagaya.

Detect text
Cloud Vision API detects and extracts text from any image, even if it’s handwritten or in different languages. Once it detects text, the API can provide information about the position, orientation, and size of each text element, as well as individual words, and their bounding boxes.
In this image of a traffic sign, Cloud Vision API has detected the text and provided it in the response.

Detect explicit content
Cloud Vision API can automatically identify and flag explicit or inappropriate content within an image using five categories: adult, spoof, medical, violence, and racy. The API provides a score that indicates the likelihood for each category in the image, which you can use to set thresholds in your application and decide how to handle those that exceed them. This feature is particularly useful for filtering or moderating user-generated content.
Luckily for the images I shared here, each category has been deemed “very unlikely” to be present. Phew!



Next Steps
These are just a few features of the Cloud Vision API and how it can help your business with automating image analysis workflows and gaining valuable insights from your visual data.
Head to the interactive walkthrough tutorials in Python, Node.js, Go, and Java to see step-by-step how to access the API and learn more about all the features that you can integrate into your own applications! Again, this tutorial can be completed at no cost within the Google Cloud Free Tier.
How Vertex Vizier’s Automated Hyperparameter Tuning Improves ML Models

5039
Of your peers have already read this article.
1:30 Minutes
The most insightful time you'll spend today!
We recently launched Vertex AI to help you move machine learning (ML) from experimentation into production faster and manage your models with confidence—speeding up your ability to improve outcomes at your organization.
But we know many of you are just getting started with ML and there’s a lot to learn! In tandem with building the Vertex AI platform, our teams are dropping as much best practices content as we can to help you come up to speed. Plus, we have a dedicated event on June 10th, Applied ML Summit, with sessions on how to apply ML technology in your projects, as well as grow your skills in this field.
In the meantime, we couldn’t resist a quick lesson on hyperparameter tuning, because (a) it’s incredibly cool (b) you will impress your coworkers (c) Google Cloud has some unique battle tested tech in this area and (d) you will save time by getting better ML models into production faster. Vertex Vizier, on average, finds optimal parameters for complex functions in over 80% fewer trials than traditional methods.
So it’s incredibly cool, but what is it?
While machine learning models automatically learn from data, they still require user-defined knobs which guide the learning process. These knobs, commonly known as hyperparameters, control, for example, the tradeoff between training accuracy and generalizability. Examples of hyperparameters are the optimizer being used, its learning rate, regularization parameters, the number of hidden layers in a DNN, and their sizes.
Setting hyperparameters to their optimal values for a given dataset can make a huge difference in model quality. Typically, optimal hyperparameter values are found via grid searching a small number of combinations, or tedious manual experimentation. Hyperparameter tuning automates this work for you by searching for the best configuration of hyperparameters for optimal model performance.
Vertex Vizier enables automated hyperparameter tuning in several ways:
- “Traditional” hyperparameter tuning: by this we mean finding the optimal value of hyperparameters by measuring a single objective metric which is the output of an ML model. For example, Vizier selects the number of hidden layers and their sizes, an optimizer and its learning rate, with the goal of maximizing model accuracy.
- When hyperparameters are evaluated, models are trained and evaluated on splits of the data set. If evaluation metrics are streamed to Vizier (e.g. as a function of epoch) as the model is trained, Vizier’s early stopping algorithms can predict the final objective value, and recommend which unpromising trials should be early stopped. This conserves compute resources and speeds up convergence.
- Oftentimes, models are tuned sequentially on different data sets. Vizier’s built in transfer learning learns priors from previous hyperparameter tuning studies, and leverages them to converge faster on subsequent hyperparameter tuning studies.
- AutoML is a variant of #1, where Vertex Vizier performs both model selection, and also tunes architectures/non-architecture modifying hyperparameters. AutoML usually requires more code on top of Vertex Vizier (to ingest data etc), but Vizier is in most cases the “engine” behind the process. AutoML is implemented by defining a tree like (DAG) search space, rather than a “flat” search space (like in #1). Note that you can use DAG search spaces for any other purpose where searching over a hierarchical space makes sense.
- There are times when you may wish to optimize more than one metric. For example, we would like to optimize model accuracy, while minimizing model latency. Vizier can find the Pareto frontier, which presents tradeoffs for multiple metrics, allowing users to choose the appropriate tradeoff. Simple example: I want to make a more accurate model, but would like to minimize serving latency. I do not know ahead of time what’s the tradeoff between the two metrics. Vizier can be used to explore and plot a tradeoff curve, so users can select on the most appropriate one. For example, “a latency decrease of 200ms will only decrease accuracy by 0.5%”
Google Vizier is all yours with Vertex AI
Google published the Vizier research paper in 2017, sharing our work and use cases for black-box optimization—i.e. The process of finding the best settings for a bunch of parameters or knobs when you can’t peer inside a system to see how well the knobs are working. The paper discusses our requirements, infrastructure design, underlying algorithms, and advanced features such as transfer learning that the service provides. Vizier has been essential to our progress with machine learning at Google, which is why we are so excited to make it available to you on Vertex AI.
Vizier has already tuned millions of ML models at Google, and its algorithms are continuously improved for faster convergence and handling of real-life edge cases. Vertex Vizier’s models are very well calibrated and are self-tuning (they adapt to user data), and offer unique power features, such as hierarchical search spaces and multi-objective optimization. We believe Vertex Vizier’s set of features is a unique capability to Google Cloud, and look forward to optimizing the quality of your models by automatically tuning hyperparameters for you.
To learn more about Vertex Vizier, check out these docs and if you are interested in what’s coming in machine learning over the next five years, tune in to our Applied ML Summit on June 10th, or watch the sessions on demand in your own time.
More Relevant Stories for Your Company

Notebook Executor Feature of Vertex AI Workbench to Schedule Notebooks Ad Hoc or on Recurring Basis
When solving a new ML problem, it’s common to start by experimenting with a subset of your data in a notebook environment. But if you want to execute a long-running job, add accelerators, or run multiple training trials with different input parameters, you’ll likely find yourself copying code over to


Supercharge Marketing with Ready-Made, Centralized Smart Analytics
Your company has lots of valuable marketing data, but it’s spread across many systems and teams. That's a problem. In fact, only 13% of organisations feel like they're making the most out of their available customer data today. And the reason is that data--marketing and customer data--is spread across many

A CIO’s Guide to Data Analytics and Machine Learning
Breakthroughs in artificial intelligence (AI) have captured the imaginations of business and technical leaders alike. The AI techniques underlying these breakthroughs are finding diverse application across every industry. Early adopters are seeing results, particularly encouraging is that AI is starting to transform processes in established industries, from retail to financial

Predict Protein Structures with AlphaFold on Vertex AI
Today, to accelerate research in the bio-pharma space, from the creation of treatments for diseases to the production of new synthetic biomaterials, we are announcing a new Vertex AI solution that demonstrates how to use Vertex AI Pipelines to run DeepMind’s AlphaFold protein structure predictions at scale. Once a protein’s
