





Leverage ML to Spot Anomalies in Real-time Forex Data

3105
Of your peers have already read this article.
6:00 Minutes
The most insightful time you'll spend today!
Let’s say you are a quantitative trader with access to real-time foreign exchange (forex) price data from your favorite market data provider. Perhaps you have a data partner subscription, or you’re using a synthetic data generator to prove value first. You know there must be thousands of other quants out there with your same goal. How will you differentiate your anomaly detector?
What if, instead of training an anomaly detector on raw forex price data, you detected anomalies in an indicator that already provides generally agreed buy and sell signals? Relative Strength Index (RSI) is one such indicator; it is often said that RSI going above 70 is a sell signal, and RSI going below 30 is a buy signal. As this is just a simplified rule, it means there could be times when the signal is inaccurate, such as a currency market correction, making it a prime opportunity for an anomaly detector.
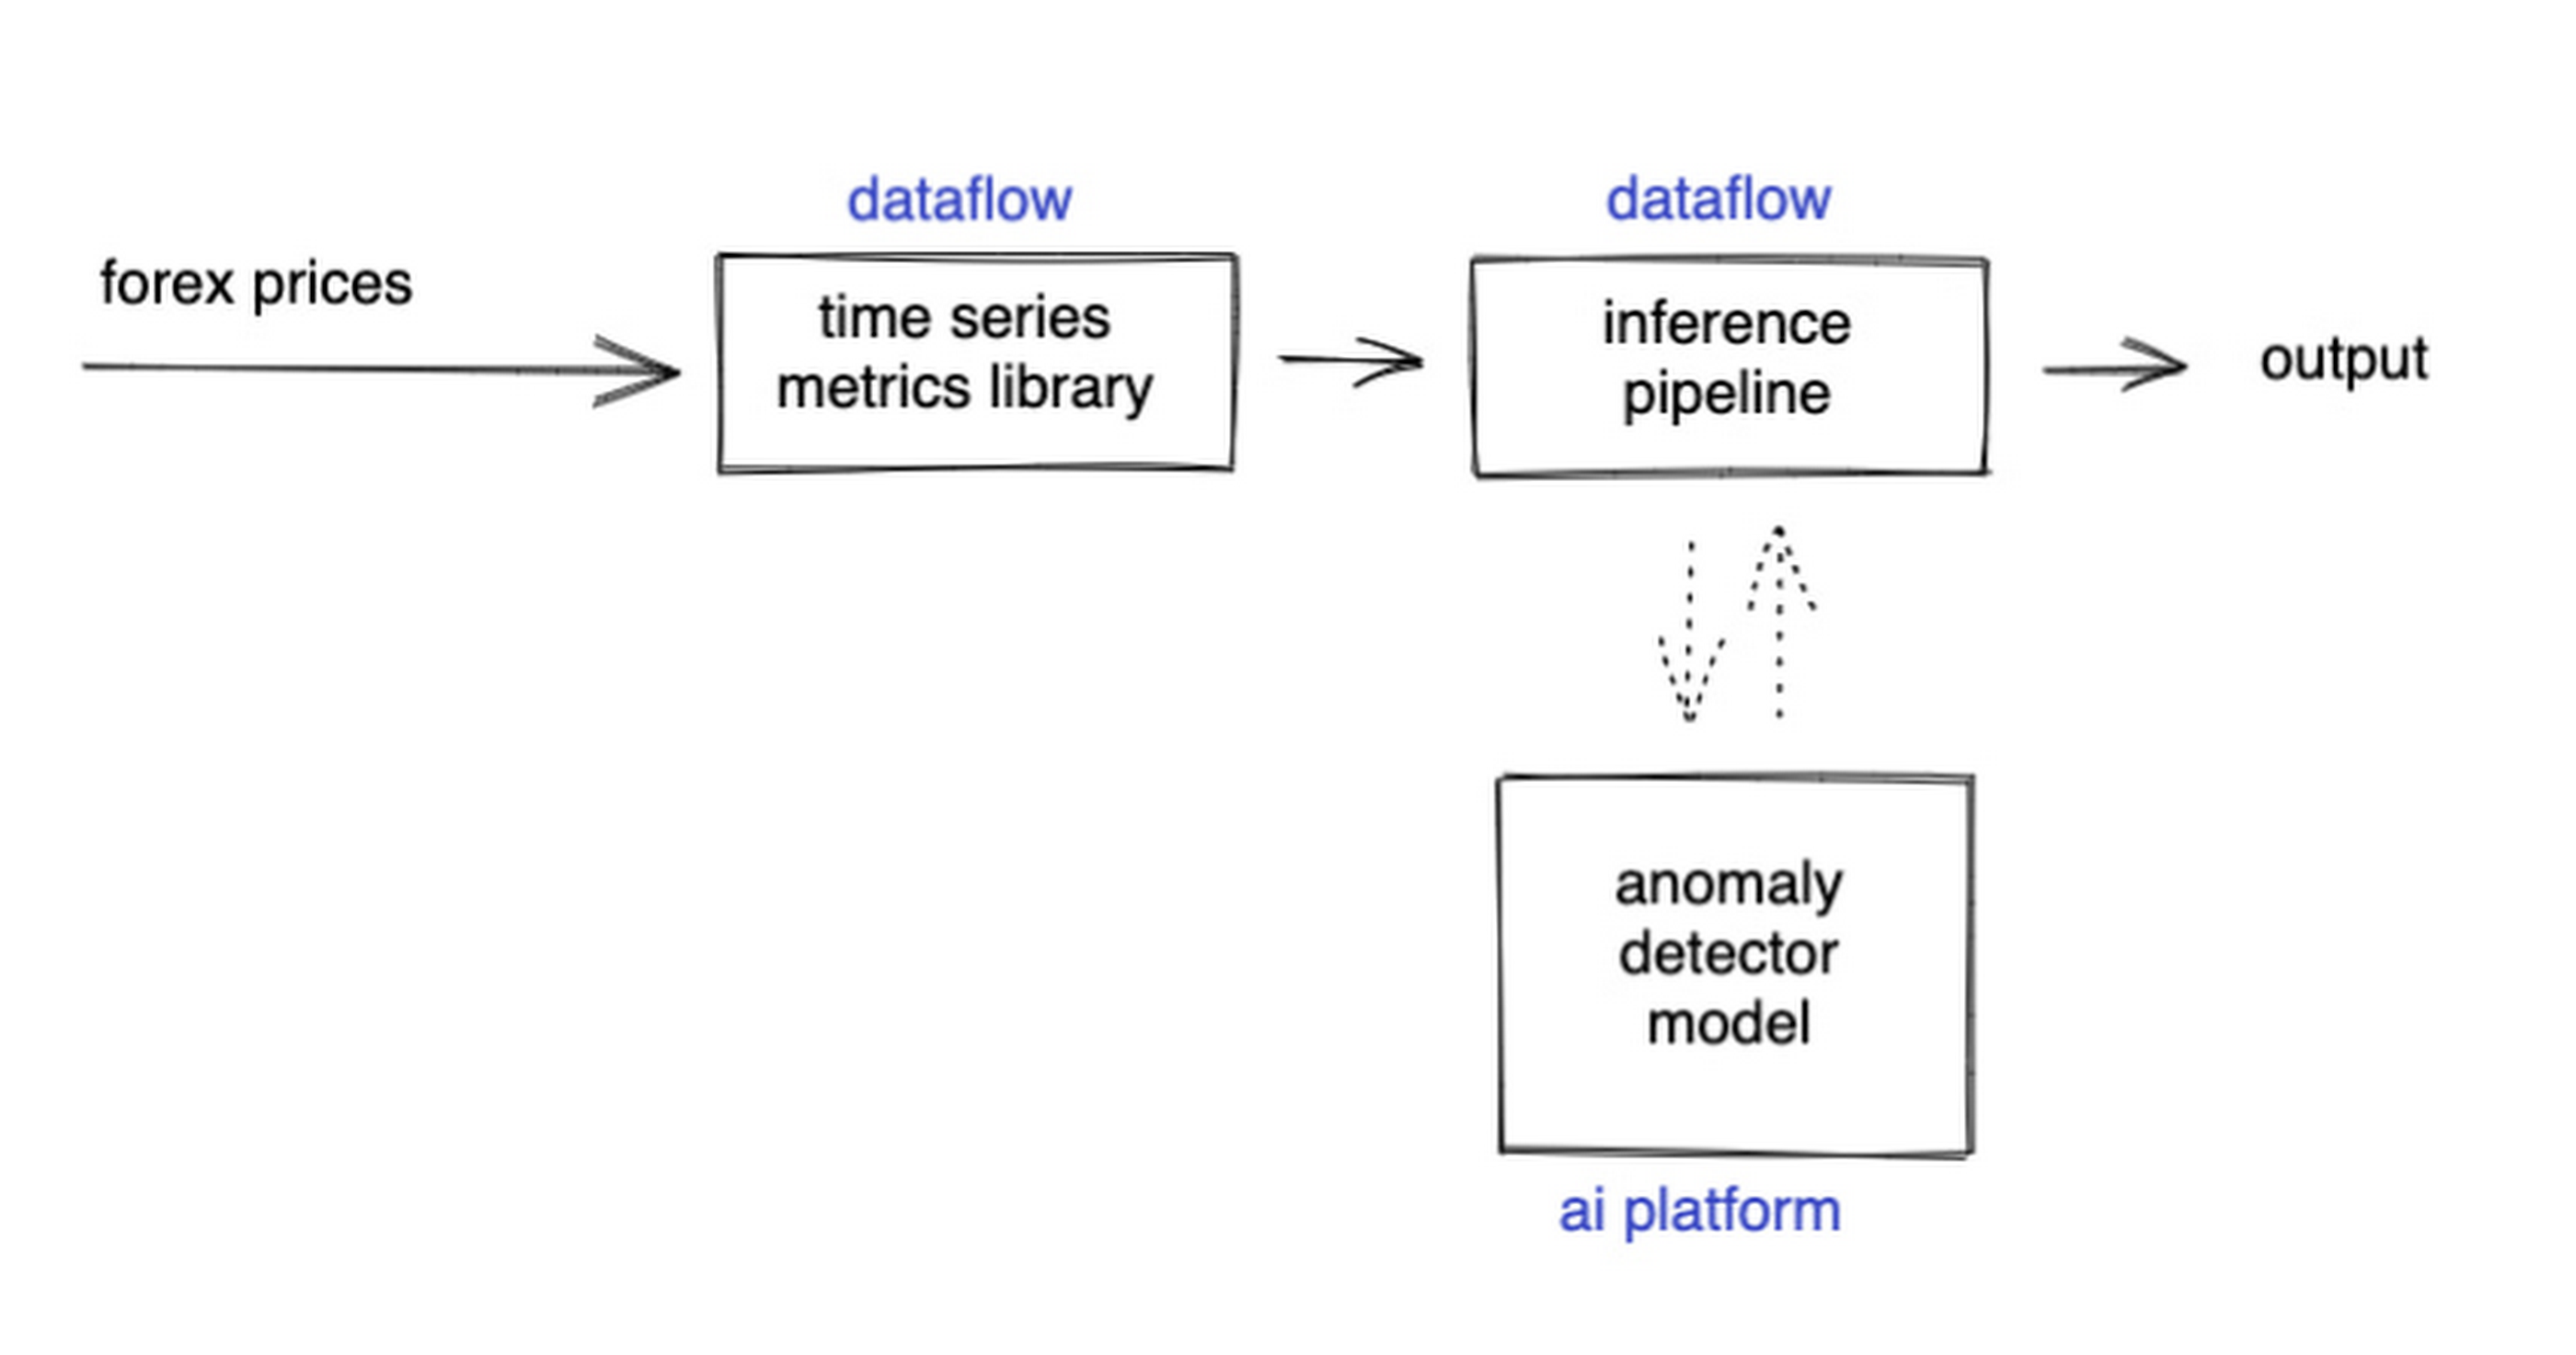
This gives us the following high level components:

Of course, we want each of these components to handle data in real time, and scale elastically as needed. Dataflow pipelines and Pub/Sub are the perfect services for this. All we need to do is write our components on top of the Apache Beam sdk, and they’ll have the benefit of distributed, resilient and scalable compute.
Luckily for us, there are some great existing Google plugins for Apache Beam. Namely, a Dataflow time-series sample library that includes RSI calculations, and a lot of other useful time series metrics; and a connector for using AI Platform or Vertex AI inference within a Dataflow pipeline. Let’s update our diagram to match, where the solid arrows represent Pub/Sub topics.
The Dataflow time-series sample library also provides us with gap-filling capabilities, which means we can rely on having contiguous data once the flow reaches our machine learning (ML) model. This lets us implement quite complex ML models, and means we have one less edge case to worry about.
So far we’ve only talked about the real time data flow, but for visualization and continuous retraining of our ML model, we’re going to want historical data as well. Let’s use BigQuery as our data warehouse, and Dataflow to plumb Pub/Sub into it. As this plumbing job is embarrassingly parallelizable, we wrote our pipeline to be generic across data types and share the same Dataflow job, such that compute resources can be shared. This results in efficiencies of scale both in cost savings and time required to scale-up.

Data Modeling
Let’s discuss data formats a bit further here. An important aspect of running any data engineering project at scale is flexibility, interoperability and ease of debugging. As such, we opted to use flat JSON structures for each of our data types, because they are human readable and ubiquitously understood by tooling. As BigQuery understands them too, it’s easy to jump into the BigQuery console and confirm each component of the project is working as expected.
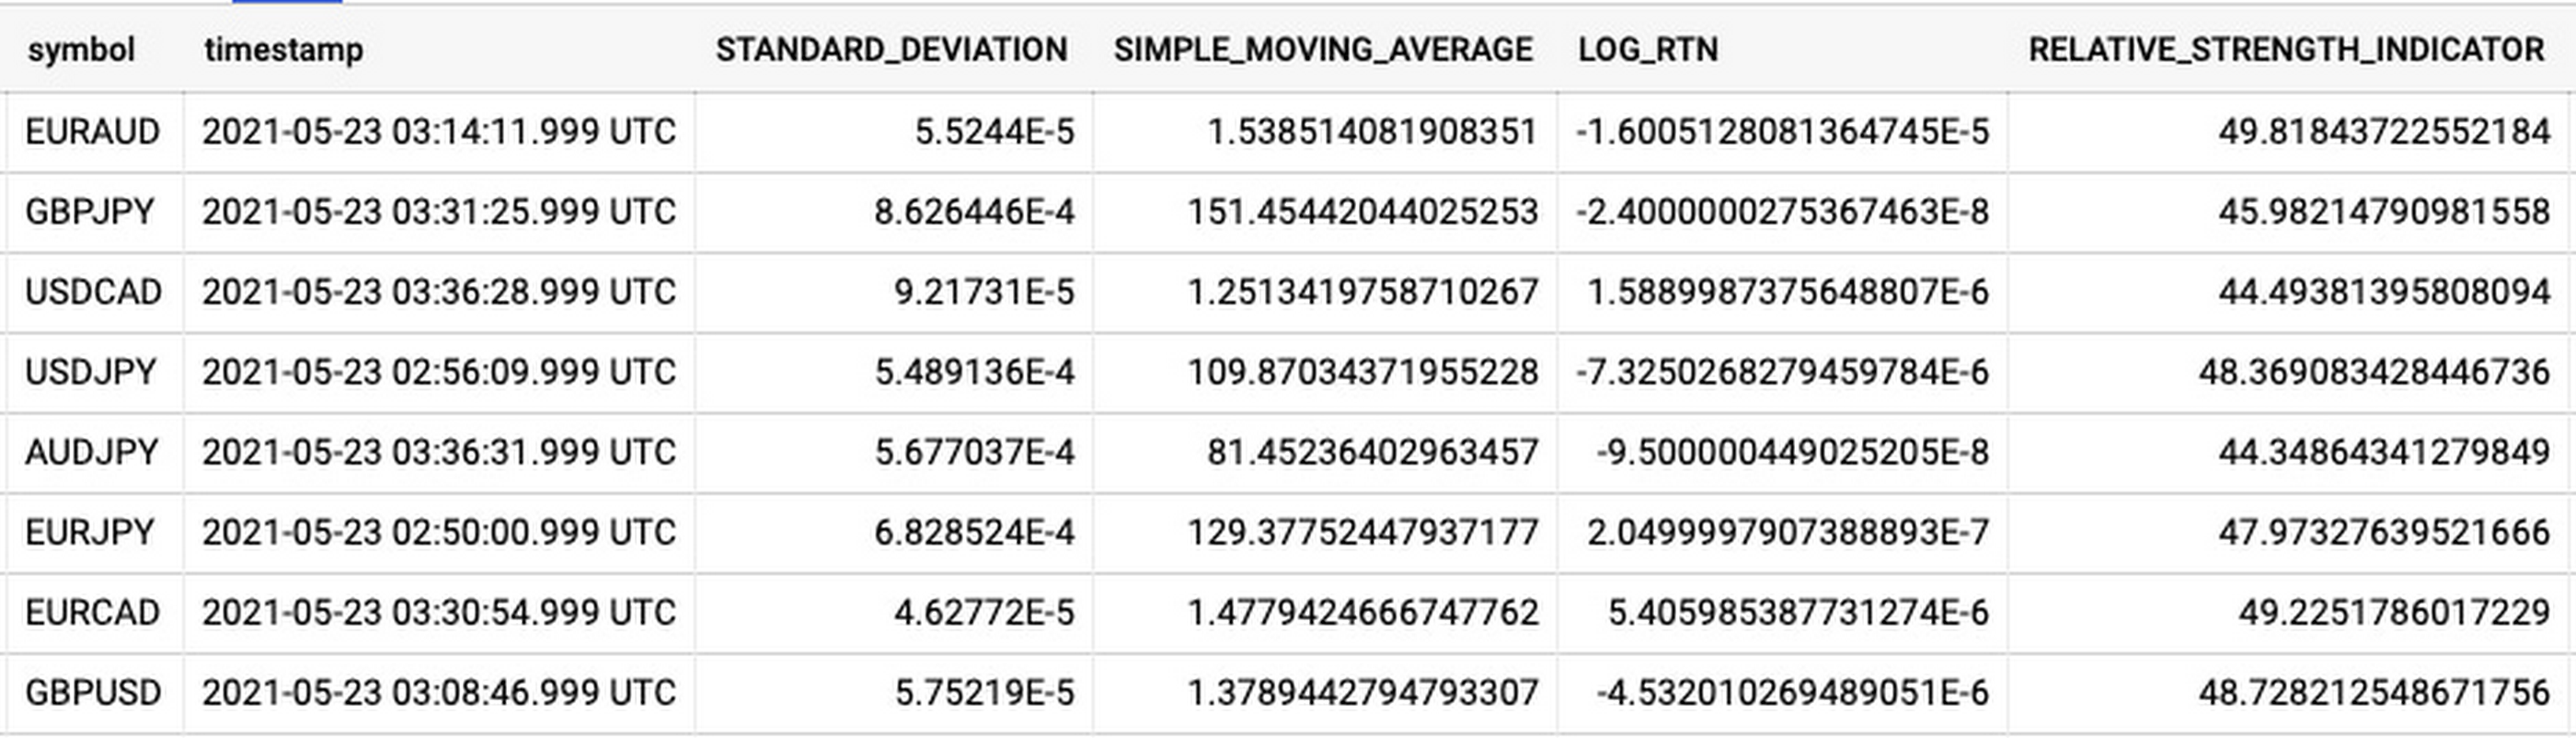
As you can see, the Dataflow sample library is able to generate many more metrics than RSI. It supports generating two types of metrics across time series windows, metrics which can be calculated on unordered windows, and metrics which require ordered windows, which the library refers to as Type 1 metrics and Type 2 metrics, respectively. Unordered metrics have a many-to-one relationship, which can help reduce the size of your data by reducing the frequency of points through time. Ordered metrics run on the outputs of the unordered metrics, and help to spread information through the time domain without loss in resolution. Be sure to check out the Dataflow sample library documentation for a comprehensive list of metrics supported out of the box.
As our output is going to be interpreted by our human quant, let’s use the unordered metrics to reduce the time resolution of our flow of real time data to one per second, or one hertz. If our output was being passed into an automated trading algorithm, we might choose a higher frequency. The decision for the size of our ordered metrics window is a little more difficult, but broadly determines the amount of time-steps our ML model will have for context, and therefore the window of time for which our anomaly detection will be relevant. We at least need it to be larger than our end-to-end latency, to ensure our quant will have time to act. Let’s set it to five minutes.
Data Visualization
Before we dive into our ML model, let’s work on visualization to give us a more intuitive feel for what’s happening with the metrics, and confirm everything we’ve got so far is working. We use the Grafana helm chart with the BigQuery plugin on a Google Kubernetes Engine (GKE) Autopilot cluster. The visualisation setup is entirely config-driven and provides out-of-the-box scaling, and GKE gives us a place to host some other components later on.
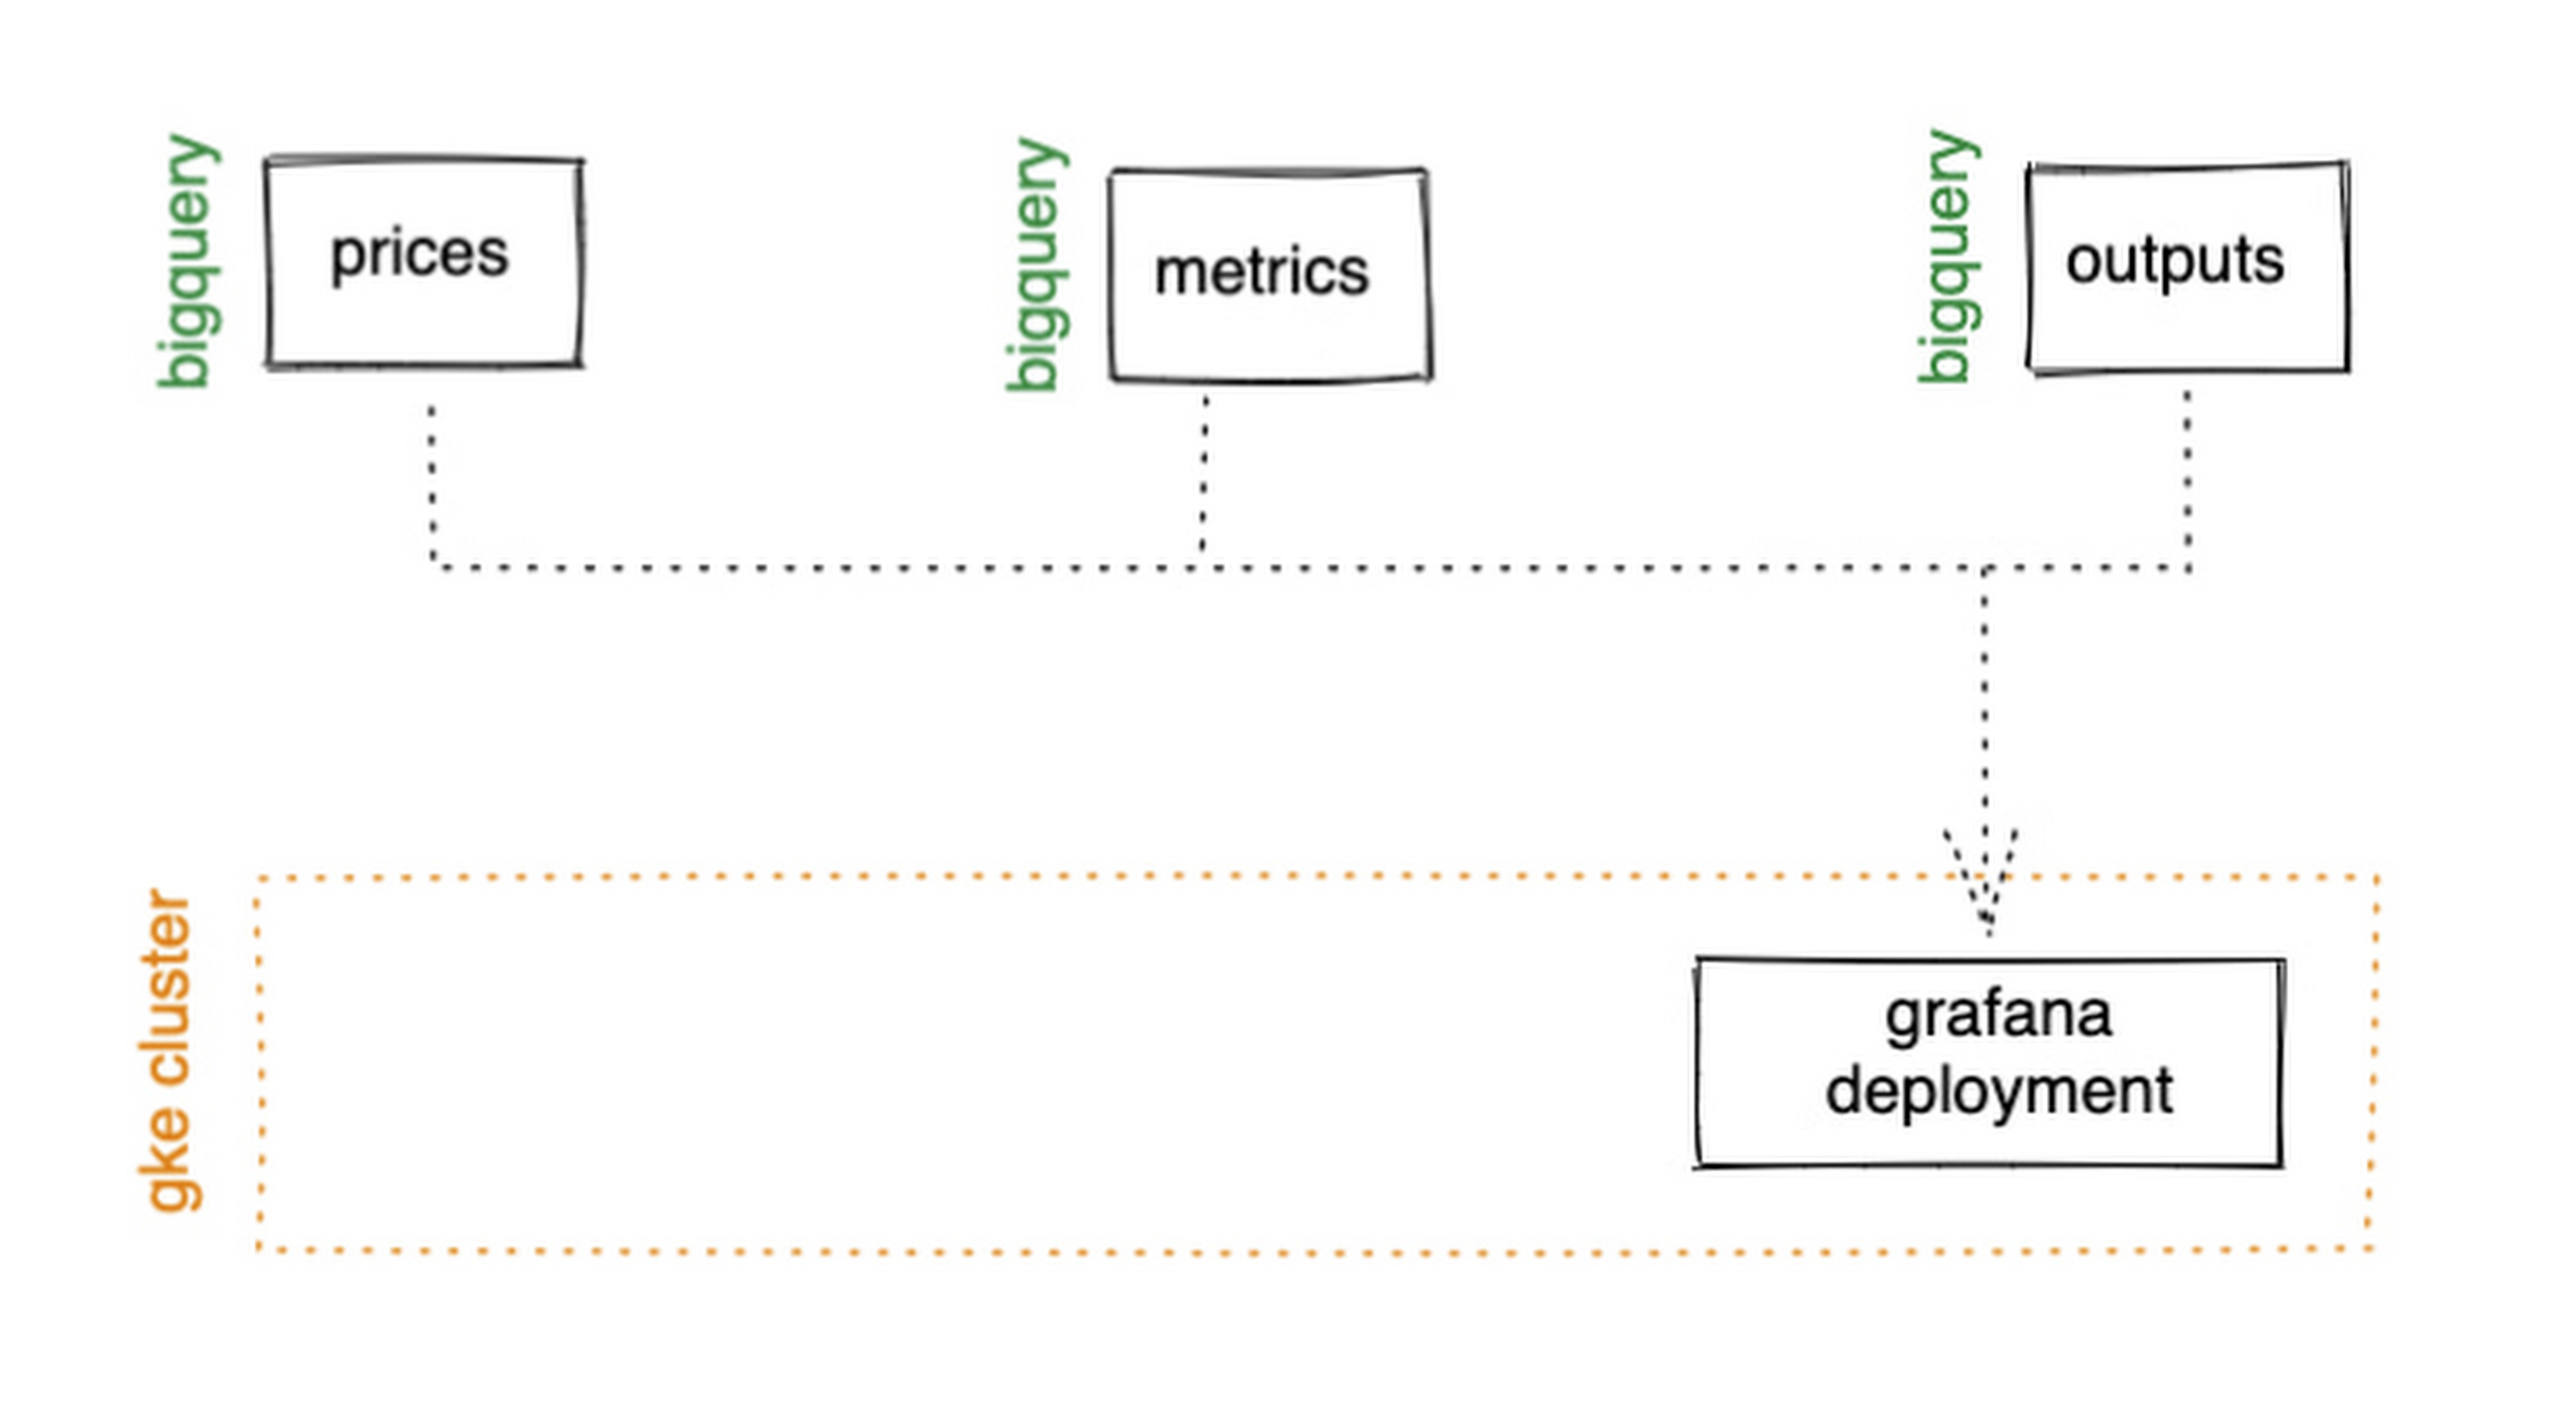
GKE Autopilot has Workload Identity enabled by default, which means we don’t need to worry about passing around secrets for BigQuery access, and can instead just create a GCP service account that has read access to BigQuery and assign it to our deployment through the linked Kubernetes service account.
That’s it! We can now create some panels in a Grafana dashboard and see the gap filling and metrics working in real time.

Building and deploying the Machine Learning Model
Ok, ML time. As we alluded to earlier, we want to continuously retrain our ML model as new data becomes available, to ensure it remains up to date with the current trend of the market. TensorFlow Extended (TFX) is a platform for creating end-to-end machine learning pipelines in production, and eases the process around building a reusable training pipeline. It also has extensions for publishing to AI Platform or Vertex AI, and it can use Dataflow runners, which makes it a good fit for our architecture. The TFX pipeline still needs an orchestrator, so we can host that in a Kubernetes job, and if we wrap it in a scheduled job, then our retraining happens on a schedule too!

TFX requires our data be in the tf.Example format. The Dataflow sample library can output tf.Examples directly, but this tightly couples our two pipelines together. If we want to be able to run multiple ML models in parallel, or train new models on existing historical data, we need our pipelines to only be loosely coupled. Another option is to use the default TFX BigQuery adaptor, but this restricts us to each row in BigQuery mapping to exactly one ML sample, meaning we can’t use recurrent networks.
As neither of the out-of-the-box solutions met our requirements, we decided to write a custom TFX component that did what we needed. Our custom TFX BigQuery adaptor enables us to keep our standard JSON data format in BigQuery and train recurrent networks, and it keeps our pipelines loosely coupled! We need the windowing logic to be the same for both training and inference time, so we built our custom TFX component using standard Beam components, such that the same code can be imported in both pipelines.
def window_elements(pipeline: beam.Pipeline,window_length: int,drop_irregular_windows: bool = True,sort_windows_by: str = "timestamp",):"""Window elements into regular windows of a given size.Assumes elements flow at a fixed rate of 1Hz."""def _sort_windows(window: Iterable[Dict[Text, Any]]) -> List[Dict[Text, Any]]:sorted_window = sorted(window, key=lambda e: e[sort_windows_by])return sorted_windowwindowed_elements = (pipeline| "AddConstantKey" >> beam.Map(lambda item: (0, item))| "WithSlidingWindow">> beam.WindowInto(beam.transforms.window.SlidingWindows(window_length, 1),trigger=beam.transforms.trigger.AfterCount(window_length),accumulation_mode=beam.transforms.trigger.AccumulationMode.DISCARDING,)| "CombineWindow" >> beam.GroupByKey()| "GetValues" >> beam.Values())if drop_irregular_windows:windowed_elements = windowed_elements | "EnforceWindowLengths" >> beam.Filter(lambda w: len(w) == window_length).with_output_types(List[Dict[Text, Any]])if sort_windows_by is not None:windowed_elements = windowed_elements | "Sort" >> beam.Map(_sort_windows).with_output_types(List[Dict[Text, Any]])return windowed_elements
With our custom generator done, we can start designing our anomaly detection model. An autoencoder utilising long-short-term-memory (LSTM) is a good fit for our time-series use case. The autoencoder will try to reconstruct the sample input data, and we can then measure how close it gets. That difference is known as the reconstruction error. If there is a large enough error, we call that sample an anomaly. To learn more about autoencoders, please consider reading chapter 14 from Deep Learning by Ian Goodfellow, Yoshua Bengio, and Aaron Courville.
Our model uses simple moving average, exponential moving average, standard deviation, and log returns as input and output features. For both the encoder and decoder subnetworks, we have 2 layers of 30 time step LSTMs, with 32 and 16 neurons, respectively.
In our training pipeline, we include z score scaling as a preprocessing transformer – which is usually a good idea when it comes to ML. However, there’s a nuance to using an autoencoder for anomaly detection. We need not only the output of the model, but also the input, in order to calculate the reconstruction error. We’re able to do this by using model serving functions to ensure our model returns both the output and preprocessed input as part of its response. As TFX has out-of-the-box support for pushing trained models to AI Platform, all we need to do is configure the pusher, and our (re)training component is complete.
Detecting Anomalies in real time
Now that we have our model in Google Cloud AI Platform, we need our inference pipeline to call to it in real time. As our data is using standard JSON, we can easily apply our RSI rule of thumb inline, ensuring our model only runs when needed. Using the reconstructed output from AI Platform, we are then able to calculate the reconstruction error. We choose to stream this directly into Pub/Sub to enable us to dynamically apply an anomaly threshold when visualising, but if you had a static threshold you could apply it here too.
with beam.Pipeline(options=pipeline_options) as pipeline:(pipeline| "ReadFromPubSub">> beam.io.ReadFromPubSub(topic=input_metrics,timestamp_attribute=timestamp_key,)| "DeserialiseJSON" >> beam.Map(pubsub_serialiser.to_json)| "FilterSymbol" >> beam.Filter(lambda m: m["symbol"] == symbol)| "FilterRSIThreshold">> beam.Filter(lambda m: m["RELATIVE_STRENGTH_INDICATOR"] > rsi_upper_thresholdor m["RELATIVE_STRENGTH_INDICATOR"] < rsi_lower_threshold)| "WindowElements" >> window_elements(window_length)| "RunAutoencoder">> run_windowed_inference(gcp_project_id,model_name,window_length,{f: "FLOAT" for f in feature_metrics},)| "CalcReconError" >> beam.Map(calc_reconstruction_err)| "ToJSON">> beam.Map(lambda re: {"symbol": symbol, "reconstruction_error": re})| "SerialiseJSON" >> beam.Map(pubsub_serialiser.from_json)| "WriteToPubSub">> beam.io.WriteToPubSub(topic=output_alerts,timestamp_attribute=timestamp_key,))
Summary
Here’s what the wider architecture looks like now:

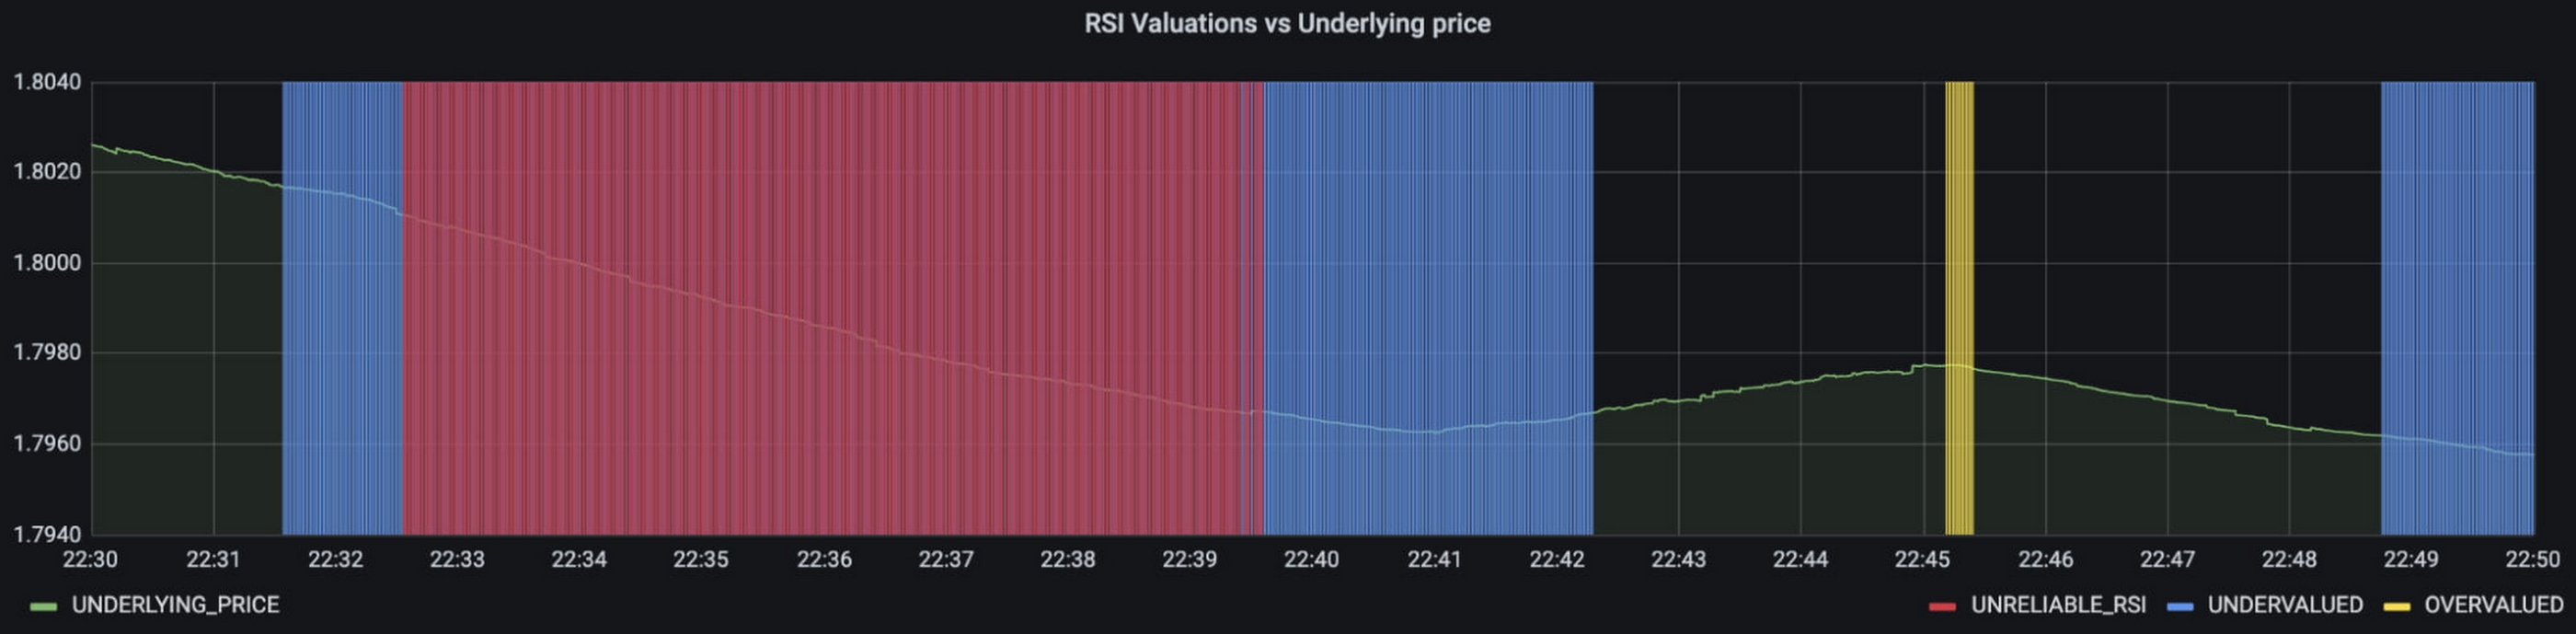
More importantly though, does it fit for our use case? We can plot the reconstruction error of our anomaly detector against the standard RSI buy/sell signal, and see when our model is telling us that perhaps we shouldn’t blindly trust our rule of thumb. Go get ‘em, quant!
In terms of next steps, there are many things you could do to extend or adapt what we’ve covered. You might want to explore with multi-currency models, where you could detect when the price action of correlated currencies is unexpected, or you could connect all of the Pub/Sub topics to a visualization tool to provide a real-time dashboard.
Give it a try
To finish it all off, and to enable you to clone the repo and set everything up in your own environment, we include a data synthesizer to generate forex data without needing access to a real exchange. As you might have guessed, we host this on our GKE cluster as well. There are a lot of other moving parts – TFX uses a SQL database and all of the application code is packaged into a docker image and deployed along with the infra using Terraform and cloud build. But if you’re interested in those nitty gritty details, head over to the repo and get cloning!
Feel free to reach out to our teams at Google Cloud and Kasna for help in making this pattern work best for your company.
Revolutionizing Cloud Computing: Introducing G2 VMs with NVIDIA L4 GPUs

1563
Of your peers have already read this article.
2:30 Minutes
The most insightful time you'll spend today!
Organizations across industries are looking to AI to turn troves of data into intelligence, powered by the latest advances in generative AI. Yet for many organizations, there is a barrier to adopting the latest models because they can be costly to train or serve. A new class of cloud GPUs is needed to lower the cost of entry for businesses that want to tap the power of AI.
Today, we’re introducing G2, the newest addition to the Compute Engine GPU family in Google Cloud. G2 is the industry’s first cloud VM powered by the newly announced NVIDIA L4 Tensor Core GPU, and is purpose-built for large inference AI workloads like generative AI. G2 delivers cutting-edge performance-per-dollar for AI inference workloads that run on GPUs in the cloud. By switching from NVIDIA A10G GPUs to G2 instances with L4 GPUs, organizations can lower their production infrastructure costs up to 40%. We also found that customers switching from NVIDIA T4 GPUs to L4 GPUs can achieve 2x-4x better performance. As a universal GPU offering, G2 instances also help accelerate other workloads, offering significant performance improvements on HPC, graphics, and video transcoding. Currently in private preview, G2 VMs are both powerful and flexible, and scale easily from one up to eight GPUs.
Currently organizations require end-to-end enterprise ready infrastructure that will future proof their AI and HPC initiatives for a new era. G2s will be ready to be deployed on Vertex AI, GKE, and GCE, giving customers the freedom to architect their own custom software stack to meet their performance requirements and budget. With optimized Vertex AI support for G2 VMs, AI users can tap the latest generative AI models and technologies. With an easy to use UI and automated workflows, customers can access, tune and serve modern models for video, text, images, and audio without the toil of manual optimizations. The combination of these services with the power of G2 will help customers harness the power of complex machine models for their business.
NVIDIA L4 GPUs with Ada Lovelace Architecture
G2 machine families enable machine learning customers to run their production infrastructure in the cloud for a variety of applications such as language models, image classification, object detection, automated speech recognition, and language translation. Built on the Ada Lovelace architecture with fourth-generation Tensor Cores, the NVIDIA L4 GPU provides up to 30 TFLOPS of performance for FP32, and 242 TFLOPs for FP16. Newly added FP8 support, on top of existing INT8, BFLOAT16 and TF32 capabilities, makes the L4 ideal for ML inference.
With the latest third-generation RT Cores and DLSS 3.0 technology, G2 instances are also great for graphics-intensive workloads such as rendering and remote workstations when paired with NVIDIA RTX Virtual Workstation. NVIDIA L4 provides 3x video encoding and decoding performance, and adds new AV1 hardware-encoding capabilities. For example, G2 can enable gaming customers running game engines such as Unreal and Unity with modern graphics cards to run real-time applications. Likewise, media and entertainment customers that need GPU-enabled virtual workstations can use the L4 to create photo-realistic, high-resolution 3D content for movies, games, and AR/VR experiences using applications such as Autodesk Maya or 3D Studio Max.
What customers are saying
A handful of early customers have been testing G2 and have seen great results in real-world applications. Here are what some of them have to say about the benefits that G2 with NVIDIA L4 GPUs bring:

AppLovin
AppLovin enables developers and marketers to grow with market leading technologies. Businesses rely on AppLovin to solve their mission-critical functions with a powerful, full stack solution including user acquisition, retention, monetization and measurement.
“AppLovin serves billions of AI powered recommendations per day, so scalability and value are essential to our business,” said Omer Hasan, Vice President, Operations at AppLovin. “With Google Cloud’s G2 we’re seeing that NVIDIA L4 GPUs offer a significant increase in the scalability of our business, giving us the power to grow faster than ever before.”

WOMBO
WOMBO aims to unleash everyone’s creativity through the magic of AI, transforming the way content is created, consumed, and distributed.
“WOMBO relies upon the latest AI technology for people to create immersive digital artwork from users’ prompts, letting them create high-quality, realistic art in any style with just an idea,” said Ben-Zion Benkhin, Co-Founder and CEO of WOMBO. “Google Cloud’s G2 instances powered by NVIDIA’s L4 GPUs will enable us to offer a better, more efficient image-generation experience for users seeking to create and share unique artwork.”

Descript
Descript’s AI-powered features and intuitive interface fuel YouTube and TikTok channels, top podcasts, and businesses using video for marketing, sales, and internal training and collaboration. Descript aims to make video a staple of every communicator’s toolkit, alongside docs and slides.
“G2 with L4’s AI Video capabilities allow us to deploy new features augmented by natural-language processing and generative AI to create studio-quality media with excellent performance and energy efficiency” said Kundan Kumar, Head of Artificial Intelligence at Descript.

Workspot
Workspot believes that the software-as-a-service (SaaS) model is the most secure, accessible and cost-effective way to deliver an enterprise desktop and should be central to accelerating the digital transformation of the modern enterprise.
“The Workspot team looks forward to continuing to evolve our partnership with Google Cloud and NVIDIA. Our customers have been seeing incredible performance leveraging NVIDIA’s T4 GPUs. The new G2 instances with L4 GPUS through Workspot’s remote Cloud PC workstations provide 2x and higher frame rates at 1280×711 and higher resolutions” said Jimmy Chang, Chief Product Officer at Workspot.
Pricing and availability
G2 instances are currently in private preview in the following regions: us-central1, asia-southeast1 and europe-west4. Submit your request here to join the private preview, or to receive a notification as when the public preview begins. Support will be coming to Google Kubernetes Engine (GKE), Vertex AI, and other Google Cloud services as well. We’ll share G2 public availability and pricing information later in the year.
Data-first Digitization Helps Leverage the Cloud for Your Mainframe Assets

6469
Of your peers have already read this article.
2:00 Minutes
The most insightful time you'll spend today!
For many enterprises, the venerable mainframe is home to decades’ worth of data about the company’s customers, processes and operations. And it goes without saying that the business would like access to that mainframe data — to report on it, to analyze it with big data analysis tools, or to use it as the basis of new machine learning and artificial intelligence initiatives.
At Google Cloud, we are eager to work with organizations to help them transform their mainframe assets for the cloud era. Of course, we can help them modernize their mainframe applications by migrating them to the cloud. At the same time, working with partners and customers, we’ve developed another, more lightweight approach that can help them start to leverage the cloud for their mainframe assets much more quickly than performing a full-fledged migration. We call this approach data-first digitization.
In this rapidly evolving digital ecosystem, it’s imperative to understand the difference between ‘modernization’ and ‘digitization.’ With modernization you start with the current state and look forward, and rely on mainframe application migration approaches such as rehosting (emulation), refactoring (automated code transformation), reengineering — or simply replacing a custom application with a commercial package. With digitization, you start with the future state that you want to achieve, and work back to what is required to get there.
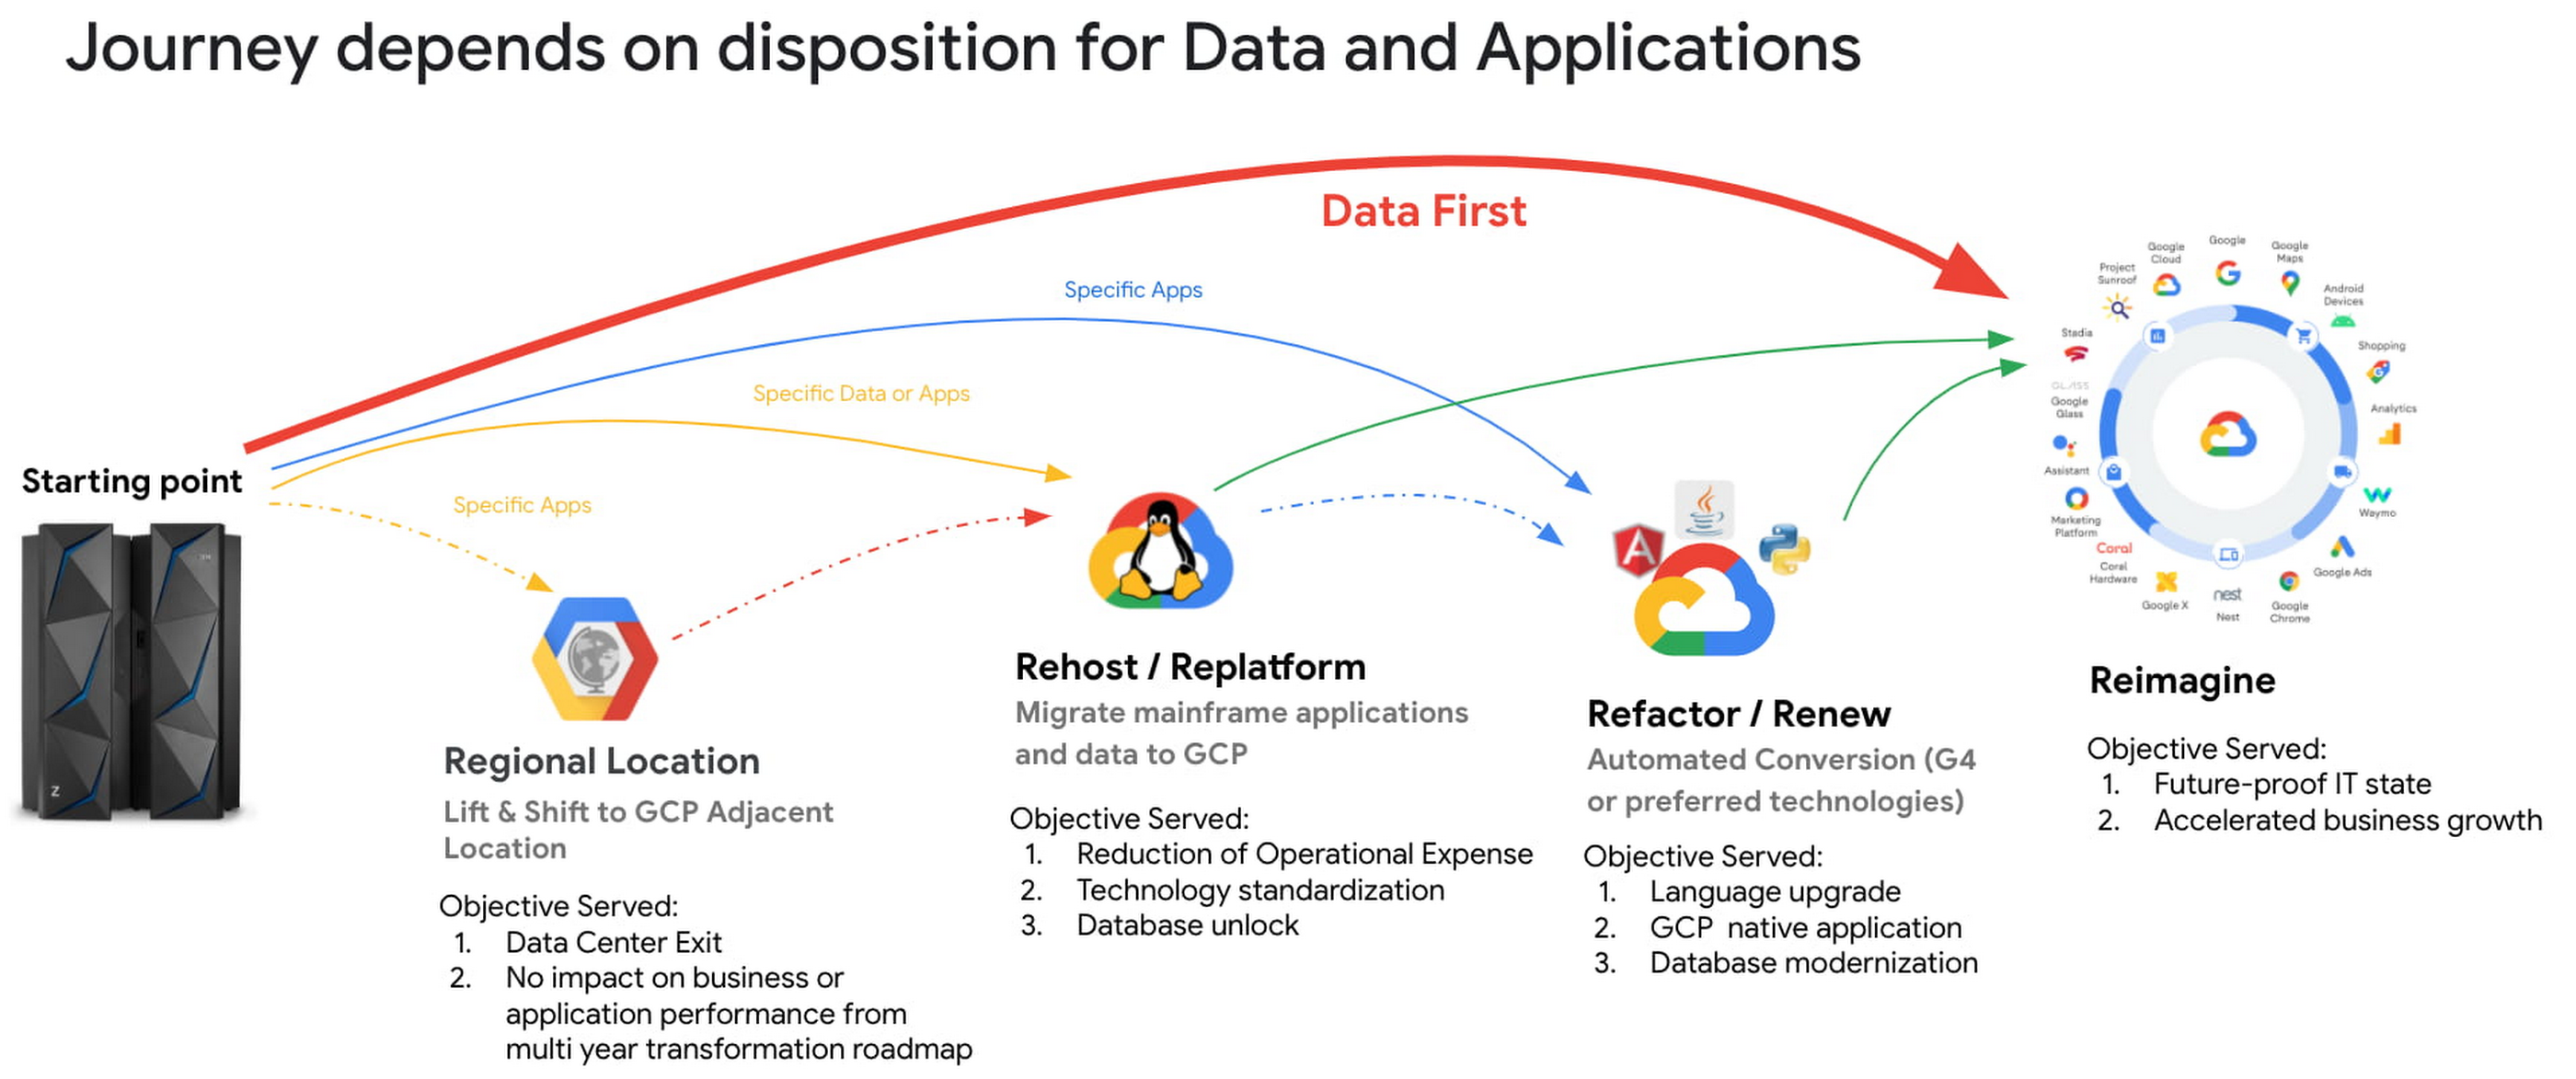
This data-first digitization approach includes a mainframe data-first integration framework comprising in-house and partner products and tools to migrate heterogeneous data sources from the mainframe to Google Cloud Storage. Once mainframe data has been copied to Cloud Storage, it can then be integrated and leveraged by Google Cloud tools such as BigQuery, AI and machine learning prodcuts and Smart and Stream analytics platforms. The integration framework covers both bulk batch data transfers and real-time data replication (change data capture).

Data-first digitization is based on the tenet that ‘applications are transient, data is permanent.’ By bringing data first to Google Cloud instead of traditional ways of modernizing applications (for example, with Gartner’s 7 options to Modernize), this allows organizations to leapfrog to new business models, use cases and innovative ways to serve end customers. For example:
- Making decisions with smart and stream analytics platforms and AI/ML engines. These tools need data to make decisions. Google is a pioneer in extracting information and value from the raw structured and unstructured data, and this approach opens up mainframe data for use by BigQuery and AI/ML models.
- Building new reporting applications. With access to mainframe data, you can use Google cloud products like Looker and Appsheet to build net-new reporting applications, expediting the process of retiring mainframe reporting applications, and accelerating your overall transformation.
In our experience, taking a data-first digitization approach to your mainframe offers a number of benefits:
- Faster time-to-business: Because data-first modernization is built on existing products, the implementation cycle is much shorter.
- Less capital investment: You spend your time integrating products, not developing applications.
- Minimized risk: Data-first integrates with existing, proven and reliable Google Cloud products.
- Faster overall mainframe transformation: When you shift your modernization center of gravity from the application to the data, you look at mainframe applications from a business perspective instead of just “keeping the lights on.” As a result, only the most business-critical applications are modernized and many support applications can be decommissioned, accelerating your transformation journey.
Taking a data-first approach to digitization is still relatively new, but we’re heartened by customers’ early successes. Watch this space for additional insights, reference architectures and technical white papers around data-first. And if you think this approach may be right for you, reach out to mainframe@google.com.
Learn more:
Case Study: Twitter is Taking Their CX to The Next Level with AutoML

2779
Of your peers have already read this article.
2:00 Minutes
The most insightful time you'll spend today!
Editor’s note: Since launching its Spaces feature, Twitter has demonstrated that hearing people’s voices can bring conversations on Twitter to life in a completely new way. Next, it aimed to make it easier for customers to join and listen to live conversations they personally care about. In this blog, we learn how the Twitter Spaces Engineering team is bringing this vision to life with AutoML, powering a new ML heuristic which serves personalized recommendations to Twitter customers. The authors would like to thank Chuan Lu, Joe Balistreri, Chen-Rui Chou, Pablo Jablonski, Alberto Parrella, Pradip Thachile and Sam Lee from Twitter, as well as Helin Wang from Google, for contributions to this blog.
Since Twitter introduced Spaces in 2020 to enable live audio conversations on its platform, the Twitter Spaces Engineering team has been continually testing, building, and updating this feature in the open. Today, anyone can join, listen, and speak in a Space on Twitter, and the feature’s popularity has taken off. But this success also poses a challenge: with millions of people creating and joining Spaces at any time, how can they find the Spaces to engage with while they’re happening? Taking this as an opportunity to further improve the experience of its customers, Twitter has turned to machine learning (ML) and cloud technology for answers.
“ML fits into the natural progression of Twitter consumer and revenue product building, especially for a product feature such as Spaces,” explains Diem Nguyen, Senior Machine Learning Engineer and Data Scientist at Twitter. “We launched Spaces with a base-line algorithm using the ‘most popular’ heuristic which assumes that if a Space is popular, there’s a good chance you’d like it too. But our aim is to leverage ML to surface the most interesting and relevant Spaces to a particular Twitter customer, making it easier for them to find and join the conversations they personally care about. This is a complex functionality that Google Cloud ML capabilities help us to enable.”
Setting the stage for building new features with limited ML resources
While looking for the right tools to power this vision, Nguyen and her team started evaluating in December 2021 whether the Vertex AI platform and AutoML in particular could solve challenges observed when they first started building Spaces. These included a lack of dedicated ML resources to build and deploy the product feature, and the need to work on a multi-cloud environment.
“We had three key questions in mind during our assessment,” Nguyen explains. “Can we realistically deploy the AutoML model off-platform? Once deployed, can it solve for the request load that we get from the service we’re serving (in this case, the Spaces tab)? And finally, can we develop and maintain such a solution without a dedicated team of ML experts for this project?” The answer to all three questions was yes.
Positive answers motivated the Spaces Engineering team to take the solution to production in February 2022. “We started using AutoML Tables to train high-accuracy models with minimal ML expertise or effort, alleviating our resource constraint,” says Nguyen of the results. “Soon AutoML also stood out for its high performance and for supporting easy deployment beyond the Google Cloud Platform, making it ideal for this project hosted in a multi-cloud environment.”
Increasing customer engagement at speed with accurate ML predictions
With a classification model in place to predict the probability of user engagement in a particular Space, Twitter now aims to optimize its model with aggregated data around Twitter features that can help it better understand customer preferences. For example, if a customer has historically engaged with a particular topic and a new Space matches that topic, the ML model increases the score of that Space being served to that user on the Spaces tab.
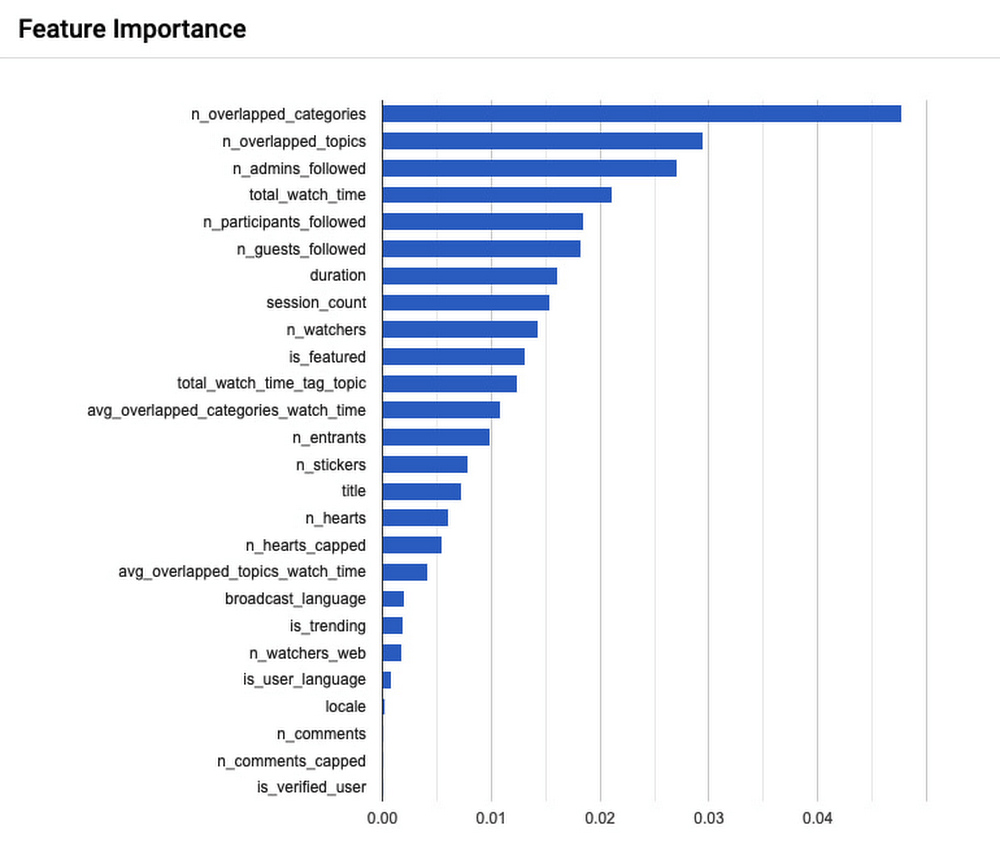
Because Spaces are live audio conversations, the Spaces tab needs to be ranked to customers in near real time so they don’t miss out. With this in mind, Twitter’s model currently performs 900 queries per second on the Spaces tab, and evaluates 50,000 candidates per second. Meanwhile, 99% of these requests are faster than 100 milliseconds, and 90% of requests are faster than 50 milliseconds.
To measure the success of this project, Nguyen’s team conducted A/B experiments around key customer engagement metrics–A stands for the ‘most popular’ heuristic previously in production, and B is the new AutoML model which seeks to personalize Spaces recommendations to the interests of individual Twitter users. Three months into the project, the numbers were encouraging. “After deploying our AutoML Tables solution we saw an increase of 1.96% in Spaces daily active customers, which is one of our key metrics. We also noticed an increase of 1.99% in Spaces join in rates, and an increase of 8.42% in user clicks to explore a Space,” Nguyen shares. “These are positive signals that users are now engaging more with the Spaces tab service on the Twitter app, which is exactly what we set out to do with this project.”
Powering new use cases with hands-off ML frameworks
With this first solution running in production to improve the performance of the Spaces tab, Nguyen starts to ask how else it might support the experience of Twitter users moving forward. “The Spaces tab is a small surface on the Twitter app. With our current ML solution we’re some distance away from serving our home tab traffic, which is where a lot of our traffic happens and therefore would involve a much bigger-scale operation. Getting there will take some work but we’re evaluating the possibility of optimizing our model performance for this in collaboration with Google Cloud,” says Nguyen.
“As a product-led company, we focus on continually improving the customer experience and we want to iterate faster to get to that point. AutoML brings that value to our product teams because it is so hands-off. You don’t need to write any model code in order to reap the benefits from this machine learning framework; AutoML automatically experiments with many different model architectures and comes up with a state-of-the-art model that addresses your needs. So while it is not a one-size-fits-all solution, it is a great solution with the potential to power many more Twitter use cases,” she concludes.
Ahead of the Curve: 5 Data and AI Trends Set to Shape 2023
2256
Of your peers have already read this article.
4:00 Minutes
The most insightful time you'll spend today!
How will your organization manage this year’s data growth and business requirements? Your actions and strategies involving data and AI will improve or undermine your organization’s competitiveness in the months and years to come. Our teams at Google Cloud have an eye on the future as we evolve our strategies to protect technology choice, simplify data integration, increase AI adoption, deliver needed information on demand, and meet security requirements.
Google Cloud worked with* IDC on multiple studies involving global organizations across industries in order to explore how data leaders are successfully addressing key data and AI challenges. We compiled the results in our 2023 Data and AI Trends report. In it, you’ll find the metrics-rich research behind the top five data and AI trends, along with tips and customer examples for incorporating them into your plans.
1: Show data silos the door
Given the increasing volumes of data we’re all managing, it’s no surprise that siloed transactional databases and warehousing strategies can’t meet modern demands. Organizations want to improve how they store, manage, analyze, and govern all their data, while reducing costs. They also want to eliminate conflicting insights from replicated data and empower everyone with fresh data.
A unified data cloud enables the integration of data and insights into transformative digital experiences and better decision making.
Andi Gutmans, GM and VP of Engineering for Databases, Google Cloud
In the report, you can learn how to adopt a unified data cloud that supports every stage of the data lifecycle so that you can improve data usage, accessibility, and governance. Inform your strategy by drawing on organizations’ examples such as a data fabric that improves customer experiences by connecting more than 80 data silos, as well as other unified data clouds that save money and simplify growth.
2: Usher in the age of the open data ecosystem
Data is the key to unlocking AI, speeding up development cycles, and increasing ROI. To protect against data and technology lock-in, more organizations are adopting open source software and open APIs.
Tweet this quote
Understand how you can simplify data integration, facilitate multicloud analytics, and use the technologies you want with an open data ecosystem, as described in the report. Learn from metrics about global open source adoption and public dataset usage. And explore how global companies adopted open data ecosystems to improve patient outcomes, increase website traffic by 25%, and cut operating costs by 90%.
3: Embrace the AI tipping point
Pulling useful information out of data is easier with AI and ML. Not only can you identify patterns and answer questions faster but the technologies also make it easier to solve problems at scale.
We’ve reached the AI tipping point. Whether people realize it or not, we’re already using applications powered by AI—every day. Social media platforms, voice assistants, and driving services are easy examples.
June Yang, VP, Cloud AI and Industry Solutions, Google Cloud
Organizations share how they’re reaching their goals using AI and ML by empowering “citizen data scientists” and having them focus on small wins first. Gain tips from Yang and other experts for developing your AI strategy. And read how organizations achieve outcomes such as a reduction of 7,400 tons per year in carbon emissions and a more than 200% increase in ROI from ad spend by using pattern recognition and other AI capabilities.

4: Infuse insights everywhere
Yesterday’s BI solutions have led to outdated insights and user fatigue with the status quo, based on generic metrics and old information. Research shows that as new tools come online, expectations for BI are changing, with companies revising their strategies to improve decision making, speed up the development of new revenue streams, and increase customer acquisition and retention by providing individuals with needed information on demand.
Organizations are equipping business decision-makers with the tools they need to incorporate required insights into their everyday workflows.
Kate Wright, Senior Director, Product Management, Google Cloud
In the report, you’ll discover why and how data leaders are rethinking their BI analytics strategies and applications to improve users’ trust and use of data in automated workflows, customizable dashboards, and on-demand reports. Global companies also share how they improve decision making with self-service BI, customer experiences with IoT analysis, and threat mitigation with embedded analytics.
5: Get to know your unknown data
Increasing data volumes can make it harder to know where and what data they store, which may create risk. Case in point: If a customer unexpectedly shares personally identifiable information during a recorded customer support call or chat session, that data might require specialized governance, which the standardized storage process may not provide.
If you don’t know what data you have, you cannot know that it’s accurately secured. You also don’t know what security risks you are incurring, or what security measures you need to take.
Anton Chuvakin, Senior Staff Security Consultant, Google Cloud
Check out the report to learn about data security risks that are often overlooked and how to develop proactive governance strategies for your sensitive data. You can also read how global organizations have increased customer trust and productivity by improving how they discover, classify, and manage their structured and unstructured data.
Be ready for what’s next
What’s exciting about these trends is that they’re enabling organizations across industries to realize very different goals using their choice of technologies. And although all the trends depend on each other, research shows you can realize measurable benefits whether you adopt one or all five.
Review the report yourself and learn how you can refine your organization’s data and AI strategies by drawing on the collective insights, experiences, and successes of more than 800 global organizations.
ML Models Built on Google Cloud Solutions Help You Virtually Participate in National Muffin Day!

2953
Of your peers have already read this article.
2:00 Minutes
The most insightful time you'll spend today!
If you’re here you’re probably wondering: what on Earth is the connection between muffins and machine learning, and what is National Muffin Day? To understand this, let’s start with National Muffin Day: an annual holiday co-founded by Jacob and his friend Julia Levy in 2015 to bake muffins and raise money for homelessness. National Muffin Day will occur on Sunday, February 20 this year. For more information on how to participate in National Muffin Day (which involves delicious baked goods and donations to people in need), please see the information at the bottom of this post. Last year, a colleague connected Jacob with Sara, who had done several baking projects that used machine learning to generate new recipes. They decided to collaborate for this year’s National Muffin Day, adding a new muffin recipe created with the help of machine learning.
In this post, we’ll explain how Sara used Google Cloud to develop a new muffin recipe, show you how you can participate virtually in National Muffin Day, and of course—share the recipe.
Machine learning for muffins
At its core, machine learning is the process of finding patterns in data and using those patterns to make predictions on new data. After a lot of baking over the past few years, Sara learned that baking is also based on patterns. For example, the ratio of flour, fat, liquid, and sugar that make up a cookie is very different from the ratio of those ingredients for a bread, a pie crust, or a muffin. She used that discovery to create a recipe for a hybrid cake + cookie, and a cake filled with Maltesers. Next up: muffins!
The first step was figuring out how to translate the task of generating a new muffin recipe into a machine learning task. To solve this, she planned to use numerical data on the amounts of different ingredients in a muffin recipe to train the model. Sara considered two types of models for this task: classification and regression. A classification model would categorize muffin recipes into different muffin types based on their ingredient amounts, and a regression model would do the reverse: take a type of muffin and return the amount of each ingredient needed to make it. She decided to build a regression model, since it would be more fun for the model to return ingredient amounts, rather than tell you which type of muffin recipe you’re already making.
Implementing this first required identifying a few muffin categories and collecting recipe data. This presented a new challenge, since her previous baking models used categories for distinct baked goods (i.e. cakes, cookies, breads). After scouring through quite a few recipes, Sara discovered that many muffins fall into two types: those that use only traditional ingredients as their base (flour, sugar, butter, milk, etc.), and those that include an alternative ingredient, most commonly a pureed fruit, to make the base (like bananas, applesauce, or pumpkin). Using those two categories, the model would take the type of muffin as input and return the amounts of base ingredients required to make that recipe. Here, the inputs can be any values adding up to 100%:
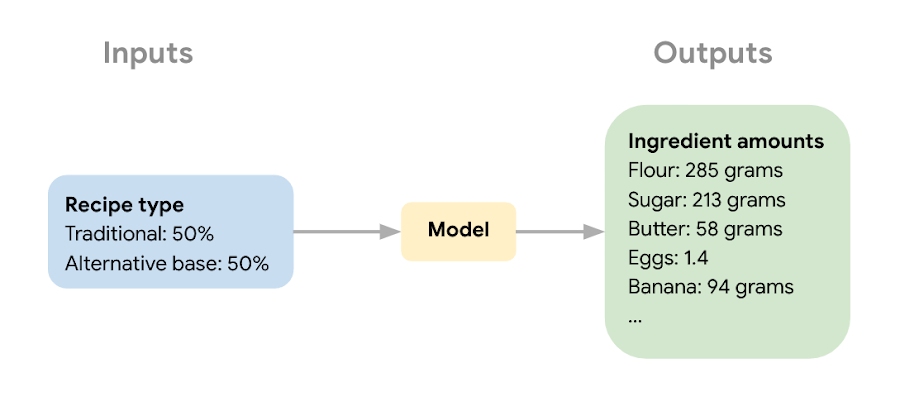
The next step in the ML process was collecting recipe data to use for model training and narrowing down the ingredients used to train the model. Sara wanted the model to learn the combination of core ingredients that make up a muffin batter, rather than flavorings and additions like blueberries, vanilla extract, or chocolate chips. These tasty additions could be added after the model helped create the muffin batter. Once she gathered enough recipes, she removed extra ingredients for training purposes and converted ingredients from different recipes into the same unit (grams, milliliters, and teaspoons).
Building a muffin model with Vertex AI
Sara uploaded the muffin ingredient data into BigQuery, and then created a notebook instance in Vertex AI Workbench to analyze the data. With the new Workbench managed instances, you can interactively query BigQuery tables directly from your instance and copy the code to download your data to a notebook as a Pandas DataFrame:
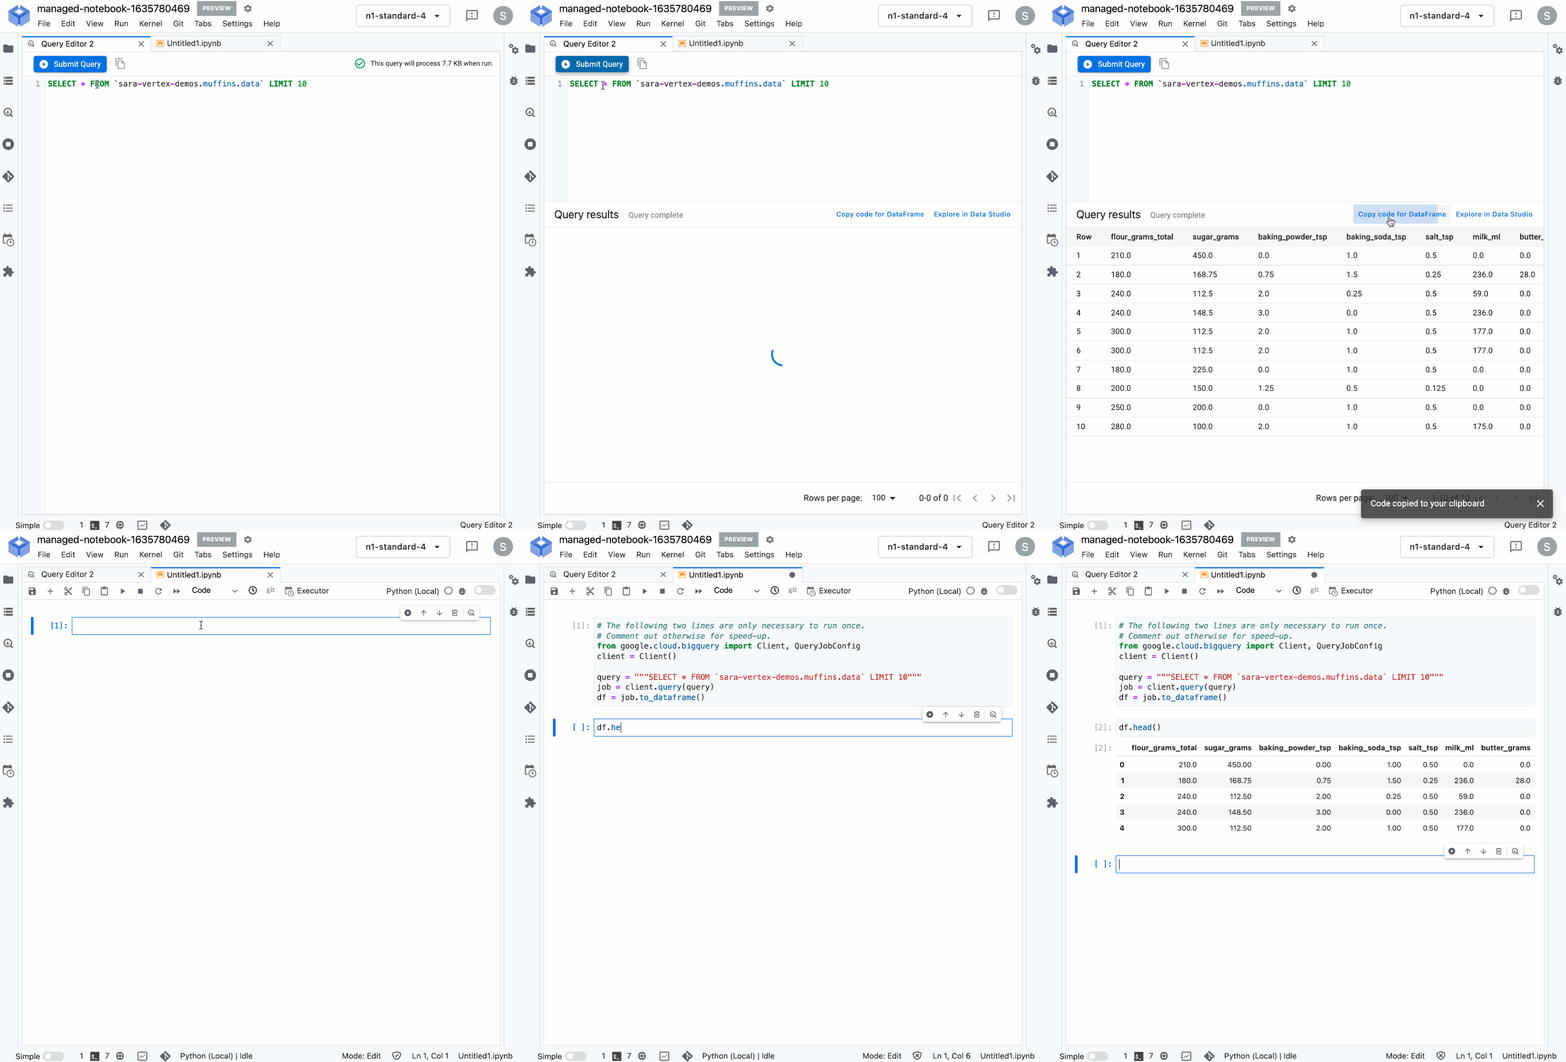
From her notebook instance, Sara experimented with different ML frameworks and model types. She landed on a Scikit-learn regression model to solve this task, and to mimic a real-world production environment, decided to convert this workflow into a ML pipeline. Using the Kubeflow Pipelines SDK, she ran the following on Vertex Pipelines:
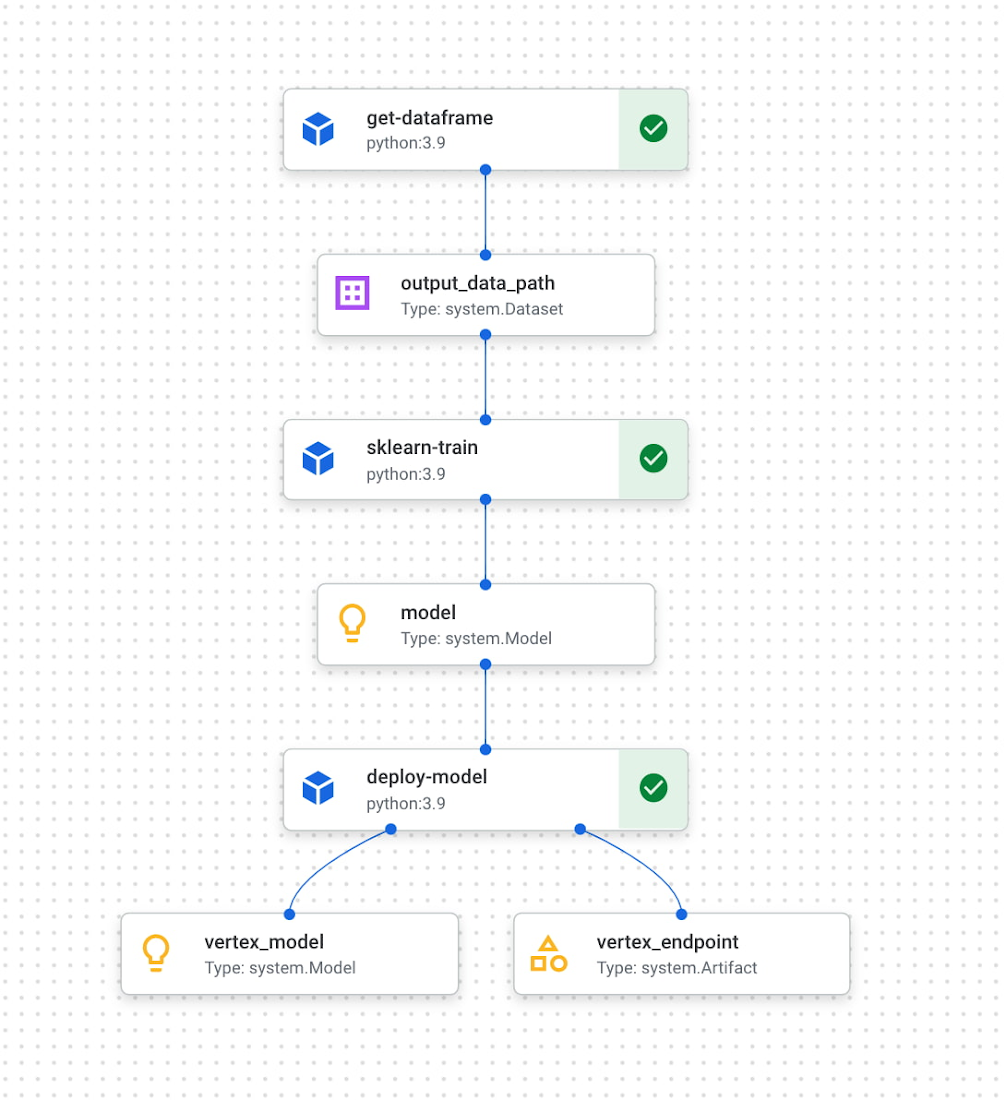
The first component reads the ingredient data from BigQuery and converts it into a Pandas DataFrame which is passed to the next pipeline step. In this step, we train a custom Scikit-learn model on the recipe data. Finally, this model is deployed to an endpoint in Vertex AI. To put it all together, Sara built a web app that allowed her to easily generate ingredient amounts for different muffin types. The web app uses the Vertex AI SDK to call the deployed model endpoint and return ingredient amounts.
The recipe
With a deployed recipe generation model, the only thing left to do was test recipes in the kitchen! Because the model only returns ingredient amounts, there were still many key human elements to complete the baking process: adding yummy additions to the core muffin batter, making adjustments to optimize taste, determining the method for adding ingredients, baking time, and more. After testing a few recipes generated by the model, we landed on a favorite which we’re very excited to share with you here.
Berry ML Muffins

Makes 12 muffins
Flour 285 grams (2 cups)
Granulated sugar 250 grams (1 cup)
Baking powder 2 teaspoons
Baking soda ¼ teaspoon
Salt ½ teaspoon
Cinnamon ½ teaspoon
Milk 170 ml (⅔ cup), room temperature
Butter 55 grams (¼ cup), melted and slightly cooled
Eggs 1 egg plus 1 egg white, room temperature
Canola or vegetable oil 50 grams (¼ cup)
Sour cream 50 grams (3 tablespoons + ¾ teaspoon), room temperature
Vanilla extract 1 ½ teaspoons
Blueberries or raspberries 240 grams (1 ½ cups)
Coarse sugar, like demerara or turbinado (optional for topping) 1 tablespoon
- Measure your three cold ingredients and allow them to come to room temperature: 1 egg + 1 egg white, sour cream, and milk.
- Preheat the oven to 375 F / 190 C. Line a 12-muffin tin with cupcake liners or lightly grease with baking spray.
- In a large bowl, whisk together flour, baking powder, baking soda, salt, and cinnamon. Set aside.
- Melt your butter in a medium heat proof bowl, and allow it to cool slightly for a few minutes. Whisk in sugar until combined. Then add egg, oil, and vanilla, milk, and sour cream and whisk until fully incorporated.
- Pour the wet ingredients into the dry ingredients, mixing with a spatula until just combined. Be careful not to overmix, it’s ok if there are a few lumps in your batter.
- Prepare your fruit. If you can’t decide whether to use blueberries or raspberries, divide your batter into two bowls and do both! Crush half of your fruit and fold it into the batter. Then mix in the remaining whole berries.
- Divide the mixture evenly into the muffin tin. Optionally (but extra tasty), sprinkle the tops of each muffin with about ⅛ teaspoon of coarse sugar. Turbinado or demerara sugar work well for this. This will caramelize and add a nice texture to the tops of your muffins.
- Bake at 375 for 22 – 24 minutes, or until a toothpick inserted in the center comes out clean. For best results, do a toothpick test in a few muffins since not all ovens have an even temperature throughout. Let the muffins cool in the muffin tin for a few minutes, then transfer to a wire rack to cool completely.
- Enjoy!
How can you participate in National Muffin Day?
Participation in National Muffin Day is as easy as 1-2-3!
- On February 20, Bake Muffins. It’s time to dust those muffin tins, grab your blueberries, chocolate chips, rhubarb, and favorite ingredients, and create some magical scrumdiddlyumptiousness! If you want to join Jacob in a virtual baking party, you can register here.
- Then, Give. In non-pandemic years, we asked our bakers to personally hand muffins to hungry folks in their cities. While this is a valuable and rewarding experience, the current state of Covid means this practice is still unsafe, so we request that you refrain from doing this. Instead, if it feels safe, we encourage you to take your delicious baked goods and donate them to local homeless shelters, which can distribute them to those in need. Alternatively, you can share your muffins with friends and families and then make a donation to an organization that benefits people experiencing homelessness, like the ones listed below in step 3.
- Share Your Muffin Pics on Social Media. We’d love to see your muffins! Share your pictures on Twitter or Instagram with the hashtags #givemuffins, or share them to our official Facebook Event page. For each individual baker who participates, we will make donations to Project Homeless Connect, which provides much needed resources to people experiencing homelessness in San Francisco, Family promise, which supports unhoused families nationwide, and Pine Street Inn which provides resources for people experiencing homelessness in Boston. Donations will be on a per-baker basis (with up to $80 donated per baker!), so please feel free to loop in your significant others, kids, nieces and nephews, roommates, friends, and anybody else with a giving spirit who loves deliciousness!
More Relevant Stories for Your Company

Beyond Traditional Learning: AI-based Online Learning Platform and Google Cloud Solutions Push Learners to Get Ahead
The combination of a vital need for IT experts among businesses and a digital skills gap is making lifelong learning increasingly critical. Beyond professional development, learning new skills offers additional rewards from building peer connections to boosting your creativity. That’s why in 2020 Krishna Deepak Nallamilli and I launched KIMO.ai to reimagine how people




Learn Modern App Development Practices to Ship Software Faster
Cloud-native, Kubernetes, Serverless have been the hottest and most widely discussed topics given the velocity and agility benefits. Learn more about how you can leverage these modern app development practices to ship software faster, while reducing costs and improving security and compliance. Learn how Google Cloud lets you modernize existing
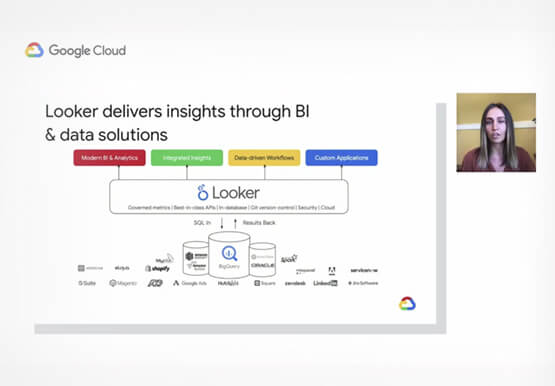
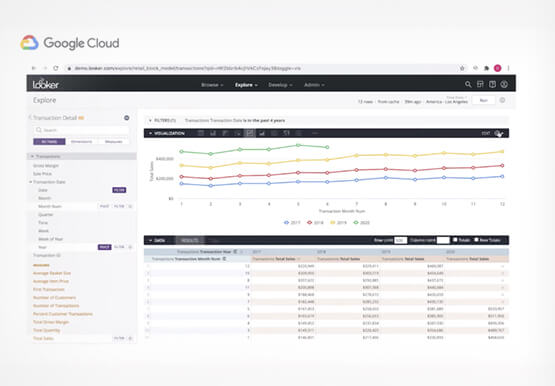
Technical deep dive on Looker: The enterprise BI solution for Google Cloud
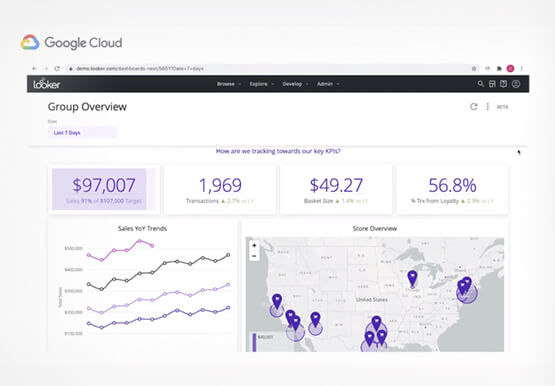
Thousands of users accessing petabytes of data on a daily basis: This is a challenging proposition for enterprises, without a doubt. But Looker makes it possible. Beyond just accessing data though, Looker’s platform transforms your company’s relationship with data. Go under the hood of Looker, with Olivia Morgan, Enterprise CE,


AI-as-a-Service is Here. It’s Really Almost Plug-and-Play
What is the one thing that enterprises want providers to do vis-à-vis AI? To decomplexify it. Today, the path to AI adoption is confusing, and requires skills that are out of reach for most enterprises. That’s what Google Cloud is addressing. “It used to be—still is true—that AI's a pretty
