





5201
Of your peers have already watched this video.
5:00 Minutes
The most insightful time you'll spend today!
How to Build and Maintain Spark and Hadoop Clusters Quickly, Easily and Inexpensively
How often have you struggled to create Spark and Hadoop clusters only to have them become unstable?
Building and maintaining clusters that are the building blocks of big data analytics should not be a time-consuming, repetitive, and expensive process. But with the current set of tools, it often is.
Google Cloud Dataproc solves this. It is a fast, easy-to-use, fully-managed cloud service for running Spark and Hadoop clusters in a simple, more cost-efficient way.
Operations that used to take hours or days take now seconds or minutes instead, and you pay only for the resources you use (with per-second billing).
Watch this five-minute demo to find out how—with just a few clicks—you can set up clusters that build and heal themselves. You’ll find out how to creating a large Dataproc cluster with preemptible VMs, which help run large clusters at a low total cost.
Rubin Observatory Leverages Google Cloud to Power Astronomical Research

6070
Of your peers have already read this article.
2:00 Minutes
The most insightful time you'll spend today!
This week, the Vera C. Rubin Observatory is launching the first preview of its new Rubin Science Platform (RSP) for an initial cohort of astronomers. The observatory, which is located in Chile but managed by the U.S. National Science Foundation’s NOIRLab in Tucson, AZ and SLAC in California, is jointly funded by the NSF and the U.S. Department of Energy. The platform provides an easy-to-use interface to store and analyze the massive datasets of the Legacy Survey of Space and Time (LSST), which will survey a third of the sky each night for ten years, detecting billions of stars and galaxies, and millions of supernovae, variable stars, and small bodies in our Solar System.
The LSST datasets are unprecedented in size and complexity, and will be far too large for scientists to download to their personal computers for analysis. Instead, scientists will use the RSP to process, query, visualize, and analyze the LSST data archives through a mixture of web portal, notebook, and other virtual data analysis services. An initial launch with simulated data, called Data Preview 0, builds on the Rubin Observatory’s three-year partnership with Google to develop an Interim Data Facility (IDF) on Google Cloud to prototype hosting of the massive LSST dataset. This agreement marks the first time a cloud-based data facility has been used for an astronomy application of this magnitude.
Bringing the stars to the cloud
For Data Preview 0, the IDF leverages Cloud Storage, Google Kubernetes Engine (GKE), and Compute Engine to provide the Rubin Observatory user community access to simulated LSST data in an early version of the RSP. The simulated data were developed over several years by the LSST Dark Energy Science Collaboration to imitate five years of an LSST-like survey over 300 square degrees of the sky (about 1,500 times the area of the moon). The resulting images are very realistic: they have the same instrumental characteristics, such as pixel size and sensitivity to photons, that are expected from the Rubin Observatory’s LSST Camera, and they were processed with an early version of the LSST Science Pipelines that will eventually be used to process LSST data. “This will be the first time that these workloads have ever been hosted in a cloud environment. Researchers will have an opportunity to explore an early version of this platform,” says Ranpal Gill, senior manager and head of communications at the Rubin Observatory.
Broadening access for more researchers
Over 200 scientists and students with Rubin Observatory data rights were selected to participate in Data Preview 0 from a pool of applicants that represents a wide range of demographic criteria, regions, and experience level. Participants will be supported with resources such as tutorials, seminars, communication channels, and networking opportunities—and they will be free to pursue their own science at their own pace using the data in the RSP.
“The revolutionary nature of the future LSST dataset requires a commensurately innovative system for data access and analysis paired with robust support for scientists,” says Melissa Graham, lead community scientist for the Rubin Observatory and research scientist in the astronomy department at the University of Washington. “I’m personally excited to enhance my own skills by using the RSP’s tools for big data analysis, while also helping others to learn and to pursue their LSST-related science goals during Data Preview 0.”
At the same time, the fact that the RSP is hosted in the cloud provides researchers at smaller institutions access to state-of-the-art astronomy infrastructure that is comparable to that of the largest national research centers.
The launch benefits the observatory too: the development team can learn what researchers are interested in while also testing and debugging the platform. Graham says that “the platform is still in active development so researchers using it will be able to follow along in the progress, and provide feedback on ways that we can optimize the development of the tools.”
Next steps
The LSST aims to begin the ten-year survey in 2023-24 and expects it to include 500 petabytes of data. Through the cloud, Google aims to help make this extraordinary project scalable and accessible to researchers everywhere. To learn more about Data Preview 0, watch this video.
Want to ramp up your own research in the cloud? We offer research credits to academics using Google Cloud for qualifying projects in eligible countries. You can find our application form on Google Cloud’s website or contact our sales team.
3132
Of your peers have already watched this video.
36:30 Minutes
The most insightful time you'll spend today!
Don’t sweat the big stuff. Make it Google’s problem
Need to interpolate new time series data values over 5 billion rows? Don’t reach for python. Make that Google’s problem and do it in BigQuery.
Need to aggregate petabytes of geospatial data across arbitrary polygons and put it on a map for analysis? Make that Google’s problem and use BQ-GIS.
Great – your map was awesome and now we need it every hour. Roll your own Airflow server? Nope. Make that Google’s problem. You see the pattern.
Geotab, which operates in in the telematics space, applies instrumenting to vehicles to learn how to optimize fleet maintenance, routes and costs, and even find way to optimize city infrastructure.
Geotab has been a long-time customer of Google Cloud products. They leverage the entire GCP suite to empower data scientists to efficiently ingest, process, and analyze petabytes of IoT data.
One of the keys to their pace of innovation and growth has been to focus on their key competencies and partner with others to fill in the gaps.
For Geotab’s data scientists this means focusing on the data and model-building and whenever possible making the processing, storage, and orchestration, well Google’s problem.
How Kinguin Notched Up Shopping Experience with Google Recommendations AI

6451
Of your peers have already read this article.
3:00 Minutes
The most insightful time you'll spend today!
Over 2.14 billion people worldwide are expected to buy online this year, according to Statista. Online retail sales will account for 22% of all purchases by 2023. But in a competitive retail landscape, positive interactions can mean the difference between a sale and an abandoned shopping cart.
One of the leading global marketplaces – Kinguin.net is a haven for gamers. Their bustling ecommerce business conducts over 500,000 new transactions monthly. Users will encounter over 50,000 unique digital products, from video games, gift cards, in-game items to computer software and services. With over 10 million registered users, Kinguin improved their experience by helping users find items quickly and deliver service at scale.
Helping customers find what they want, fast
Because of Kinguin’s high volume of users—both buyers and sellers—and breadth of digital products, browsing and shopping can be challenging. “Customers shop online for choice and convenience, but it can sometimes be overwhelming. We want anyone who shops at Kinguin to find what they are looking for quickly and easily,” says Viktor Romaniuk Wanli, Kinguin CEO and Founder.
Today’s retailers know that creating personalized shopping experiences is crucial for establishing and maintaining customer loyalty. Kinguin discovered their users were getting a rather standard retail experience. They wondered how they could offer them a more tailored, personalized experience.
They knew product recommendations were a great way to personalize experiences because they help customers discover products that match their tastes and preferences. But it’s not that easy to recommend products. Various shifting factors make recommendations much more complex:
- Customer behavior. Understanding customers is tough. How do you recommend something to a cold start user who’s never been to your site before? What happens when their behavior changes?
- Omnichannel context. According to Harvard Business Review, 73% of all customers use many channels when they buy. What happens when they go from desktop to mobile or from social media shopping to a proprietary app?
- Product data challenges. How do you recommend new products within a large catalog of items? What if your product data has sparse labeling or unstructured metadata?
Data wasn’t a problem for Kinguin. They had data orders, history, wishlists, and could collect events based on their platform interactions. It was the machine learning model expertise they lacked. So rather than building their own solution, they determined it was more cost effective for them to find a reliable partner. It was also essential that the solution integrated easily with Kubernetes, which enabled their global network.
With these considerations in mind, they applied for the Google Recommendations AI beta program. Kinguin became the first gaming e-commerce platform in Europe to use Recommendations AI when it launched in 2020.
Pro gamer move: using a fully managed AI service
Google Recommendations AI uses algorithms to deliver highly personalized suggestions tailored to a customer’s preferences. Google Cloud based these algorithms on the same research that powers models by YouTube search and Google Shopping. Algorithms are always being tuned and adjusted to focus on individuals themselves—not just items.
Many shopping AIs rely on manually provisioning infrastructure and training machine learning models. Instead, Recommendations AI’s deep learning models use item and user metadata to gain insights. It processes Kinguin’s thousands of products at scale, iterating in real time. First, Kinguin pieces together a customer’s history and shopping journey. Then, using Recommendations AI, they can serve up personalized products—even for long-tail products and cold-start users.
By leveraging internal tools, Kinguin didn’t need to start implementation from scratch. After a few trial sessions with Google Cloud engineers, they got started right away. Due to the fast-paced nature of a marketplace—i.e., price changes, out-of-stock items—Kinguin needed their recommendations to be as close to real time as possible. They used internal event buses to stream events and their product catalog directly to the recommendations API.
Kinguin rolled out in high-traffic areas, including their home page, product page, and category pages. They analyzed heat maps and scroll maps to figure out where to test placements. They also experimented with different recommendation models such as “recently bought together” and “you may like.” Engineers also factored in where they were implementing the models. For example, the “others you might like” model would fit best on the homepage, while “frequently bought together” made sense at checkout.
Understanding how product recommendations influence financials is critical for demonstrating the impact of personalization. Using BigQuery, Kinguin could analyze different cost projection models. BigQuery helped them dig into specific financial data to understand their margins and revenue gains.
Playing to win: enhanced customer experience
Since adopting Recommendations AI, Kinguin has improved both customer experience and satisfaction. Search times have shortened by 20 seconds. Additionally, their average cart value has increased by 5 EUR. Conversion rates have quadrupled since the outset. Click-thru rates have doubled, increasing by 2.16 on product pages and 2.8 times on recommendations pages.
“Google Recommendations AI has helped us evolve our service, increase customer loyalty and satisfaction. It has also contributed to a significant rise in sales,” says Wanli. Kinguin is already thinking about other ways of enhancing user experiences with recommendations. Ideas include their checkout process, other landing pages, and email marketing.
Kinguin’s journey with Google Cloud shows how companies can leverage AI to optimize sales and deliver high-performing, low-latency recommendations to any customer touchpoint.
Learn more about Recommendations AI and Google Cloud AI and machine learning solutions.
New Capabilities in BigQuery to Ease Anomalies Detection in the Absence of Labeled Data

6329
Of your peers have already read this article.
4:00 Minutes
The most insightful time you'll spend today!
When it comes to anomaly detection, one of the key challenges that many organizations face is that it can be difficult to know how to define what an anomaly is. How do you define and anticipate unusual network intrusions, manufacturing defects, or insurance fraud? If you have labeled data with known anomalies, then you can choose from a variety of supervised machine learning model types that are already supported in BigQuery ML. But what can you do if you don’t know what kind of anomaly to expect, and you don’t have labeled data? Unlike typical predictive techniques that leverage supervised learning, organizations may need to be able to detect anomalies in the absence of labeled data.
Today we are announcing the public preview of new anomaly detection capabilities in BigQuery ML that leverage unsupervised machine learning to help you detect anomalies without needing labeled data. Depending on whether or not the training data is time series, users can now detect anomalies in training data or on new input data using a new ML.DETECT_ANOMALIES function (documentation), with the following models:
- Autoencoder model, now in Public Preview (documentation)
- K-means model, already GA (documentation)
- ARIMA_PLUS time series model, already GA (documentation)
How does anomaly detection with ML.DETECT_ANOMALIES work?
To detect anomalies in non-time-series data, you can use:
- K-means clustering models: When you use
ML.DETECT_ANOMALIESwith a k-means model, anomalies are identified based on the value of each input data point’s normalized distance to its nearest cluster. If that distance exceeds a threshold determined by the contamination value provided by the user, the data point is identified as an anomaly. - Autoencoder models: When you use
ML.DETECT_ANOMALIESwith an autoencoder model, anomalies are identified based on the reconstruction error for each data point. If the error exceeds a threshold determined by the contamination value, it is identified as an anomaly.
To detect anomalies in time-series data, you can use:
- ARIMA_PLUS time series models: When you use
ML.DETECT_ANOMALIESwith an ARIMA_PLUS model, anomalies are identified based on the confidence interval for that timestamp. If the probability that the data point at that timestamp occurs outside of the prediction interval exceeds a probability threshold provided by the user, the datapoint is identified as an anomaly.
Below we show code examples of anomaly detection in BigQuery ML for each of the above scenarios.
Anomaly detection with a k-means clustering model
You can now detect anomalies using k-means clustering models, by running ML.DETECT_ANOMALIES to detect anomalies in the training data or in new input data. Begin by creating a k-means clustering model:
Language: SQL
CREATE MODEL `mydataset.my_kmeans_model`OPTIONS(MODEL_TYPE = 'kmeans',NUM_CLUSTERS = 8,KMEANS_INIT_METHOD = 'kmeans++') ASSELECT* EXCEPT(Time, Class)FROM`bigquery-public-data.ml_datasets.ulb_fraud_detection`;
With the k-means clustering model trained, you can now run ML.DETECT_ANOMALIES to detect anomalies in the training data or in new input data.
To detect anomalies in the training data, use ML.DETECT_ANOMALIES with the same data used during training:
Language: SQL
SELECT*FROMML.DETECT_ANOMALIES(MODEL `mydataset.my_kmeans_model`,STRUCT(0.02 AS contamination),TABLE `bigquery-public-data.ml_datasets.ulb_fraud_detection`);

To detect anomalies in new data, use ML.DETECT_ANOMALIES and provide new data as input:
Language: SQL
SELECT*FROMML.DETECT_ANOMALIES(MODEL `mydataset.my_kmeans_model`,STRUCT(0.02 AS contamination),(SELECT * FROM `mydataset.newdata`));

How does anomaly detection work for k-means clustering models?
Anomalies are identified based on the value of each input data point’s normalized distance to its nearest cluster, which, if exceeds a threshold determined by the contamination value, is identified as an anomaly. How does this work exactly? With a k-means model and data as inputs, ML.DETECT_ANOMALIES first computes the absolute distance for each input data point to all cluster centroids in the model, then normalizes each distance by the respective cluster radius (which is defined as the standard deviation of the absolute distances of all points in this cluster to the centroid). For each data point, ML.DETECT_ANOMALIES returns the nearest centroid_id based on normalized_distance, as seen in the screenshot above. The contamination value, specified by the user, determines the threshold of whether a data point is considered an anomaly. For example, a contamination value of 0.1 means that the top 10% of descending normalized distance from the training data will be used as the cut-off threshold. If the normalized distance for a datapoint exceeds the threshold, then it is identified as an anomaly. Setting an appropriate contamination will be highly dependent on the requirements of the user or business.
For more information on anomaly detection with k-means clustering, please see the documentation here.
Anomaly detection with an autoencoder model
You can now detect anomalies using autoencoder models, by running ML.DETECT_ANOMALIES to detect anomalies in the training data or in new input data.
Begin by creating an autoencoder model:
Language: SQL
CREATE MODEL `mydataset.my_autoencoder_model`OPTIONS(model_type='autoencoder',activation_fn='relu',batch_size=8,dropout=0.2,hidden_units=[32, 16, 4, 16, 32],learn_rate=0.001,l1_reg_activation=0.0001,max_iterations=10,optimizer='adam') ASSELECT* EXCEPT(Time, Class)FROM`bigquery-public-data.ml_datasets.ulb_fraud_detection`;
To detect anomalies in the training data, use ML.DETECT_ANOMALIES with the same data used during training:
Language: SQL
SELECT*FROMML.DETECT_ANOMALIES(MODEL `mydataset.my_autoencoder_model`,STRUCT(0.02 AS contamination),TABLE `bigquery-public-data.ml_datasets.ulb_fraud_detection`);

To detect anomalies in new data, use ML.DETECT_ANOMALIES and provide new data as input:
Language: SQL
SELECT*FROMML.DETECT_ANOMALIES(MODEL `mydataset.my_autoencoder_model`,STRUCT(0.02 AS contamination),(SELECT * FROM `mydataset.newdata`));

How does anomaly detection work for autoencoder models?
Anomalies are identified based on the value of each input data point’s reconstructed error, which, if exceeds a threshold determined by the contamination value, is identified as an anomaly. How does this work exactly? With an autoencoder model and data as inputs, ML.DETECT_ANOMALIES first computes the mean_squared_error for each data point between its original values and its reconstructed values. The contamination value, specified by the user, determines the threshold of whether a data point is considered an anomaly. For example, a contamination value of 0.1 means that the top 10% of descending error from the training data will be used as the cut-off threshold. Setting an appropriate contamination will be highly dependent on the requirements of the user or business.
For more information on anomaly detection with autoencoder models, please see the documentation here.
Anomaly detection with an ARIMA_PLUS time-series model

With ML.DETECT_ANOMALIES, you can now detect anomalies using ARIMA_PLUS time series models in the (historical) training data or in new input data. Here are some examples of when might you want to detect anomalies with time-series data:
Detecting anomalies in historical data:
- Cleaning up data for forecasting and modeling purposes, e.g. preprocessing historical time series before using them to train an ML model.
- When you have a large number of retail demand time series (thousands of products across hundreds of stores or zip codes), you may want to quickly identify which stores and product categories had anomalous sales patterns, and then perform a deeper analysis of why that was the case.
Forward looking anomaly detection:
- Detecting consumer behavior and pricing anomalies as early as possible: e.g. if traffic to a specific product page suddenly and unexpectedly spikes, it might be because of an error in the pricing process that leads to an unusually low price.
- When you have a large number of retail demand time series (thousands of products across hundreds of stores or zip codes), you would like to identify which stores and product categories had anomalous sales patterns based on your forecasts, so you can quickly respond to any unexpected spikes or dips.
How do you detect anomalies using ARIMA_PLUS? Begin by creating an ARIMA_PLUS time series model:
Language: SQL
CREATE OR REPLACE MODEL mydataset.my_arima_plus_modelOPTIONS(MODEL_TYPE='ARIMA_PLUS',TIME_SERIES_TIMESTAMP_COL='date',TIME_SERIES_DATA_COL='total_amount_sold',TIME_SERIES_ID_COL='item_name',HOLIDAY_REGION='US') ASSELECTdate,item_description AS item_name,SUM(bottles_sold) AS total_amount_soldFROM`bigquery-public-data.iowa_liquor_sales.sales`GROUP BYdate,item_nameHAVINGdate BETWEEN DATE('2016-01-04') AND DATE('2017-06-01')AND item_name IN ("Black Velvet", "Captain Morgan Spiced Rum","Hawkeye Vodka", "Five O'Clock Vodka", "Fireball Cinnamon Whiskey");
To detect anomalies in the training data, use ML.DETECT_ANOMALIES with the model obtained above:
Language: SQL
SELECT*FROMML.DETECT_ANOMALIES(MODEL `mydataset.my_arima_plus_model`,STRUCT(0.8 AS anomaly_prob_threshold));

To detect anomalies in new data, use ML.DETECT_ANOMALIES and provide new data as input:
Language: SQL
WITHnew_data AS (SELECTdate,item_description AS item_name,SUM(bottles_sold) AS total_amount_soldFROM`bigquery-public-data.iowa_liquor_sales.sales`GROUP BYdate,item_nameHAVINGdate BETWEEN DATE('2017-06-02')AND DATE('2017-10-01')AND item_name IN ('Black Velvet','Captain Morgan Spiced Rum','Hawkeye Vodka',"Five O'Clock Vodka",'Fireball Cinnamon Whiskey') )SELECT*FROMML.DETECT_ANOMALIES(MODEL `mydataset.my_arima_plus_model`,STRUCT(0.8 AS anomaly_prob_threshold),(SELECT*FROMnew_data));

For more information on anomaly detection with ARIMA_PLUS time series models, please see the documentation here.
Thanks to the BigQuery ML team, especially Abhinav Khushraj, Abhishek Kashyap, Amir Hormati, Jerry Ye, Xi Cheng, Skander Hannachi, Steve Walker, and Stephanie Wang.
5144
Of your peers have already watched this video.
44:51 Minutes
The most insightful time you'll spend today!
The Strange Phenomenon AI Revealed at Ride-Hailing Company Go-Jek
Go-Jek, Indonesia’s first billion-dollar startup, has seen an incredible amount of growth in both users and data over the past two years. Many of the ride-hailing company’s services are backed by machine learning models hosted on Google Cloud Platform. Models range from driver allocation, to dynamic surge pricing, to food recommendation, and process millions of bookings every day, leading to substantial increases in revenue and customer retention.
By embracing Google Cloud, Go-Jek has overcome many of the technical challenges brought on by its rapid growth. BigQuery has become the cornerstone of their data foundation, scaling seamlessly to meet their immense data storage and processing needs.
Using Pub/Sub as an event stream and Dataflow for unified batch and stream processing has prevented inconsistencies in production data, while simultaneously reducing costs through intelligent resource allocation.
Together, these technologies allow Go-Jek to react immediately to real world events, whether by retraining models with ML Engine, or refreshing data in a low latency data store like BigTable.
Find out how Go-Jek leverages Google Cloud and other lessons they have learned scaling machine learning.
More Relevant Stories for Your Company
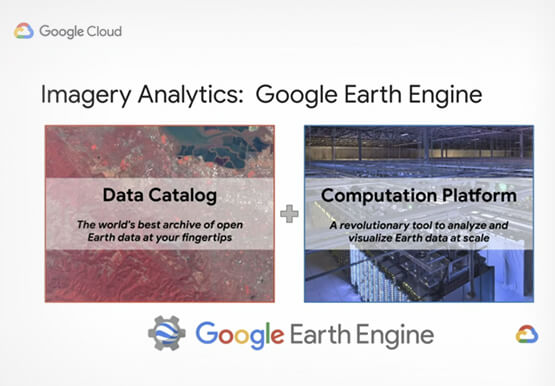
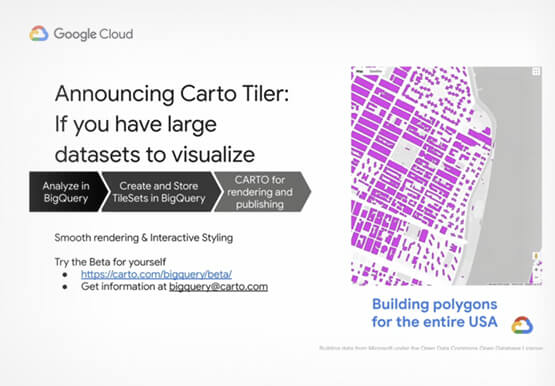
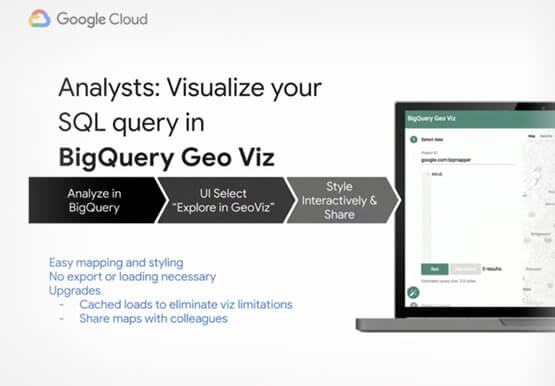

Reinventing geospatial analytics as only Google can do: Intelligent platform
Geospatial analytics is undergoing a fundamental change with the application of cloud computing products. Every day, data analysts need to understand the geospatial impact on their data and GIS professionals are finding themselves constrained by legacy technology that can’t keep pace with increasing data volume. Google Cloud’s geospatial analytics platform

BURGER KING Germany: Serving Up Marketing Insights and Supply Chain Visibility Easily
Do hamburgers really come from Hamburg? This may still be a matter of debate, but the popularity of American-style burger joints not just in Hamburg but all over Germany, is clear. Germany’s top two fast food companies are both burger chains. One of them is BURGER KING®, a global brand that welcomes more

3 AI Tools You Can Deploy Immediately
AI has the power to revolutionize every industry—from retail to agriculture, and education to healthcare. Yet many businesses still haven’t begun to adopt AI. There are a number of factors, including the need for specialized talent and hardware, the right types and quantities of data for training and refining machine

Data Culture Integral for Building Data Platforms in EdTech Firms
With a data strategy and data warehouse in place, EdTechs are building a data culture that helps everyone - from educators and administrators, to employees in marketing and accounting - make more informed decisions with their data. So how do you build a data culture in your organization? It starts
