





5143
Of your peers have already watched this video.
44:51 Minutes
The most insightful time you'll spend today!
The Strange Phenomenon AI Revealed at Ride-Hailing Company Go-Jek
Go-Jek, Indonesia’s first billion-dollar startup, has seen an incredible amount of growth in both users and data over the past two years. Many of the ride-hailing company’s services are backed by machine learning models hosted on Google Cloud Platform. Models range from driver allocation, to dynamic surge pricing, to food recommendation, and process millions of bookings every day, leading to substantial increases in revenue and customer retention.
By embracing Google Cloud, Go-Jek has overcome many of the technical challenges brought on by its rapid growth. BigQuery has become the cornerstone of their data foundation, scaling seamlessly to meet their immense data storage and processing needs.
Using Pub/Sub as an event stream and Dataflow for unified batch and stream processing has prevented inconsistencies in production data, while simultaneously reducing costs through intelligent resource allocation.
Together, these technologies allow Go-Jek to react immediately to real world events, whether by retraining models with ML Engine, or refreshing data in a low latency data store like BigTable.
Find out how Go-Jek leverages Google Cloud and other lessons they have learned scaling machine learning.
Google Cloud’s Firebase Realtime Database and BigQuery AllowsCastbox to Ramp Up Customer Experience

8154
Of your peers have already read this article.
3:30 Minutes
The most insightful time you'll spend today!
Demand for spoken audio content such as podcasts remains robust despite the proliferation of video services and other entertainment options for consumers. Shibin Li, Co-founder of Castbox, credits growth of the global podcast platform to the following: speed and availability, market-leading features, the proliferation of smart devices to deliver audio content, and activities — such as driving and working around the house — that make consuming video difficult.
Founded in 2016 and headquartered in Beijing, China, Castbox enables users to locate, access, and create spoken audio content. Available on iOS and Android, Castbox supports 50 million podcasts, on-demand radio programs, and audiobooks in 70 languages from 175 countries. The platform hosts about 2 million users per day and is the largest podcast platform on Android.
Castbox includes a range of features that build on its core service to provide a high-quality user experience. These features include curated podcast recommendations and in-audio search.
A combination of services
At its inception, Castbox relied on a combination of a multinational cloud services, as well as Google Cloud Platform (GCP) services, including the Google BigQuery analytics data warehouse and Cloud APIs to provide programmatic interfaces with Google Cloud services, and a range of services from the Google mobile development platform Firebase.
However, as Castbox matured and its user base expanded, the business increased its reliance on Google Cloud Platform and Firebase.
“We needed to access stable cloud services as we could not tolerate long periods of downtime that would compromise the user experience,” says Li. “Furthermore, we had to support up to 50,000 concurrent connections, and potentially more in future, without disruption.”
“Based on our analysis of the data in Google BigQuery, we can determine what type of content users are listening to, how long they like to listen to it, and when they like to listen to it. This allows us to recommend similar podcasts to each user based on the preferences he or she expressed, encouraging activity on and return visits to our platform.”
—Shibin Li, Co-Founder, Castbox
Competitive differentiation
Castbox also found machine learning-powered Google Cloud Platform APIs could help deliver features, such as in-audio search, that differentiate the podcast platform from its competitors. In addition, Firebase SDKs and Firebase A/B Testing would enable Castbox to create and analyze new applications, as well as make adjustments based on user feedback. Firebase Realtime Database would allow the business to support tens of thousands of concurrent user connections.
The diligence of the Google Cloud team in advising Li and her team about forthcoming products and services also swayed Castbox towards Google technologies. The business gained the opportunity with Google to join several programs that offered early access to Google innovations.
Signature in-audio search service
Castbox now uses Google Cloud Platform services in the Tokyo, Japan, and U.S. East regions. Cloud Speech-to-Text API plays a key role in delivering Castbox’s signature in-audio search service. This service enables users to search transcriptions of audio content on the platform for words or phrases. The search results incorporate the title of the podcast and the search term in context (for example, within the sentence or sentence excerpt in which it appears). Each use of the word or phrase is time-stamped so it can easily be found. The API enables Castbox developers to apply neural network algorithms to achieve audio-to-text conversion accuracy rates of greater than 96%, while search queries typically experience latency of just 50 milliseconds.
In addition, the latency of comparison data, converting audio to text, is only about 250 milliseconds, contributing to the processing of about 12 minutes worth of audio to text in just 10 minutes. “We can process about 20 hours of audio files in one day,” Li says. “This enables us to transcribe and index all the new episodes of a podcast in that period.”
50,000 concurrent connections
With Firebase Realtime Database, Castbox now supports up to 50,000 concurrent connections to its platform with an average latency per connection of just 10 milliseconds. “Firebase Realtime Database also allows us to continue operating in offline mode, which is extremely helpful if we experience any network disruptions,” Li explains. “When we come back online again, any data is simply synchronized with the database.”
Google BigQuery and the analytics capabilities of Firebase SDKs also enable Castbox to monitor and analyze user behaviors. “Based on our analysis of the data in Google BigQuery, we can determine what type of content users are listening to, how long they like to listen to it, and when they like to listen to it,” Li explains. “This allows us to recommend similar podcasts to each user based on the preferences he or she expressed, encouraging activity on and return visits to our platform.”
“Given our queries may span up to 40 days of data, we may be analyzing up to 1,200 GB at one time. We have no problem doing this with Google BigQuery.”
—Shibin Li, Co-Founder, Castbox
Castbox also uses its analyses of Google BigQuery data to amend banners and summaries on its platform to encourage users to listen to additional content. Furthermore, the service is prepared to make surprise recommendations of content to users based on the preferences and reactions of users with similar tastes.
“We analyze a pool of data growing at up to 30 GB per day,” Li explains. “Given our queries may span up to 40 days of data, we may be analyzing up to 1,200 GB at one time. We have no problem doing this with Google BigQuery.” These analyses also support Castbox’s decision to start creating original content, such as finance and economic news, for its platform.
Checking weekly changes
Castbox does not rely only on analyzing user data to deliver a high-quality experience. The business aggregates user feedback from emails and Google Play reviews to make weekly changes to its platform. It then uses Firebase A/B Testing to check whether these changes are met with a positive user response.
“We are extremely pleased with Google Cloud Platform and Firebase. We have been able to differentiate ourselves from our competitors and provide an attractive option for users at a time when content and entertainment options are exploding. We have a great opportunity with Google to continue to improve the value of our offering to users and build engagement and loyalty.”
—Shibin Li, Co-Founder, Castbox
Castbox’s positive experiences with Google Cloud Platform are encouraging the business to grow its use of the product. “We are trying to move some more services to Google Cloud Platform because it is very stable and scalable,” Li says. The business is keen to explore the capabilities of Cloud Pub/Sub to provide low latency messaging between applications, Cloud Spanner to deliver a distributed relational database service, and Cloud Dataflow to transform and enrich data in stream and batch modes.
“We are extremely pleased with Google Cloud Platform and Firebase,” Li concludes. “We have been able to differentiate ourselves from our competitors and provide an attractive option for users at a time when content and entertainment options are exploding. We have a great opportunity with Google to continue to improve the value of our offering to users and build engagement and loyalty.”
How Vertex AI Helps Coca-Cola Bottlers Japan Analyze Billions of Data Records

6196
Of your peers have already read this article.
4:00 Minutes
The most insightful time you'll spend today!
Japan is home to millions of vending machines installed on streets and in buildings, sports stadiums and other facilities. Vending machine owners and operators, including beverage manufacturers, stock these machines with different product combinations depending on location and demand. For example, they primarily display coffee and energy drinks in machines placed in offices and sports drinks and mineral water in machines at sports facilities. The combinations also vary by season: for example, owners and operators may display cold beverages in summer and hot beverages in winter.
Traditionally, vending machine operators have relied on the intuition and experience of sales managers to determine the optimum product mix for each vending machine. However, in recent years, manufacturers such as Coca-Cola Bottlers Japan (CCBJ) have turned to data to analyze and make strategic decisions about when and where to locate products in machines.
CCBJ is the number one Coca-Cola bottler in Asia and vending machines comprise the bulk of its business. The organization operates about 700,000 machines across Tokyo, Osaka, Kyoto, and 35 prefectures. Minori Matsuda, Google Developer Expert and also Data Science Manager at CCBJ, says “The billions of data records collected from 700,000 physical devices are a great asset and a treasure trove we can take advantage of.”
Minori points out that when considering the mix of products in vending machines in sporting facilities, the managers naturally assume sports drinks would generally sell well. However, analysis of purchase data – including hot drinks and hot drinks plus sports drinks – found many parents purchased sweet drinks such as milk tea when they attended games or sessions involving their children. “Analyzing data gives us new discoveries and, by using catchy storytelling techniques from exploratory data analysis, we are instilling a data culture within our company,” he says. “It’s worth creating by looking at facts rather than making assumptions!”
Minori believes that to analyze the vast amount of data collected from more than 700,000 vending machines, the business needs a powerful analytical platform. However, until recently, CCBJ had to extract data for analysis from its core systems, load this data into a warehouse it created and perform the required analyses. The billions of records of data generated across the fleet – including transaction data – exposed some challenges for traditional analysis platforms. They could not efficiently process data at a considerable scale: it could take a day to return results and required extensive maintenance due to the size.
CCBJ considered building a machine learning (ML) platform as a layer on top of existing systems in August 2020 and opted for Google Cloud the following month. “I feel that Google Cloud has an edge in all products and is very well thought out,“ says Minori, noting the scalability and cost of the platform allow the business to take a ‘trial and error’ approach to achieve the best outcomes from ML. Google Cloud also delivered the required visibility and flexibility to help the business deliver change every day against key performance indicators.
MLOps platform streamlines ML pipeline development
CCBJ built its analysis platform using Vertex AI (formerly AI Platform) centered on a BigQuery analytics data warehouse, and partly using AutoML for tabular data. “We have created a prediction model of where to place vending machines, what products are lined up in the machines and at what price, how much they will sell, and implemented a mechanism that can be analyzed on a map,” says Minori, adding that building the platform with Google Cloud was not difficult. “We were able to realize it in a short period of time with a sense of speed, from platform examination to introduction, prediction model training, on-site proof of concept to rollout.”
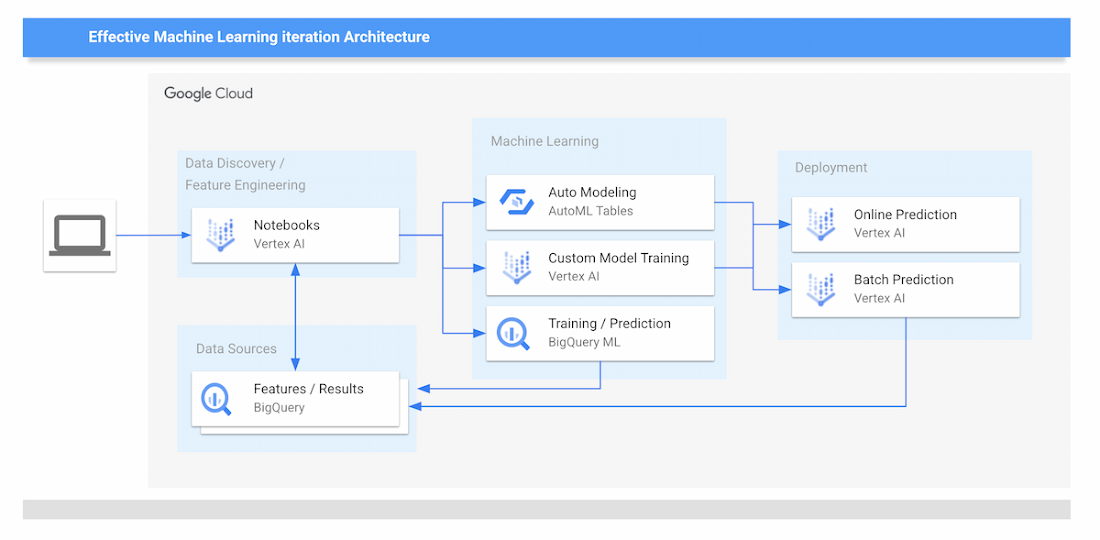
The new data analytics platform of CCBJ consists of the following parts:
Data Sources
- The data collected from the vending machines are all stored on BigQuery.
Data Discovery and Feature Engineering
- Minori and other data scientists at CCBJ are using Vertex Notebooks, where they access the data on BigQuery by executing SQL queries directly from the Notebooks. This environment is used for the data discovery process and feature engineering.
ML Training
- For ML training, CCBJ uses AutoML for Tabular data, Custom model training on Vertex AI, and BigQuery ML. AutoML gives model performance with AUC curves and also feature importance graphs.
ML Prediction and Serving
- For ML prediction, CCBJ uses Online Prediction for AutoML models and Online Prediction for custom models for real-time prediction when the salesperson finds the interesting point
- Batch Prediction is used for generating a large prediction map that covers the whole country
- The prediction results are distributed to sales managers’ tablets
CCBJ started constructing the platform in September 2020, and completed it within a month. The business has conducted proofs of concept at its base in Kyoto since February 2021, and since April, has rolled out the platform to sales managers in 35 prefectures in one metropolitan area. “Data analysis is built into the day-to-day routines of sales managers with 100% utilization,” says Minori. “They can utilize the prediction results on tablets that were able to achieve pretty high accuracy from the start.”
The hardest part was the education of sales managers in the field; having them understand the reasoning behind the ML prediction results for particular outcomes, so they could be convinced to make use of the results. “For example, regarding a new installation location predicted by the model, it seemed that there was no effective information for installation from the map information, but when I actually went there, there was a motorcycle shop and it was a place where young people who like motorcycles gathered,” says Minori. “Or there is a small meeting place where the elderly in the neighborhood are active.
“In many cases, new discoveries that cannot be understood from map information alone can be derived from the data.”
Minori also points to a phenomenon whereby humans pursued and confirmed factors inferred by the model – meaning that once they experienced analysis and it worked effectively, they asked why the same type of analysis or prediction could not be undertaken next time. The resulting cycle of more inquiries generated, more information gathered and more data captured for analysis meant the accuracy of results was improved.
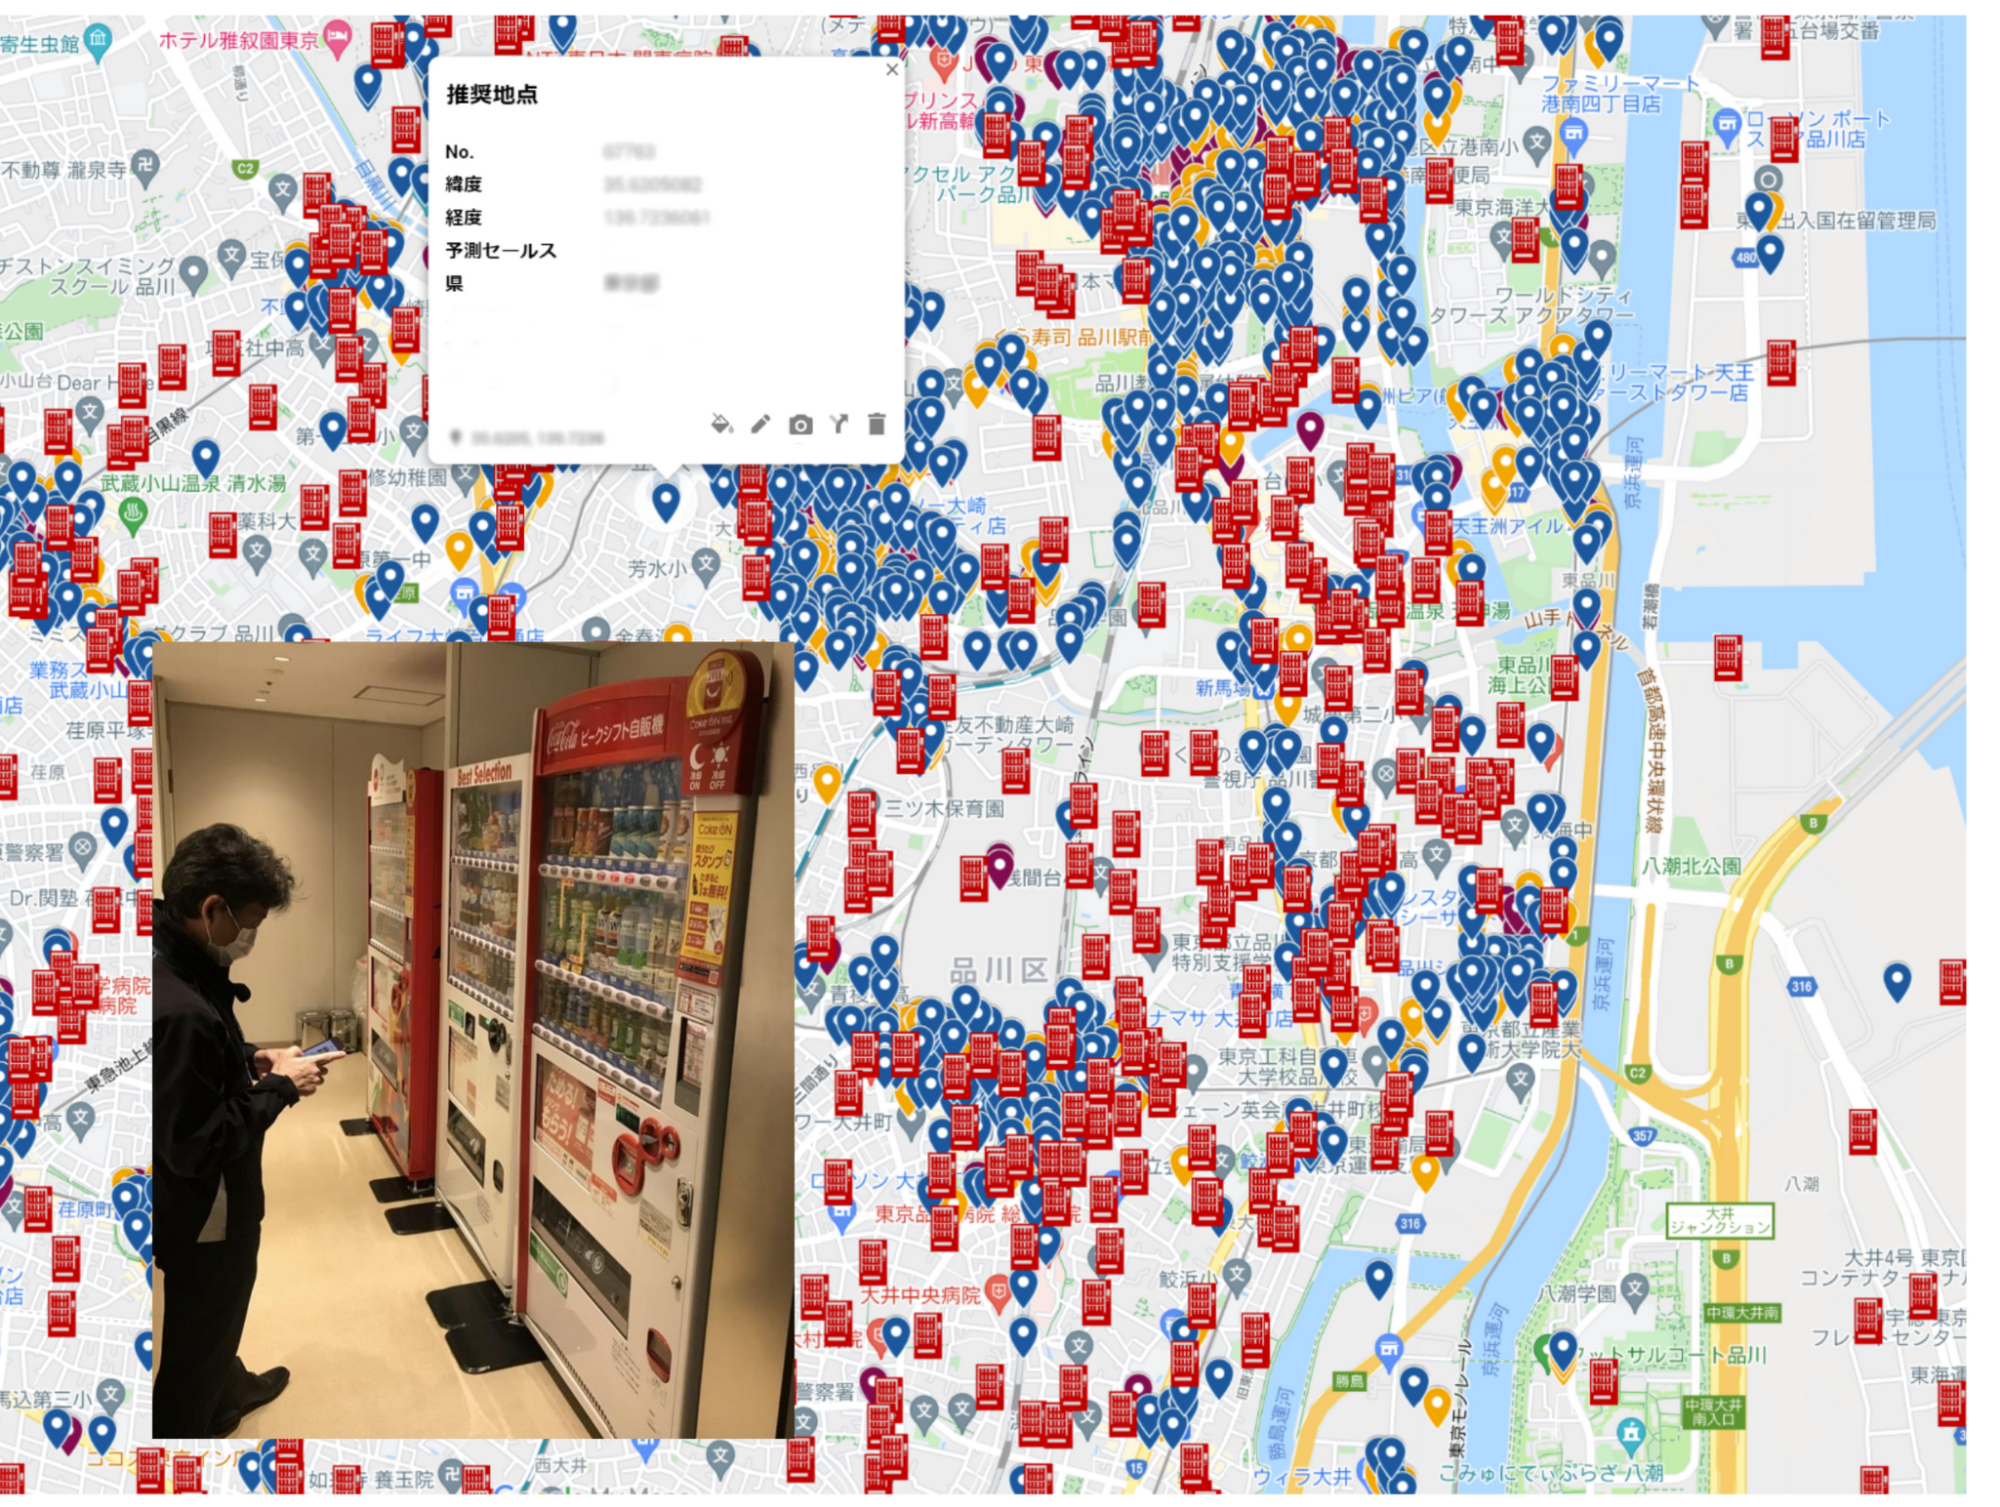
Minori describes Vertex AI as having a number of strengths in helping CCBJ build a ML data analysis platform. “One of the major merits of Vertex AI was that we were able to realize MLOps that streamlines the entire development life cycle from construction of the ML pipeline to its execution,” he says.
With near real-time data analysis through Google Cloud, CCBJ teams can spend time developing strategies rather than waiting for data requested from the IT systems department. Exploratory data analysis is also considerably easier as repeated trial and error has greatly improved the accuracy of analyses. Before we used Machine Learning, most machine placement processes were done by human senses, by looking at a map to find the suggestion points. By using Machine Learning to generate a massive number of placement point suggestions, the efficiency of routing of salespeople has been dramatically improved.
In the future, CCBJ aims to automate the continuous training pipeline with Vertex AI. “CCBJ is a tech company that operates in the food industry,” says Minori. With the organization operating a vending machine network of 700,000 units, it would like to create new businesses based on utilization and analyzing data. Some of these businesses may be based on Sustainable Development Goals (SDGs) initiatives such as the utilization of recycled PET bottles, measures to prevent food loss and ways of using vending machines to contribute to local communities, which we have been working on for some time. It would be interesting if we could collaborate with Google Cloud on these in the future.”

ESG Did the Math: It’s Cheaper and Smarter to Migrate Enterprise Data Warehouses to Google BigQuery. Way Smarter
DOWNLOAD WHITEPAPER6480
Of your peers have already downloaded this article
11:30 Minutes
The most insightful time you'll spend today!
Enterprise data warehouses (EDWs) are often deemed the most valuable asset in the data center, serving as the backbone of the business. The ongoing insight gained from these solutions has justified the significant up-front capital investments and ongoing operational costs, but the rigidity of the traditional EDW is forcing organizations to reevaluate their approach to analytics and business intelligence.
While legacy EDW solutions were all about throwing as much computational power as possible at a relatively static data set, with the inflow of new and valuable sources of data and the emergence of all-encompassing analytics initiatives, the success of today’s EDW solutions depends more on operational and resource agility than raw horsepower.
Being able to dynamically adjust to the needs of the business, integrate into operational processes, and quickly react to emerging opportunities can place an organization at a distinct competitive advantage.
Today’s EDW solutions must act as a global repository of information, provide the agility to scale up or down on demand, and seamlessly integrate with other analytics tools and services used throughout a data-driven organization.
Over the last two years, ESG has conducted detailed studies quantifying the economic value of Google data analytics services. The first evaluated Google BigQuery compared to on-premises Hadoop and AWS redshift. The second focused on Google DataProc compared to DIY Spark and Hadoop approaches. Here’s the next iteration of our economic analysis, extending the BigQuery study to incorporate a comparison to legacy enterprise data warehouses, both on-premises and in the cloud.
Through publicly available pricing and in-depth qualitative customer interviews, ESG was able to assert a base set of assumptions that power a dynamic model, incorporating up-front capital investments, deployment and migration costs, expected monthly cloud costs, administrative costs, and operational costs associated with legacy on-premises EDWs, cloud-based EDWs, and Google BigQuery.
The crux of the results show organizations can save up to 52% by using BigQuery over on-premises EDWs and up to 41% over cloud-based EDWs. Unlike legacy on-premises EDWs, BigQuery provides organizations with the key abilities that are essential to delivering a modern EDW solution, most notably the ability to integrate across other Google Cloud Platform services, including its market leading AI-based solutions and services.
Although not called t out directly in the published report, ESG’s models indicate that the savings achieved by migrating an on-premises EDW solution to Google BigQuery may actually be more cost effective than simply continuing to operate an existing on-premises EDW solution.
BigQuery Explainable AI for Demystifying the Inner Workings of ML Models. Now GA!

6559
Of your peers have already read this article.
2:00 Minutes
The most insightful time you'll spend today!
Explainable AI (XAI) helps you understand and interpret how your machine learning models make decisions. We’re excited to announce that BigQuery Explainable AI is now generally available (GA). BigQuery is the data warehouse that supports explainable AI in a most comprehensive way w.r.t both XAI methodology and model types. It does this at BigQuery scale, enabling millions of explanations within seconds with a single SQL query.
Why is Explainable AI so important? To demystify the inner workings of machine learning models, Explainable AI is quickly becoming an essential and growing need for businesses as they continue to invest in AI and ML. With 76% of enterprises now prioritizing artificial intelligence (AI) and machine learning (ML) over other initiatives in 2021 IT budgets, the majority of CEOs (82%) believe that AI-based decisions must be explainable to be trusted according to a PwC survey.
While the focus of this blogpost is on BigQuery Explainable AI, Google Cloud provides a variety of tools and frameworks to help you interpret models outside of BigQuery, such as with Vertex Explainable AI, which includes AutoML Tables, AutoML Vision, and custom-trained models.
So how does Explainable AI in BigQuery work exactly? And how might you use it in practice?
Two types of Explainable AI: global and local explainability
When it comes to Explainable AI, the first thing to note is that there are two main types of explainability as they relate to the features used to train the ML model: global explainability and local explainability.
Imagine that you have a ML model that predicts housing price (as a dollar amount), based on three features: (1) number of bedrooms, (2) distance to the nearest city center, and (3) construction date.
Global explainability (a.k.a. global feature importance) describes the features’ overall influence on the model and helps you understand if a feature had a greater influence than other features over the model’s predictions. For example, global explainability can reveal that the number of bedrooms and distance to city center typically has a much stronger influence than the construction date on predicting housing prices. Global explainability is especially useful if you have hundreds or thousands of features and you want to determine which features are the most important contributors to your model. You may also consider using global explainability as a way to identify and prune less important features to improve the generalizability of their models.
Local explainability (a.k.a. feature attributions) describes the breakdown of how each feature contributes towards a specific prediction. For example, if the model predicts that house ID#1001 has a predicted price of $230,000, local explainability would describe a baseline amount (e.g. $50,000) and how each of the features contributes on top of the baseline towards the predicted price. For example, the model may say that on top of the baseline of $50,000, having 3 bedrooms contributed an additional $50,000, close proximity to the city center added $100,000, and construction date of 2010 added $30,000, for a total predicted price of $230,000. In essence, understanding the exact contribution of each feature used by the model to make each prediction is the main purpose of local explainability.
What ML models does BigQuery Explainable AI apply to?
BigQuery Explainable AI applies to a variety of models, including supervised learning models for IID data and time series models. The documentation for BigQuery Explainable AI provides an overview of the different ways of applying explainability per model. Note that each explainability method has its own way of calculation (e.g. Shapley values), which are covered more in-depth in the documentation.

Examples with BigQuery Explainable AI
In this next section, we will show three examples of how to use BigQuery Explainable AI in different ML applications:
Regression models with BigQuery Explainable AI
Let’s use a boosted tree regression model to predict how much a taxi cab driver will receive in tips for a taxi ride, based on features such as number of passengers, payment type, total payment and trip distance. Then let’s use BigQuery Explainable AI to help us understand how the model made the predictions in terms of global explainability (which features were most important?) and local explainability (how did the model arrive at each prediction?).
The taxi trips dataset comes from the BigQuery public datasets and is publicly available in the table: bigquery-public-data.new_york_taxi_trips.tlc_yellow_trips_2018.
First, you can train a boosted tree regression model.
CREATE OR REPLACE MODEL bqml_tutorial.taxi_tip_regression_modelOPTIONS (model_type='boosted_tree_regressor',input_label_cols=['tip_amount'],max_iterations = 50,tree_method = 'HIST',subsample = 0.85,enable_global_explain = TRUE) ASSELECTvendor_id,passenger_count,trip_distance,rate_code,payment_type,total_amount,tip_amountFROM`bigquery-public-data.new_york_taxi_trips.tlc_yellow_trips_2018`WHERE tip_amount >= 0LIMIT 1000000
Now let’s do a prediction using ML.PREDICT, which is the standard way in BigQuery ML to make predictions without explainability.
SELECT *FROMML.PREDICT(MODEL bqml_tutorial.taxi_tip_regression_model,(SELECT"0" AS vendor_id,1 AS passenger_count,CAST(5.85 AS NUMERIC) AS trip_distance,"0" AS rate_code,"0" AS payment_type,CAST(55.56 AS NUMERIC) AS total_amount))

But you might wonder—how did the model generate this prediction of ~11.077?
BigQuery Explainable AI can help us answer this question. Instead of using ML.PREDICT, you use ML.EXPLAIN_PREDICT with an additional optional parameter top_k_features. ML.EXPLAIN_PREDICT extends the capabilities of ML.PREDICT by outputting several additional columns that explain how each feature contributes to the predicted value. In fact, since ML.EXPLAIN_PREDICT includes all the output from ML.PREDICT anyway, you may want to consider using ML.EXPLAIN_PREDICT every time instead.
SELECT *FROMML.EXPLAIN_PREDICT(MODEL bqml_tutorial.taxi_tip_regression_model,(SELECT"0" AS vendor_id,1 AS passenger_count,CAST(5.85 AS NUMERIC) AS trip_distance,"0" AS rate_code,"0" AS payment_type,CAST(55.56 AS NUMERIC) AS total_amount),STRUCT(6 AS top_k_features))

The way to interpret these columns is:
Σfeature_attributions + baseline_prediction_value = prediction_value
Let’s break this down. The prediction_value is ~11.077, which is simply the predicted_tip_amount. The baseline_prediction_value is ~6.184, which is the tip amount for an average instance. top_feature_attributions indicates how much each of the features contributes towards the prediction value. For example, total_amount contributes ~2.540 to the predicted_tip_amount.
ML.EXPLAIN_PREDICT provides local feature explainability for regression models. For global feature importance, see the documentation for ML.GLOBAL_EXPLAIN.
Classification models with BigQuery Explainable AI
Let’s use a logistic regression model to show you an example of BigQuery Explainable AI with classification models. We can use the same public dataset as before: bigquery-public-data.new_york_taxi_trips.tlc_yellow_trips_2018.
Train a logistic regression model to predict the bracket of the percentage of the tip amount out of the taxi bill.
CREATE OR REPLACE MODEL bqml_tutorial.taxi_tip_classification_modelOPTIONS(model_type='logistic_reg',input_label_cols=['tip_bucket'],enable_global_explain=true) ASSELECTvendor_id,passenger_count,trip_distance,rate_code,payment_type,total_amount,CASEWHEN tip_amount > total_amount*0.20 THEN '20% or more'WHEN tip_amount > total_amount*0.15 THEN '15% to 20%'WHEN tip_amount > total_amount*0.10 THEN '10% to 15%'ELSE '10% or less'END AS tip_bucketFROM`bigquery-public-data.new_york_taxi_trips.tlc_yellow_trips_2018`WHERE tip_amount >= 0LIMIT 1000000
Next, you can run ML.EXPLAIN_PREDICT to get both the classification results and the additional information for local feature explainability. For global explainability, you can use ML.GLOBAL_EXPLAIN. Again, since ML.EXPLAIN_PREDICT includes all the output from ML.PREDICT anyway, you may want to consider using ML.EXPLAIN_PREDICT every time instead.
SELECT *FROMML.EXPLAIN_PREDICT(MODEL bqml_tutorial.taxi_tip_classification_model,(SELECT"0" AS vendor_id,1 AS passenger_count,CAST(5.85 AS NUMERIC) AS trip_distance,"0" AS rate_code,"0" AS payment_type,CAST(55.56 AS NUMERIC) AS total_amount),STRUCT(6 AS top_k_features))

Similar to the regression example earlier, the formula is used to derive the prediction_value:
Σfeature_attributions + baseline_prediction_value = prediction_value
As you can see in the screenshot above, the baseline_prediction_value is ~0.296. total_amount is the most important feature in making this specific prediction, contributing ~0.067 to the prediction_value, though followed by trip_distance. The feature passenger_count contributes negatively to prediction_value by -0.0015. The features vendor_id, rate_code, and payment_type did not seem to contribute much to the prediction_value.
You may wonder why the prediction_value of ~0.389 doesn’t equal the probability value of ~0.359. The reason is that unlike for regression models, for classification models, prediction_value is not a probability score. Instead, prediction_value is the logit value (i.e., log-odds) for the predicted class, which you could separately convert to probabilities by applying the softmax transformation to the logit values. For example, a three-class classification has a log-odds output of [2.446, -2.021, -2.190]. After applying the softmax transformation, the probability of these class predictions is [0.9905, 0.0056, 0.0038].
Time-series forecasting models with BigQuery Explainable AI

Explainable AI for forecasting provides more interpretability into how the forecasting model came to its predictions. Let’s go through an example of forecasting the number of bike trips in NYC using the new_york.citibike_trips public data in BigQuery.
You can train a time-series model ARIMA_PLUS:
CREATE OR REPLACE MODEL bqml_tutorial.nyc_citibike_arima_modelOPTIONS(model_type = 'ARIMA_PLUS',time_series_timestamp_col = 'date',time_series_data_col = 'num_trips',holiday_region = 'US') ASSELECTEXTRACT(DATE from starttime) AS date,COUNT(*) AS num_tripsFROM`bigquery-public-data.new_york.citibike_trips`GROUP BY dateNext, you can first try forecasting without explainability using ML.FORECAST:SELECT*FROMML.FORECAST(MODEL bqml_tutorial.nyc_citibike_arima_model,STRUCT(365 AS horizon, 0.9 AS confidence_level))
This function outputs the forecasted values and the prediction interval. Plotting it in addition to the input time series gives the following figure.

But how does the forecasting model arrive at its predictions? Explainability is especially important if the model ever generates unexpected results.
With ML.EXPLAIN_FORECAST, BigQuery Explainable AI provides extra transparency into the seasonality, trend, holiday effects, level (step) changes, and spikes and dips outlier removal. In fact, since ML.EXPLAIN_FORECAST includes all the output from ML.FORECAST anyway, you may want to consider using ML.EXPLAIN_FORECAST every time instead.
SELECT*FROMML.EXPLAIN_FORECAST(MODEL bqml_tutorial.nyc_citibike_arima_model,STRUCT(365 AS horizon, 0.9 AS confidence_level))

Compared to the previous figure which only shows the forecasting results, this figure shows much richer information to explain how the forecast is made.
First, it shows how the input time series is adjusted by removing the spikes and dips anomalies, and by compensating the level changes. That is:
time_series_adjusted_data = time_series_data - spikes_and_dips - step_changes
Second, it shows how the adjusted input time series is decomposed into different components such as both weekly and yearly seasonal components, holiday effect component and trend component. That is
time_series_adjusted_data = trend + seasonal_period_yearly + seasonal_period_weekly + holiday_effect + residual
Finally, it shows how these components are forecasted separately to compose the final forecasting results. That is:
time_series_data = trend + seasonal_period_yearly + seasonal_period_weekly + holiday_effect
For more information on these time series components, please see the documentation here.
Conclusion
With the GA of BigQuery Explainable AI, we hope you will now be able to interpret your machine learning models with ease.
Thanks to the BigQuery ML team, especially Lisa Yin, Jiashang Liu, Amir Hormati, Mingge Deng, Jerry Ye and Abhinav Khushraj. Also thanks to the Vertex Explainable AI team, especially David Pitman and Besim Avci.
2803
Of your peers have already watched this video.
41:30 Minutes
The most insightful time you'll spend today!
Real-world Data Integration Patterns
Learn the basics of Google Cloud Data Integration. How do you go from basic, hardcoded data pipelines to making your solution is dynamic and reusable? How do you parameterize your pipelines? What is the difference between parameters and variables, and when should you use them?
Nidhi Modh, Product Manager, Google Cloud, answers all these questions and more. He contrasts practices with traditional views of data integration, the benefits and the challenges.
Explore some common design patterns for moving and orchestrating data, including incremental and metadata-driven pipelines. Discover best practices and lessons learned and highlight common data engineering best practices for building scalable and high-performing data integration solutions.
More Relevant Stories for Your Company

Delivering analysis-ready financial data at scale
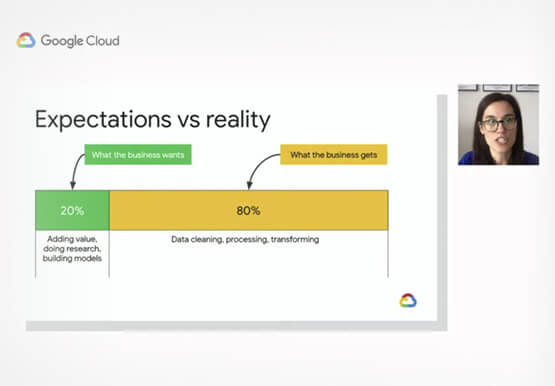
Refinitiv, is a leading provider of financial market data. It serves over 40,000 institutions and operates in 190 countries. “We're constantly looking at solving some of the most difficult problems our users face when accessing new data sets as well as onboarding new sources that will be relevant for workflows

AirAsia Turns to Google Cloud to refine Pricing, Increase Revenue, and Improve Customer Experience
AirAsia needed a platform incorporating products that could capture, process, analyze, and report on data, while delivering value for money and meeting its speed and availability requirements. The airline also wanted to minimise infrastructure management and system administration demands on its technology team members. The airline conducted a proof of
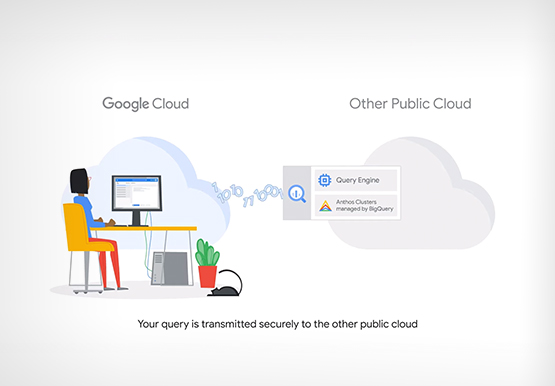
Analytics in a Multi-Cloud World with BigQuery Omni
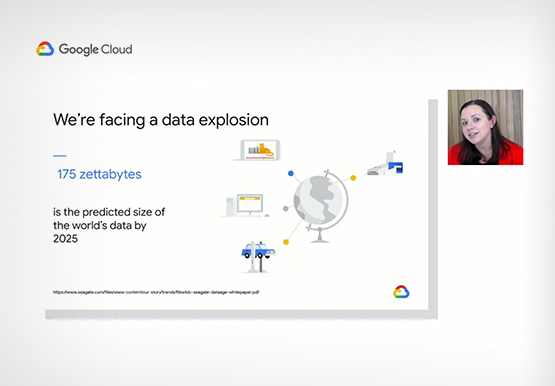
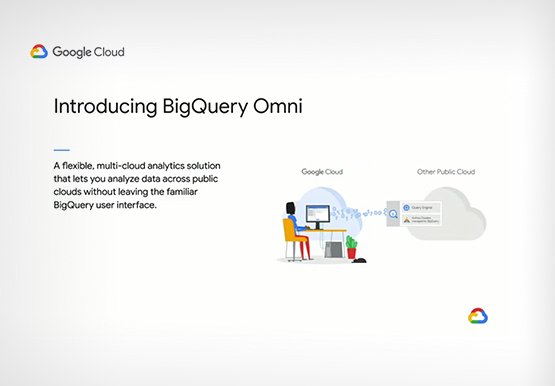
Enterprises have more data at hand than they have ever had in the past. But are unable to leverage it fully. “We have all of this data at our fingertips. But we just can't quite get to it because we're living in this world of data silos,” says Emily Rapp,

Bit Capital Rolls Out a Digital Financial Solution in Under 3 Months and at 2/3 the Cost
In the past few years, a series of new technologies and regulatory changes has been transforming Brazil’s financial industry. The concept of blockchain added security and agility to financial transactions. The open banking system being deployed by the country’s Central Bank (BC) allows for platform integration and data sharing -with
