





4654
Of your peers have already watched this video.
3:00 Minutes
The most insightful time you'll spend today!
The Simple Salesforce Extension on Gmail That Can Make Sales and Marketing More Productive
What’s one of the big problems of sales and marketing? The inability to get a more holistic picture of a customer when reaching out to them.
There’s a fix for that if you’re using Gmail.
It’s a Salesforce Lightning Chrome extension. As you read and respond to emails in your inbox Salesforce Lightning for Gmail will surface relevant customer information from your CRM directly to you within the Gmail interface.
This will not only save you time by reducing how often you’re toggling between tools, but it’ll also ensure that you have the most current customer information at hand at all times.
With Salesforce Lightning for Gmail you’ll be able to see opportunities, cases, leads and other Salesforce records the contact has with your organisation enabling you to better craft your email response to match your customer’s specific situation.
Find out how else Salesforce Lightning for Gmail can make you smarter, faster and more accurate. Watch this short video now.
5345
Of your peers have already watched this video.
31:30 Minutes
The most insightful time you'll spend today!
Enhancing Collaboration with Sheets, Python, and Google Cloud
See how you can enhance collaboration within your organization using Google Sheets. Watch to learn about a new set of tools to create custom functions that tap into the power of Python and to expose functions in a standardized fashion throughout your organization.
How to Use Data to Tell Compelling Stories and Win New Deals

4512
Of your peers have already read this article.
2:30 Minutes
The most insightful time you'll spend today!
A picture is worth a thousand words–especially at work. The data we present every day is what helps us drive decision-making in the workplace. But understanding how to visualize a story can be difficult if you’re left staring at numbers sitting stagnant in rows or columns within a spreadsheet.
This is where visualization with charts and reports becomes critical. Let’s say your team needs to understand global sales trends. If you have a waterfall chart that shows regional contribution to total revenue or a scatter plot that shows individual salesperson performance, it’s much easier to spot patterns, draw insights, and make informed recommendations. The same goes for analyzing travel expenses.
In Google Sheets, we have several built-in tools that make it easy to create and share useful charts and reports so that you can quickly visualize data (without having to leave the spreadsheet). Follow these tips to showcase your data in Sheets and influence decisions.
1. Pick the most compelling way to visualize your data.
Perhaps just as important as the data you reference is the way in which you present it. Charts are the basic building blocks for data visualization and can take many forms–from bar charts to line graphs to scatter plots. There are more than 30 chart types to choose from in Sheets, and we’re constantly adding more ways to express your data. Here are a few we recommend:
- To draw attention to a key metric or KPI, try the brand new scorecard chart. For example, you can show the total sales number for your organization’s top-selling product, and even call out percentage increase or decrease over time.
- To illustrate how values add to or subtract from a starting value, try a waterfall chart. For example, show how your product sales and restocking efforts led to a net decrease in inventory from last quarter to this quarter.
- To represent different data series using lines and bars, try a combo chart. For example, you can show revenue in bars and profit margins in a line across the same chart, giving you a more complete picture of your organization’s financial health.
If you’re unsure how to best present your data, Google’s built-in machine learning can help you choose the right visualization—Sheets intelligently suggests charts for you. Simply highlight data you would like to visualize, click the chart button, and then select one of the suggested charts. According to our internal data, more than 1.5 million charts are inserted into Sheets each week based on intelligent recommendations.
Note: Once you have a chart inserted into Sheets, you may want to control the look and feel. We recently made it possible to click directly on data labels, chart titles, or legends and drag to reposition them. You can also easily delete these elements using the delete or backspace keys, if you want to make other data points stand out. We’re exploring even more ways to customize charts—stay tuned.
2. Be sure to tell a complete story.
Data really comes to life when you put several charts and tables together into a report or dashboard. Going back to our sales data example, an individual line graph showing revenue over time gives you quick insight into the general sales trend for your organization (hopefully, up and to the right!). But when you surround that line graph with other charts and tables–like a pie chart showing total revenue breakdown by-product, or a stacked bar chart comparing revenue driven by each sales team–you can tell a more complete story.
If you do build reports featuring multiple charts, there are ways that Sheets can help you organize and format them more quickly. Earlier this year, we made it easier to align, size, and position objects within your spreadsheets so you can quickly put several charts together. We also recently added themes, which let you alter the look and feel of an entire spreadsheet—including charts, pivot tables, and cells—to ensure a consistent look and feel across the elements in your report. To apply a preset theme, select Format > Theme and choose the right option. Faster formatting can mean faster reporting.

The Tech Behind Goibibo’s Amazing Collaboration Tool That Employees Love
DOWNLOAD CASE STUDY4423
Of your peers have already downloaded this article
5:30 Minutes
The most insightful time you'll spend today!
Founded in 2007 and entering the travel market in 2009, Goibibo has grown to support 21 million users, 98% of whom are based in India. “We
Goibibo started with two engineers and three business managers—a workforce that has grown to 200 engineers and about 300 business managers, including a large business development team. “Our business development managers are integral to our growth, as they help build relationships with partners such as hotels,”Sahni says
Goibibo prides itself on a culture of fast-paced development and innovation. However, it had initially elected to run traditional workforce productivity applications on in-house servers. These applications forced team members who needed input into proposals, presentations, spreadsheets, and other business documents to send out drafts, and then aggregate and consolidate feedback from multiple sources.
This process was not just time-consuming, but vulnerable to version control problems as several versions of the same document could be in circulation throughout the business.
Furthermore, Goibibo had to expend considerable time and resources maintaining and upgrading hardware, software, and associated facilities. This ate into the technology team’s ability to improve the features and functionality of the company’s websites and applications.

The Secret Behind How ATB Reduced Strategic Planning Time by 50 Percent
DOWNLOAD CASE STUDY4789
Of your peers have already downloaded this article
8:30 Minutes
The most insightful time you'll spend today!
ATB Financial (ATB) operates in a highly competitive financial services space, with competitors ranging from big banks to financial technology startups, ready to grab a slice of the provincial market share. To retain its competitive advantage in an industry primed for disruption, ATB took an active role in its evolution by intentionally transforming the way banking products and services could be delivered. Through this bold transformation, paired with customer-obsession, ATB is primed to make good on its commitment to deliver happiness to its customers by being more than a bank.
To address its goals, ATB launched a new initiative called “Work Reimagined” powered by G Suite, with the aim of helping employees save time, make decisions faster, and spend more time with customers to drive happiness. However, to succeed, ATB needed to equip its distributed, mobile workforce with modern productivity tools that would simplify employee communication and collaboration.
Remote employees often experienced connectivity and performance challenges with the corporate VPN, limiting their productivity. At the same time, legacy office tools did not foster innovation and often slowed business processes, delaying the company’s ability to deliver new services and respond to customer needs.
“We wanted productivity tools that would allow us to make time richer for team members in support of our customers and achieve 10x improvements rather than small gains. We chose G Suite because it enables employees to think and work differently,” says Lorne Rubis, Chief Evangelist, ATB Financial.
Held Back by Database Scalability, This Financial Services Company Switches to Google Cloud and Cloud Spanner

11609
Of your peers have already read this article.
4:30 Minutes
The most insightful time you'll spend today!
Azimut Group operates an international network of companies handling investment and asset management, mutual funds, hedge funds, and insurance. Founded in Milan, Italy in 1988, Azimut Group today has branches in fifteen countries, including Brazil, China, and the USA.
“We have subsidiaries and manage funds all over the world,” explains Simone Bertolotti, IT Manager at Azimut Holding S.p.a. “That means that any technology that we put in place has to cover needs from many different countries.”
“When complicated analysis has to be executed, we have to increase our table space in a couple of minutes so that the AI can drill down into the data and deliver the information we need.”
—Simone Bertolotti, IT Manager, Azimut Holding S.p.a.
Azimut manages its funds with investment advisors who use information sourced from Bloomberg, Reuters and others. “They use a huge amount of data,” says Simone. “They work with spreadsheets, algorithms, formulae and they analyse data in minutes.” In finance, every second is crucial, which is why Azimut decided to develop a risk management dashboard that can process information even more quickly, then distribute it worldwide.
“When an advisor manages data, that data is used to make immediate decisions on funds, capital movements or whether to sell stock,” says Simone. “They have to be ready to make recommendations for any amount of data that comes to them. For our dashboard, that means that when additional information arrives or complicated analysis has to be executed, we have to increase our table space in a couple of minutes so that the AI can drill down into the data and deliver the information we need.”
Generating insights at speed
Investors and investment managers make decisions based on the most accurate, up-to-date information possible. For Azimut Group, information sourced through financial data vendors such as Bloomberg and Reuters provided only part of the data that the group required.
“We looked to collect information from a range of different providers,” explains Simone, “then analyse it to develop a predictive algorithm that could work faster than an advisor stationed at the terminal. We set ourselves the challenge to try to manipulate that data to add new insights into our matrix, so that every one of our branches across the world can see risk information about the funds in real-time.”
“We compared Google Cloud Platform’s performance with our previous cloud provider, and saw huge benefits of switching to Google. For me, the key performance issue is scaling. With Google Cloud Platform I know that I can increase and decrease my infrastructure quickly, when I need it.
—Simone Bertolotti, IT Manager, Azimut Holding S.p.a.
The first cloud provider Azimut used to build its system struggled to scale quickly to meet different kinds of data challenges. “If we wanted to add more cores, that was fine,” says Simone. “But the previous cloud provider made it complicated to raise the amount of space in a database infrastructure and scale up to demand. Scaling up for more in-depth analysis would take a day, and our need was immediate.”
That’s why Azimut switched one year ago to Google Cloud Platform to run the 150 VMs on its risk analysis platform. “We compared Google Cloud Platform’s performance with our previous cloud provider, and saw huge benefits of switching to Google. For me, the key performance issue is scaling,” says Simone. “With Google Cloud Platform I know that I can increase and decrease my infrastructure quickly, when I need it. Instead of waiting a day to scale up infrastructure, we can request and add space to our database in a couple of minutes.”
The infrastructure of Azimut’s solution handles around 800TB of data per month, and Google’s global network of servers and high-speed connections ensure that it gets to where it’s most needed by the most direct route. Impressed by the speed, security and availability of Google Cloud Platform, Azimut has moved its intranet on to Google Cloud Platform, too, eliminating the need for staff to login with VPNs.
“Instead of waiting a day to scale up infrastructure, we can request and add space to our database in a couple of minutes.”
—Simone Bertolotti, IT Manager, Azimut Holding S.p.a.
Driving ahead with Noovle
For Azimut, migrating the risk management dashboard is the latest of many Google product collaborations with cloud consultancy Noovle. “Everything started five years ago,” says Simone, “when Noovle assisted us in migrating to Gmail from our on-premise email solution. From G Suite to Google Cloud Platform, we’ve had a great relationship. Noovle provides consultancy services, support for mobility, and external advisors who work on our premises, such as when they trained us how to broadcast our meetings on Google Hangouts. As an independent company, we know we can trust them for transparent advice. All they care about is the best way to get a job done and to help us reach our goals.”
New app, new customers
In a business case comparison, Google Cloud Platform cost Azimut 35% less to run than the previous cloud provider. Now the group is building a major new mobile application on Google App Engine to be released in 2018.
“The new mobile application will allow customers to trade directly, without human advisors, by proposing different investment solutions depending on targets the customers set,” says Simone. “So if a customer aims to make money with investments, they enter their relevant personal information and we carry out the necessary regulatory checks and suggest what they could buy. The entire project will be based on Google Cloud Platform, so customers can control their investments through the app while we manage the fund, using Google Cloud Spanner on the backend.”
More Relevant Stories for Your Company

Go Green with Google’s Latest Tool and Pick the Most Sustainable Cloud Region
As a Google Cloud customer, your carbon footprint is already carbon neutral: Google first achieved carbon neutrality in 2007, and has been purchasing enough solar and wind energy to match 100% of its global electricity consumption since 2017. Now, Google is targeting a new sustainability goal: operating on carbon-free energy (CFE) 24/7,

Building the future of work with Google Workspace
Since we launched Google Workspace last October, we’ve heard from many of our customers—from global enterprises to small businesses—about the new ways they’re connecting, creating, and collaborating, often across living rooms, time zones, and continents. This response propels us on our mission to build for the future with a solution


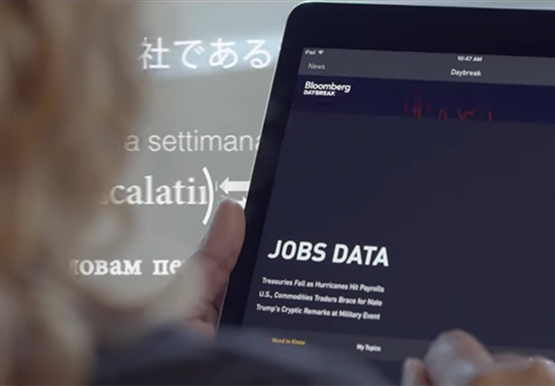

How Bloomberg uses Google Translate to Share Breaking News with the World
Bloomberg uses Google Translate to instantly share news with customers in more than 170 countries. Financial markets can move within seconds of a story breaking, so speed matters. With Google's automated translation Bloomberg can quickly disseminate breaking financial news to customers around the world in 40 different languages.

Latest Features and Updates to Globally Bolster Translation Services
Let’s face it: in the globalized world, which is now more than ever a digital demand world, you need to scale and reach your customers right where they’re at. Translation is a critical piece of that, whether you’re translating a website in multiple languages or releasing a document, a piece
