





6208
Of your peers have already watched this video.
13:00 Minutes
The most insightful time you'll spend today!
Google Cloud’s 2021 Data Analytics Launches
Google Cloud announced closed to 15 services and programs spanning database, analytics, business intelligence and AI to help businesses gain value out of their data. Here’s a rundown of announcements throughout 2021 on analytics solutions and services such as Dataplex, an intelligent data fabric solution, Datastream, a serverless change data capture and replication service and Google Cloud analytics hub. Watch the video to get started with Google Cloud’s Data Analytics offerings.
Principles to Make Organizations Data Engineering Driven

4849
Of your peers have already read this article.
4:00 Minutes
The most insightful time you'll spend today!
In the “What type of data processing organisation” paper, we examined that you can build a data culture whether your organization consists mostly of data analysts, or data engineers, or data scientists. However, the path and technologies to become a data-driven innovator are different and success comes from implementing the right tech in a way that matches a company’s culture. In this blog we will expand the data engineering driven organizations and provide how it can be built from the first principles.
Not all organizations are alike. All companies have similar functions (sales, engineering, marketing), but not all functions have the same influence on the overall business decisions. Some companies are more engineering-driven, others are sales-driven, others are marketing-driven. In practice, all companies are a mixture of all these functions. In the same way, the data strategy can be more focused on data analysts, and others on data engineering. Culture is a combination of several factors, business requirements, organizational culture, and skills within the organization.
Traditionally organizations that focused on engineering mainly came from technology driven digital backgrounds. They built their own frameworks or used programming frameworks to build repeatable data pipelines. Some of this is due to the way the data is received, the shape the data is received and the speed of the data arrival as well. If your data allows it, your organization can be more focused on data analysis, and not so much on data engineering. If you can apply an Extract-Load-Transform approach (ELT) rather than the classic Extract-Transform-Load (ETL), then you can focus on data analysis and might not need extensive data engineering capability. For example, data that can be loaded directly into the data warehouse allows data analysts to also do data engineering work and apply transformations to the data.
This does not happen so often though. Sometimes your data is messy, inconsistent, bulky, and encoded in legacy file formats or as part of legacy databases or systems, with a little potential to be actionable by data analysts.
Or maybe you need to process data in streaming, applying complex event processing to obtain competitive insights in near real time. The value of data decays exponentially with time. Most companies can process data by the next day in batch mode. However, not so many are probably obtaining such knowledge the next second data is produced.
In these situations, you need the talent to unveil the insights hidden in that amalgam of data, either messy or fast changing (or both!). And almost as importantly, you need the right tools and systems to enable that talent too.
What are those right tools? Cloud provides the scalability and flexibility for data workloads that are required in such complex situations. Long gone are the times when data teams had to beg for the resources that were required to have an impact in the business. Data processing systems are no longer scarce, so your data strategy should not generate that scarcity artificially.
In this article, we explain how to leverage Google Cloud to enable data teams to do complex processing of data, in batch and streaming. By doing so, your data engineering and science teams can have an impact when (in seconds) after the input data is generated.
Data engineering driven organizations
When the complexity of your data transformation needs is high, data engineers have a central role in the data strategy of your company, leading to data engineering driven organization. In this type of organization, data architectures are organized in three layers: business data owners, data engineers, and data consumers.
Data engineers are at the crossroads between data owners and data consumers, with clear responsibilities:
- Transporting data, enriching data whilst building integrations between analytical systems and operational systems ( as in the real time use cases)
- Parsing and transforming messy data coming from business units into meaningful and clean data, with documented metadata
- Applying DataOps, that is, functional knowledge of the business plus software engineering methodologies applied to the data lifecycle
- Deployment of models and other artifacts analyzing or consuming data
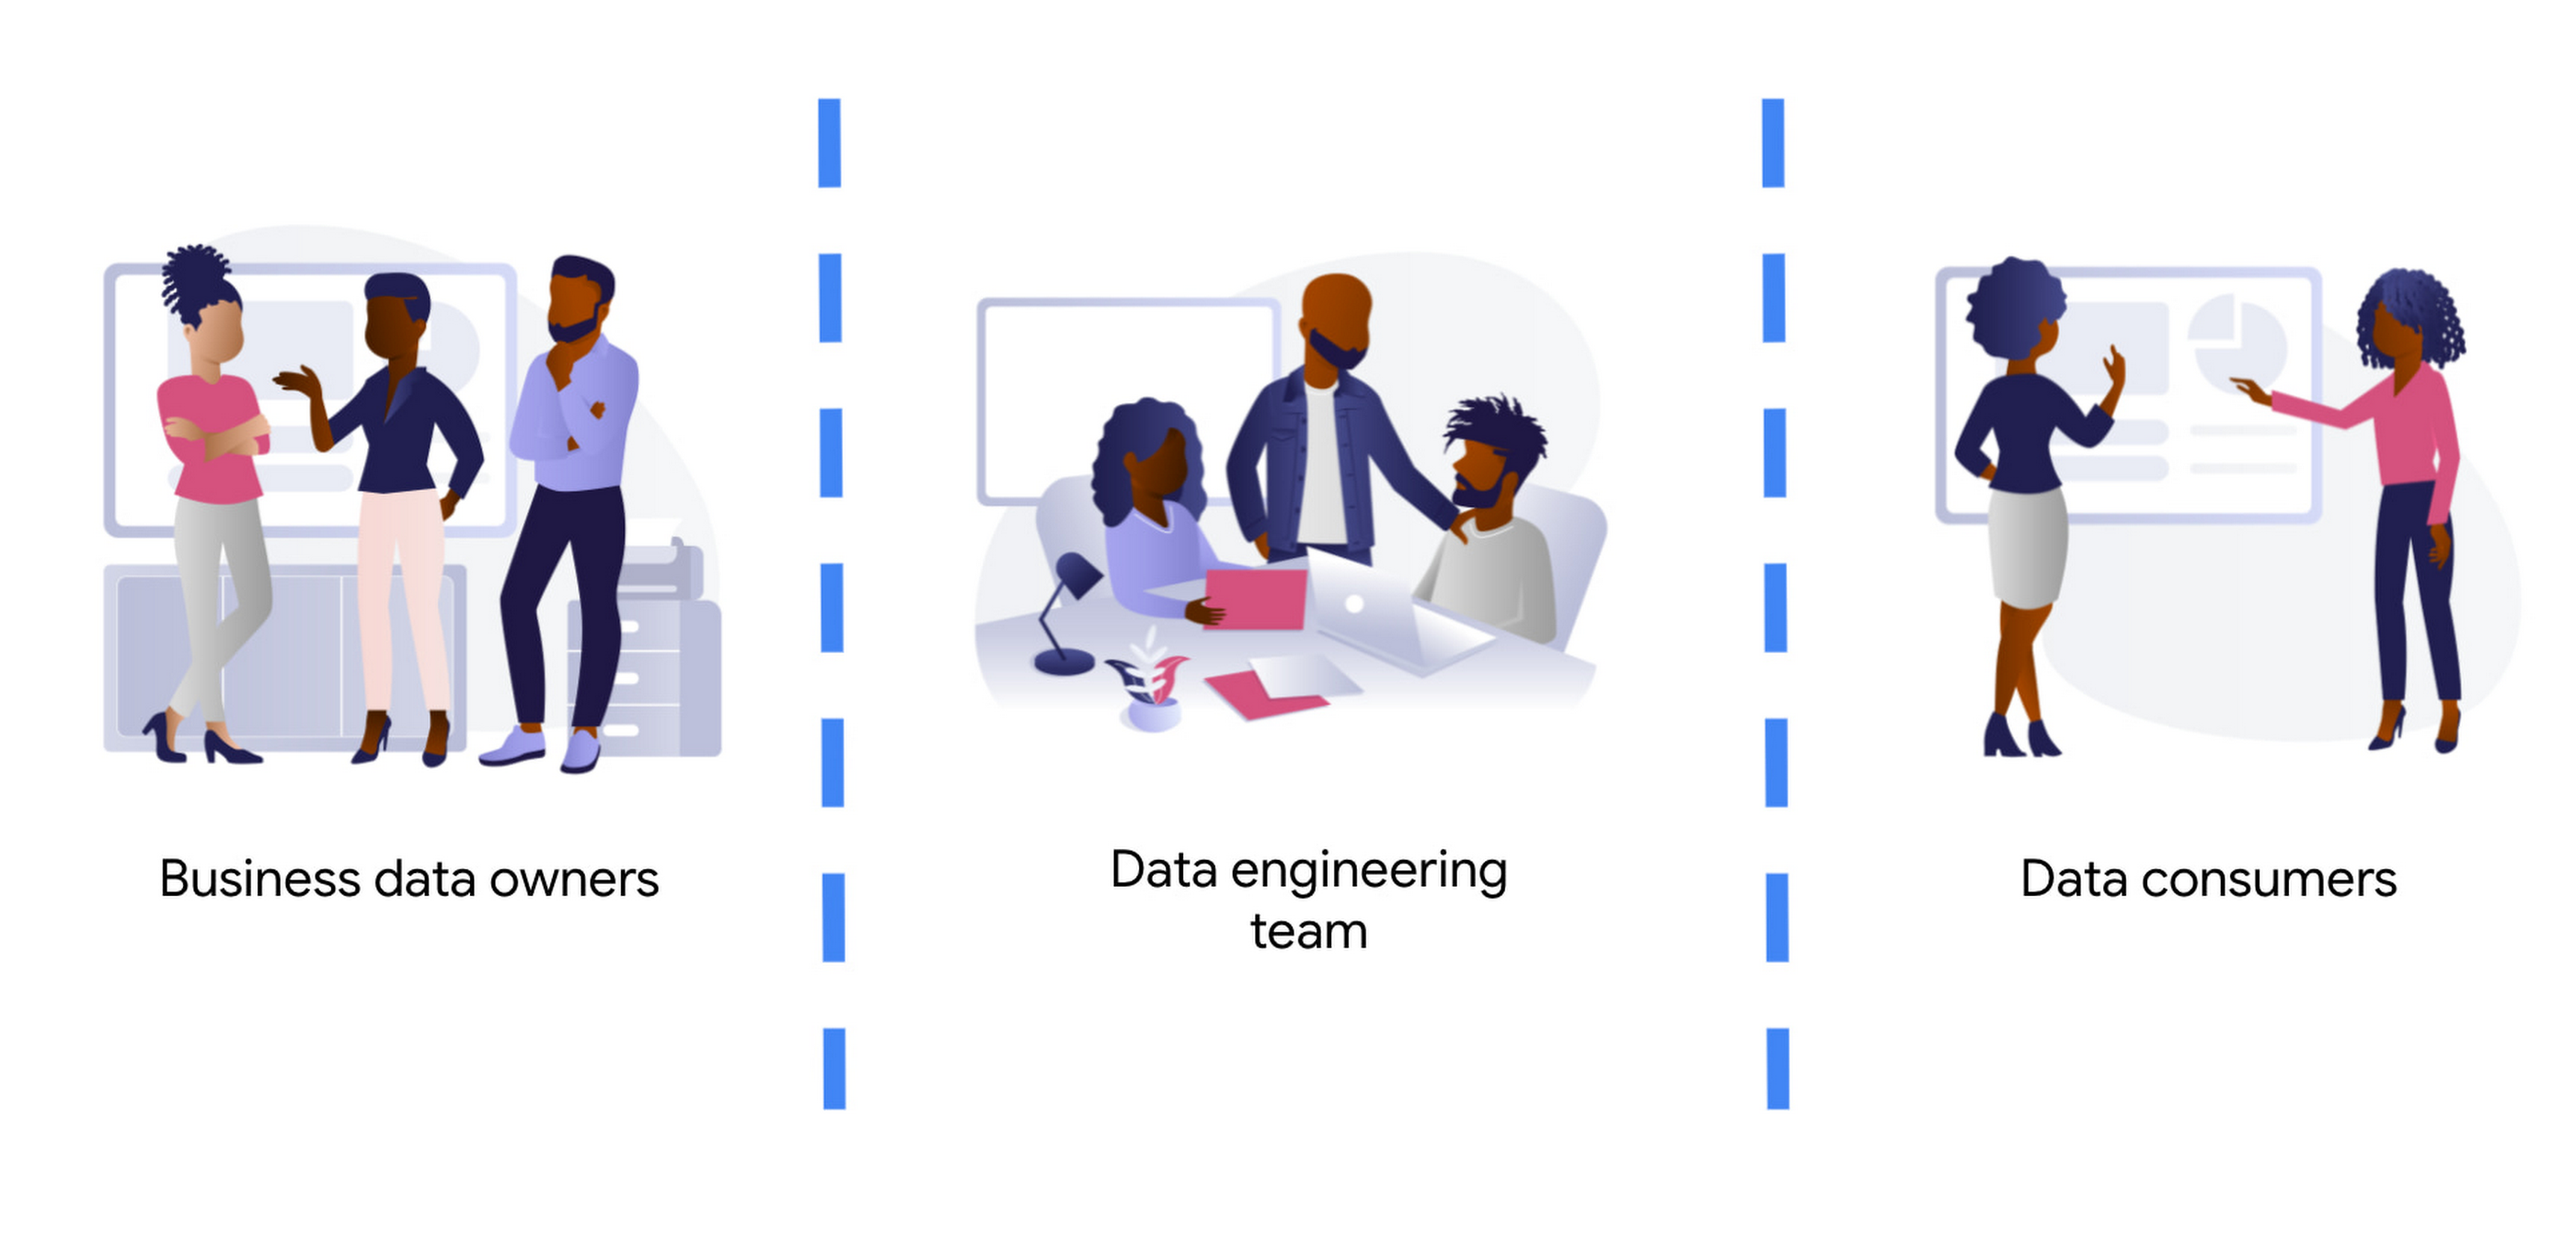
Business data owners are cross-functional domain-oriented teams. These teams know the business in detail, and are the source of data that feeds the data architecture. Sometimes these business units may also have some data-specific roles, such as data analysts, data engineers, or data scientists, to work as interfaces with the rest of the layers. For instance, these teams may design a business data owner, that is the point of contact of a business unit in everything that is related to the data produced by the unit.
At the other end of the architecture, we find the data consumers. Again, also cross-functional, but more focused on extracting insights from the different data available in the architecture. Here we typically find data science teams, data analysts, business intelligence teams, etc. These groups sometimes combine data from different business units, and produce artifacts (machine learning models, interactive dashboards, reports, and so on). For deployment, they require the help of the data engineering team so that data is consistent and trusted.
At the center of these crossroads, we find the data engineering team. Data engineers are responsible for making sure that the data generated and needed by different business units gets ingested into the architecture. This job requires two disparate skills: functional knowledge and data engineering/software development skills. This is often coined under the term DataOps (which evolved from DevOps methodologies developed within the past decades but applied to data engineering practices).
Data engineers have another responsibility too. They must help in the deployment of artifacts produced by the data consumers. Typically, the data consumers do not have the deep technical skills and knowledge to take the sole responsibility for deployment of their artifacts.This is also true for highly sophisticated data science teams. So data engineers must add other skills under their belt: machine learning and business intelligence platform knowledge. Let’s clarify this point, we don’t expect data engineers to become machine learning engineers. Data engineers need to understand ML to ensure that the data delivered to the first layer of a model ( the input ) is correct. They will also become key when delivering that first layer of data in the inference path, as here the data engineering skills around scale / HA etc really need to shine.
By taking the responsibility of parsing and transforming messy data from various business units, or for ingesting in real time, data engineers allow the data consumers to focus on creating value. Data science and other types of data consumers are abstracted away from data encodings, large files, legacy systems, complex message queue configurations for streaming. The benefits of concentrating that knowledge in a highly skilled data engineering team are clear, notwithstanding that other teams (business units and consumers) may also have their data engineers to work as interfaces with other teams. More recently, we even see squads created with members of the business units (data product owners), data engineers, data scientists, and other roles. Effectively creating complete teams with autonomy and full responsibility over a data stream, from the incoming data down to the data driven decision with impact in the business.
Reference architecture – Serverless
The number of skills required for the data engineering team is vast and diverse. We should not make it harder by expecting the team to maintain the infrastructure where they run data pipelines. They should be focusing on how to cleanse, transform, enrich, and prepare the data rather than how much memory or how many cores their solution may require.
The reference architectures presented here are based on the following principles:
- Serverless no-ops technologies
- Streaming-enabled for low time-to-insight
We present different alternatives, based on different products available in Google Cloud:
- Dataflow, the built-in streaming analytics platform in Google Cloud
- Dataproc, the Google Cloud’s managed platform for Hadoop and Spark.
- Data Fusion, a codeless environment for creating and running data pipelines
Let’s dig into these principles.
By using serverless technology we eliminate the maintenance burden from the data engineering team, and we provide the necessary flexibility and scalability for executing complex and/or large jobs. For example, scalability is essential when planning for traffic spikes during mega Friday for retailers. Using serverless solutions allows retailers to look into how they are performing during the day. They no longer need to worry about resources needed to process massive data generated during the day.
The team needs to have full control and write their own code for the data pipelines because of the type of pipelines that the team develops. This is true either for batch or streaming pipelines. In batch, the parsing requirements can be complex and no off the shelf solution works. In streaming, if the team wants to fully leverage the capabilities of the platform, they should implement all the complex business logic that is required, without artificially simplifying the complexity in exchange for some better latency. They can develop a pipeline that achieves a low latency with highly complex business logic. This again requires the team to start writing code from first principles.
However, that the team needs to write code should not imply that they need to rewrite any existing piece of code. For many input/output systems, we can probably reuse code from patterns, snippets, and similar examples. Moreover, a logical pipeline developed by a data engineering team does not necessarily need to map to a physical pipeline. Some parts of the logic can be easily reused by using technologies like Dataflow templates, and use those templates in orchestration with other custom developed pipelines. This brings the best of both worlds (reuse and rewrite), while saving precious time that can be dedicated to higher impact code rather than common I/O tasks. The reference architecture presented has another important feature: the possibility to transform existing batch pipelines to streaming.
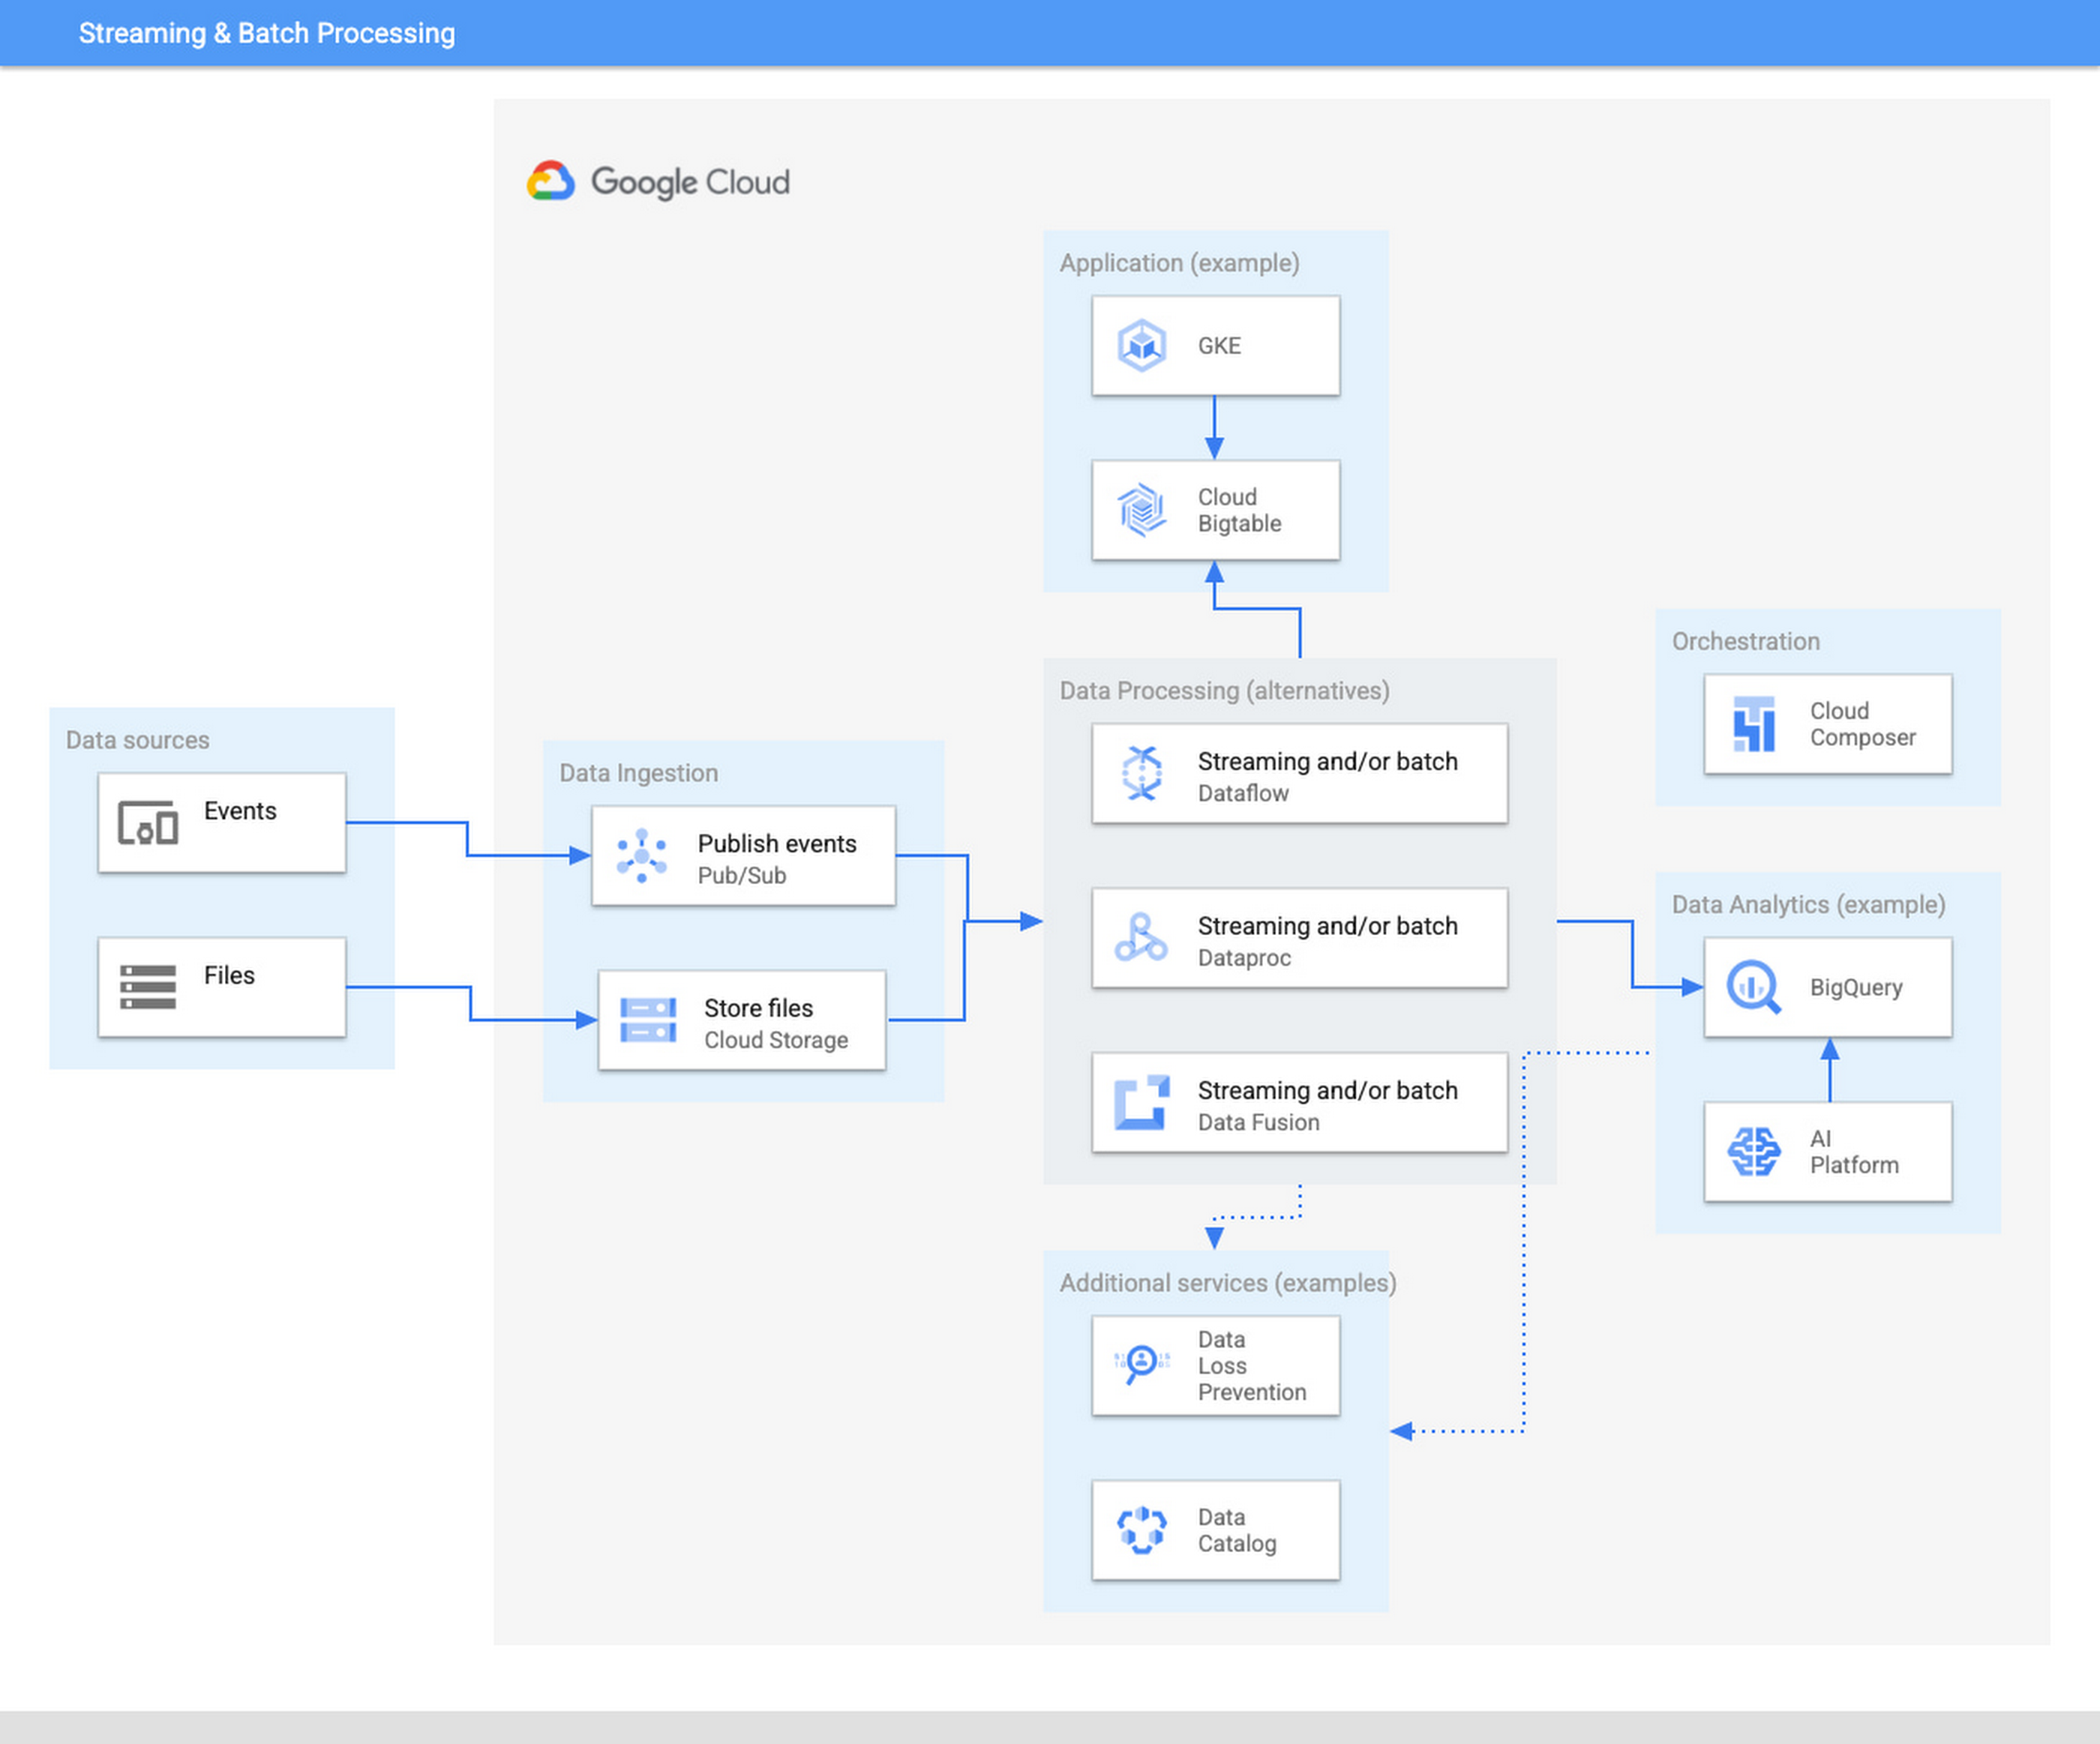
The ingestion layer consists of Pub/Sub for real time and Cloud Storage for batch and does not require any preallocated infrastructure. Both Pub/Sub and Cloud Storage can be used for a range of cases as it can automatically scale up with the input workload.
Once the data has been ingested, our proposed architecture follows the classical division in three stages: Extract, Transform, and Load (ETL). For some types of files, direct ingestion into BigQuery (following an ELT approach) is also possible.
In the transform layer, we primarily recommend Dataflow as the data process component. Dataflow uses Apache Beam as SDK. The main advantage of Apache Beam is the unified model for batch and streaming processing. As mentioned before, the same code can be adapted to run in batch or streaming by adapting input and output. For instance, switching the input from files in Cloud Storage to messages published in a topic in Pub/Sub.
One of the alternatives to Dataflow in this architecture is Dataproc, Google Cloud’s solution for managed Hadoop and Spark clusters. The main use case is for those teams that are migrating to Google Cloud but have large amounts of inherited code in Spark or Hadoop. Dataproc enables a direct path to the cloud, without having to review all those pipelines.
Finally, we also present the alternative of Data Fusion, a codeless environment for creating data pipelines using a drag-and-drop interface. Data Fusion actually uses Dataproc as its Compute Engine, so everything we have mentioned earlier applies also to the case of Data Fusion. If your team prefers to create data pipelines without having to write any code, Data Fusion is the right tool.
So in summary, these are the three recommended components for the transform layer:
- Dataflow, powerful and versatile with a unified model for batch and streaming processing. Straightforward path to move from batch processing to streaming
- Dataproc, for those teams that want to reuse existing code from Hadoop or Spark environments.
- Data Fusion, if your team does not want to write any code.
Challenges and opportunities
Data platforms are complex. Having on top of that data responsibility the duty to maintain infrastructure is a wasteful use of valuable skills and talent. Often data teams end up managing infrastructure rather than focusing on analyzing the data. The architecture presented in this article liberates the data engineering team from having to allocate infrastructure and tweak clusters but instead to focus on providing value through data processing pipelines.
For data engineers to focus on what they do best, you need to fully leverage the cloud. A lift & shift approach from any on-premise installation is not going to provide that flexibility and liberation. You need to leverage serverless technologies. As an added advantage, serverless lets you also scale your data processing capabilities with your needs, and be able to respond to peaks of activity, however large these are.
Serverless technologies sometimes face the doubts of practitioners: will I be locked in with my provider if I fully leverage serverless? This is actually a question that you should be asking when deciding whether to set up your architecture on top of a provider.
The components presented here for data processing are based on open source technologies, and fully interoperable with other open source equivalent components. Dataflow uses Apache Beam, which not only unifies batch and streaming, but also offers a widely compatible runner. You can take your code elsewhere to any other runner. For instance, Apache Flink or Apache Spark. Dataproc is a fully managed Hadoop and Spark based on the vanilla open source components of this ecosystem. Data Fusion is actually the Google Cloud version of CDAP, an open source project.
On the other hand, for the serving layer, BigQuery is based on standard Ansi SQL. Whereas in the case of Bigtable and Google Kubernetes Engine, Bigtable is compatible at API level with HBase, and Kubernetes is an open source component.
In summary, when your components are based on open source, like the ones included in this architecture, serverless does not lock you in. The skills required to encode business logic in the form of data processing pipelines are based on engineering principles that remain stable across time. The same principles apply if you are using Hadoop, Spark, or Dataflow or UI driven ETL tooling. In addition, there are now new capabilities, such as low-latency streaming, that were not available before. A team of data engineers that learn the fundamental principles of data engineering will be able to quickly leverage those additional capabilities.
Our recommended architecture separates the logical level, the code of your applications, from the infrastructure where they run. This enables data engineers to focus on what they do best and on where they provide the highest added value. Let your Dataflow and your engineers impact your business, by adopting the technologies that liberate them and allow them to focus on adding business value. To learn more about building an unified data analytics platform, take a look at our recently published Unified Data Analytics Platform paper and Converging Architectures paper.
How to Decide Whether to Run a Database on Kubernetes
5622
Of your peers have already read this article.
3:30 Minutes
The most insightful time you'll spend today!
Today, more and more applications are being deployed in containers on Kubernetes—so much so that we’ve heard Kubernetes called the Linux of the cloud.
Despite all that growth on the application layer, the data layer hasn’t gotten as much traction with containerization. That’s not surprising, since containerized workloads inherently have to be resilient to restarts, scale-out, virtualization, and other constraints. So handling things like state (the database), availability to other layers of the application, and redundancy for a database can have very specific requirements. That makes it challenging to run a database in a distributed environment.
However, the data layer is getting more attention, since many developers want to treat data infrastructure the same as application stacks.
Operators want to use the same tools for databases and applications, and get the same benefits as the application layer in the data layer: rapid spin-up and repeatability across environments. In this blog, we’ll explore when and what types of databases can be effectively run on Kubernetes.
Before we dive into the considerations for running a database on Kubernetes, let’s briefly review our options for running databases on Google Cloud Platform (GCP) and what they’re best used for.
- Fully managed databases. This includes Cloud Spanner, Cloud Bigtable and Cloud SQL, among others. This is the low-ops choice, since Google Cloud handles many of the maintenance tasks, like backups, patching and scaling. As a developer or operator, you don’t need to mess with them. You just create a database, build your app, and let Google Cloud scale it for you. This also means you might not have access to the exact version of a database, extension, or the exact flavor of database that you want.
- Do-it-yourself on a VM. This might best be described as the full-ops option, where you take full responsibility for building your database, scaling it, managing reliability, setting up backups, and more. All of that can be a lot of work, but you have all the features and database flavors at your disposal.
- Run it on Kubernetes. Running a database on Kubernetes is closer to the full-ops option, but you do get some benefits in terms of the automation Kubernetes provides to keep the database application running. That said, it is important to remember that pods (the database application containers) are transient, so the likelihood of database application restarts or failovers is higher. Also, some of the more database-specific administrative tasks—backups, scaling, tuning, etc.—are different due to the added abstractions that come with containerization.
Tips for running your database on Kubernetes
When choosing to go down the Kubernetes route, think about what database you will be running, and how well it will work given the trade-offs previously discussed.
Since pods are mortal, the likelihood of failover events is higher than a traditionally hosted or fully managed database. It will be easier to run a database on Kubernetes if it includes concepts like sharding, failover elections and replication built into its DNA (for example, ElasticSearch, Cassandra, or MongoDB). Some open source projects provide custom resources and operators to help with managing the database.
Next, consider the function that database is performing in the context of your application and business. Databases that are storing more transient and caching layers are better fits for Kubernetes. Data layers of that type typically have more resilience built into the applications, making for a better overall experience.
Finally, be sure you understand the replication modes available in the database. Asynchronous modes of replication leave room for data loss, because transactions might be committed to the primary database but not to the secondary database(s). So, be sure to understand whether you might incur data loss, and how much of that is acceptable in the context of your application.
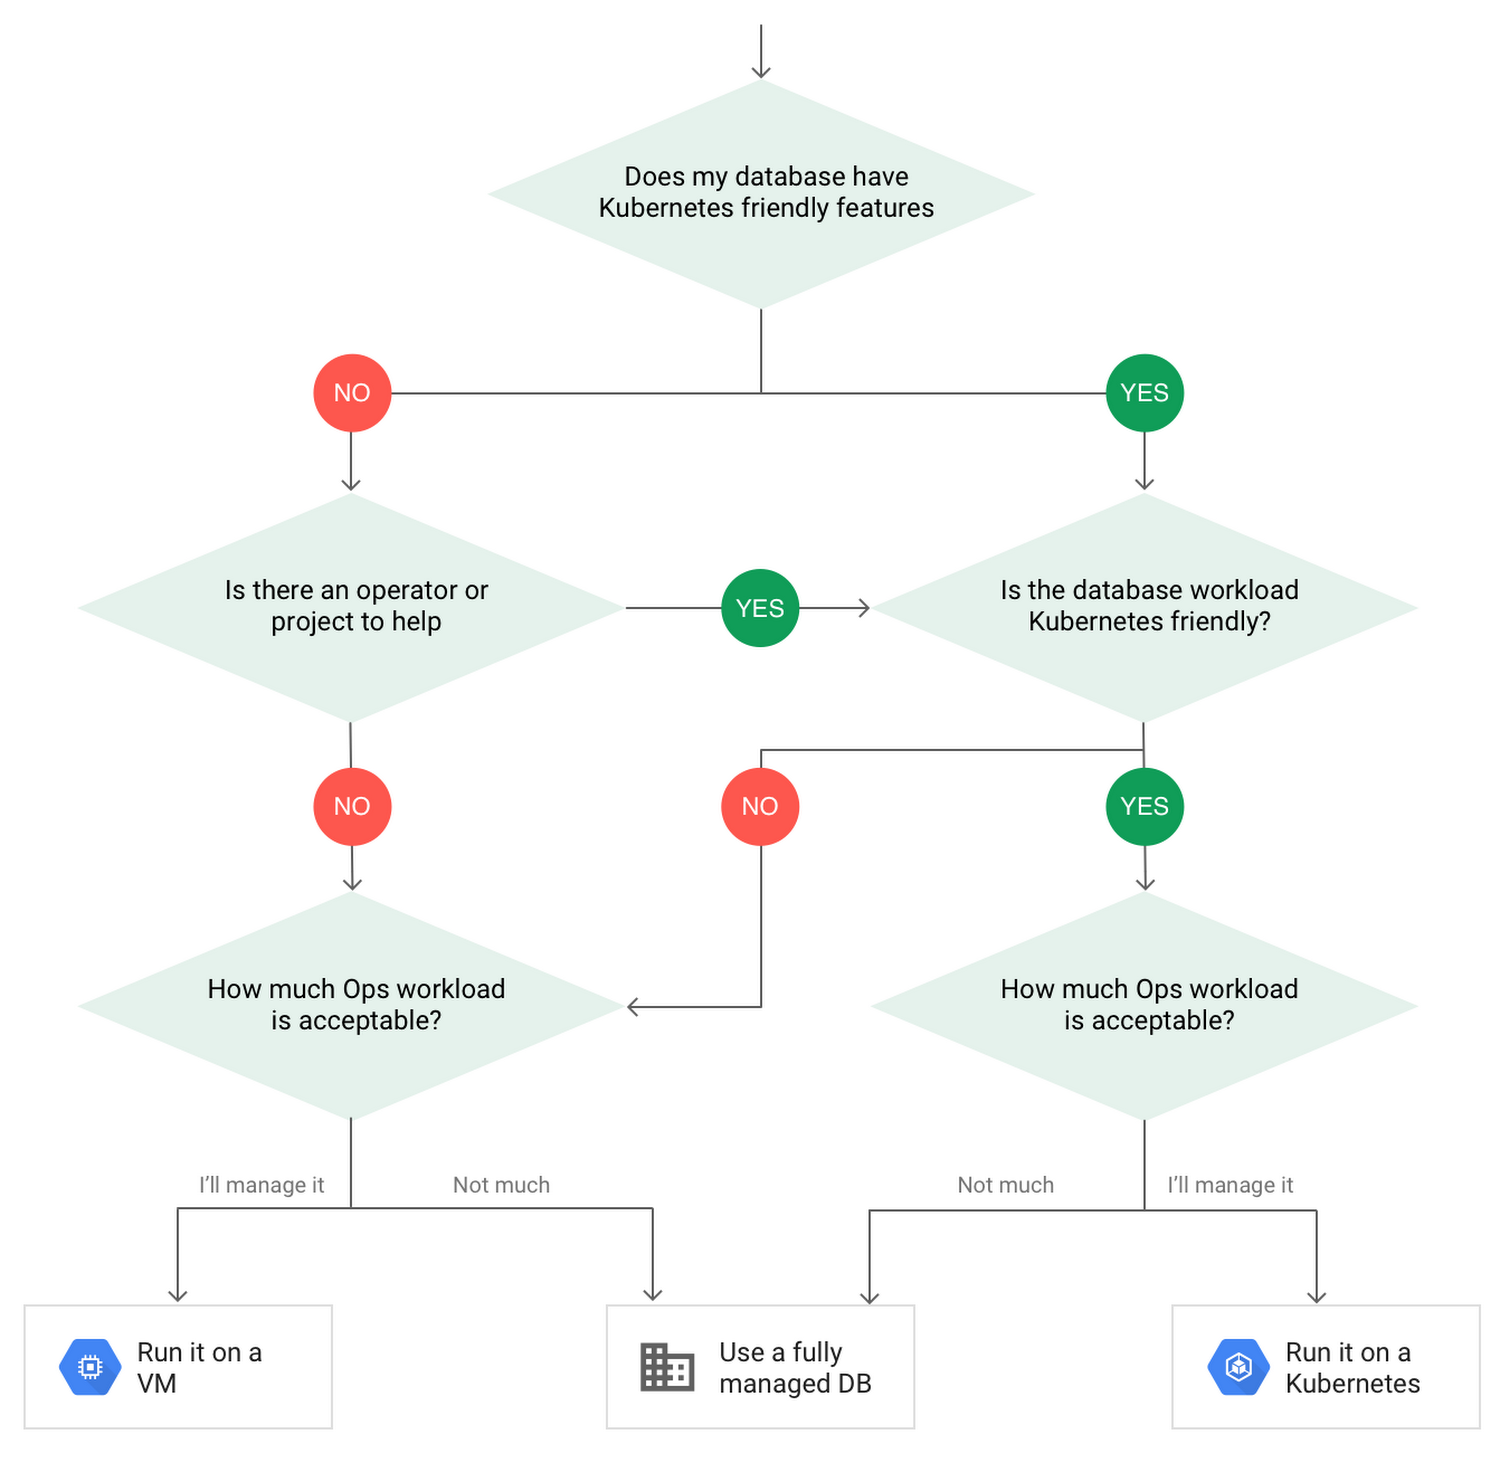
After evaluating all of those considerations, you’ll end up with a decision tree looking something like this:
How to deploy a database on Kubernetes
Now, let’s dive into more details on how to deploy a database on Kubernetes using StatefulSets.
With a StatefulSet, your data can be stored on persistent volumes, decoupling the database application from the persistent storage, so when a pod (such as the database application) is recreated, all the data is still there.
Additionally, when a pod is recreated in a StatefulSet, it keeps the same name, so you have a consistent endpoint to connect to. Persistent data and consistent naming are two of the largest benefits of StatefulSets. You can check out the Kubernetes documentation for more details.
If you need to run a database that doesn’t perfectly fit the model of a Kubernetes-friendly database (such as MySQL or PostgreSQL), consider using Kubernetes Operators or projects that wrap those database with additional features. Operators will help you spin up those databases and perform database maintenance tasks like backups and replication. For MySQL in particular, take a look at the Oracle MySQL Operator and Crunchy Data for PostgreSQL.
Operators use custom resources and controllers to expose application-specific operations through the Kubernetes API. For example, to perform a backup using Crunchy Data, simply execute pgo backup [cluster_name]. To add a Postgres replica, use pgo scale cluster [cluster_name].
There are some other projects out there that you might explore, such as Patroni for PostgreSQL. These projects use Operators, but go one step further. They’ve built many tools around their respective databases to aid their operation inside of Kubernetes. They may include additional features like sharding, leader election, and failover functionality needed to successfully deploy MySQL or PostgreSQL in Kubernetes.
While running a database in Kubernetes is gaining traction, it is still far from an exact science. There is a lot of work being done in this area, so keep an eye out as technologies and tools evolve toward making running databases in Kubernetes much more the norm.
When you’re ready to get started, check out GCP Marketplace for easy-to-deploy SaaS, VM, and containerized database solutions and operators that can be deployed to GCP or Kubernetes clusters anywhere.
Query Insights for Spanner: A blessing for developers and DBAs

3299
Of your peers have already read this article.
1:30 Minutes
The most insightful time you'll spend today!
Today, application development teams are more agile and are shipping features faster than ever before. In addition to these rapid development cycles and the rise of microservices architectures, the end-to-end ownership of feature development (and performance monitoring) has moved to a shared responsibility model between advanced database administrators and full-stack developers. However, most developers don’t have the years of experience or the time needed to debug complex query performance issues and database administrators are now a scarce resource in most organizations. As a result, there is a dire need for tools for developers and DBAs alike to quickly diagnose performance issues.
Introducing Query Insights for Spanner
We are delighted to announce the launch of Query Insights for Spanner, a set of visualization tools that provide an easy way for developers and database administrators to quickly diagnose query performance issues on Spanner. Using Query Insights, users can now troubleshoot query performance in a self-serve way. We’ve designed Query Insights using familiar design patterns with world-class visualizations to provide an intuitive experience for anyone who is debugging issues with query performance on Spanner. Query Insights is available at no additional cost.
By using out-of-the-box visual dashboards and graphs, developers can visualize aberrant behavior like peaks and troughs in various performance metrics over a time-series and quickly identify problematic queries. Time series data provides significant value to organizations because it enables them to analyze important real-time and historical metrics. Data is valuable only if it’s easy to comprehend;. that’s where being able to view intuitive dashboards becomes a force multiplier for organizations looking to expose their time series data across teams.
Follow a visual journey with pre-built dashboards
With Query Insights, developers can seamlessly move from detection of database performance issues to diagnosis of problematic queries using a single interface. Query Insights will help identify query performance issues easily with pre-built dashboards.
The user could do this by following a simple journey where they can quickly confirm, identify and analyze query performance issues. Let’s walk through an example scenario.
Understand database performance
This journey will start by the user setting up an alert on Google Cloud Monitoring for CPU utilization going above a certain threshold. The alert could be configured in a way that if this threshold is crossed, the user will be notified with an email alert, with a link to the “Monitoring” dashboard.
Once the user receives this alert, they would click on the link in the email, and navigate to the “Monitoring” dashboard. If they observe high CPU Utilization and high read latencies, the possible root cause could be expensive queries. A spike in CPU Utilization could be a strong signal that the system is using more compute than it usually would, due to an inefficient query.
The next step is to identify which query might be the problem, this is where Query Insights comes in. The user can get to this tool by clicking on Query Insights in the left navigation of your Spanner Instance. Here, they can drill down into the CPU usage by query and observe that for a specific database, CPU Utilization (attributed to all queries) is spiking for a particular time window. This confirms that the CPU utilization is due to inefficient queries.
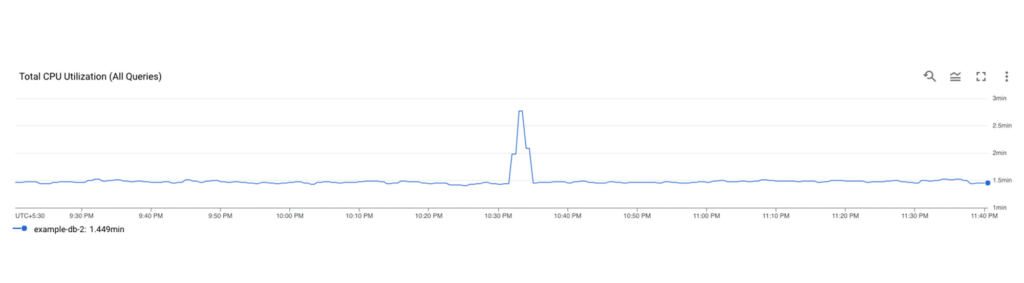
Identifying a problematic query
The user now observes the TopN (Top queries by CPU Utilization) query graph to see the TopN queries by CPU Utilization. From the graph, it is very easy to visualize and identify the top queries which could be causing the spike in CPU Utilization.
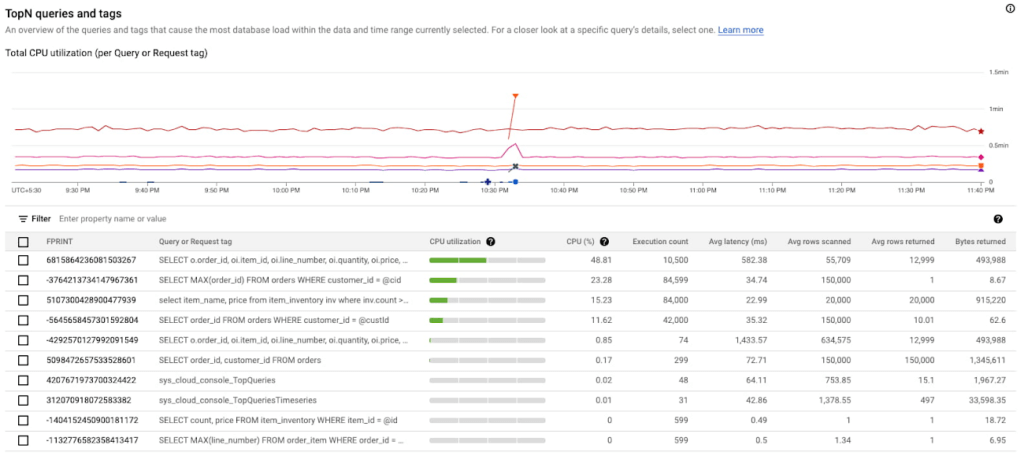
In the above screenshot, we can see that the first query in the table is showing a clear spike at 10:33 PM consuming 48.81% of total CPU. This is a clear indication that this query could be problematic, and the user should investigate further.
Analyzing the query performance
Once they have identified the problematic query, they can now drill down into this query shape to confirm, identify the root cause of the high CPU utilization.
They can do this by clicking on the Fingerprint ID for the specific query from the topN table, and navigating to the Query Details page where they will be able to see a list of metrics (Latency, CPU Utilization, Execution count, Rows Scanned / Rows Returned) over a time series for that specific query.
In this example, we notice that the average number of rows scanned for this specific query are very high (~ 600k rows scanned to return ~ 12k rows), which could point to a poor query design, resulting in an inefficient query. We can also observe that latency is high (1.4s) for this query.
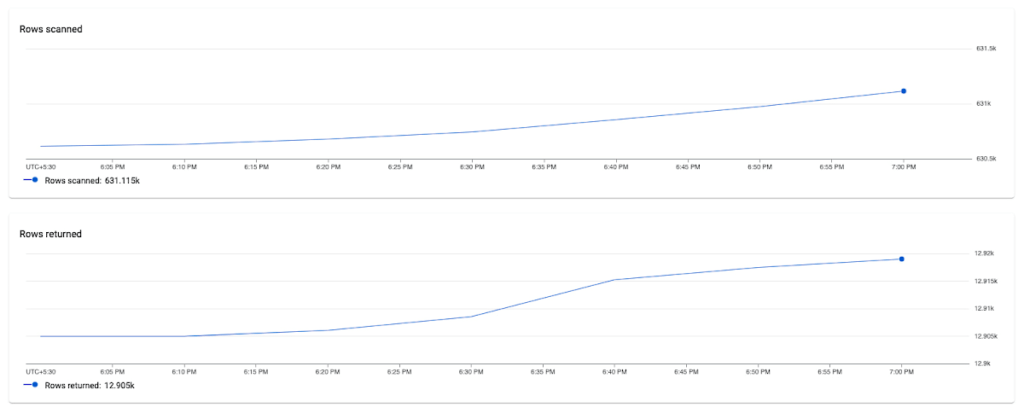
Fixing the issue
To fix the problem in this scenario, the user could optimize this query by specifying a secondary index in the query using a FORCE_INDEX query hint to provide an index directive. This would provide more consistent performance, make the query more efficient, and lower CPU utilization for this query.
In the screenshot below, you can see that after specifying the index in the query, the query performance dramatically increases in terms of CPU, rows scanned (54K vs 630k) and also in terms of query latency (536 ns vs 1.4 s).
Unoptimized Query:
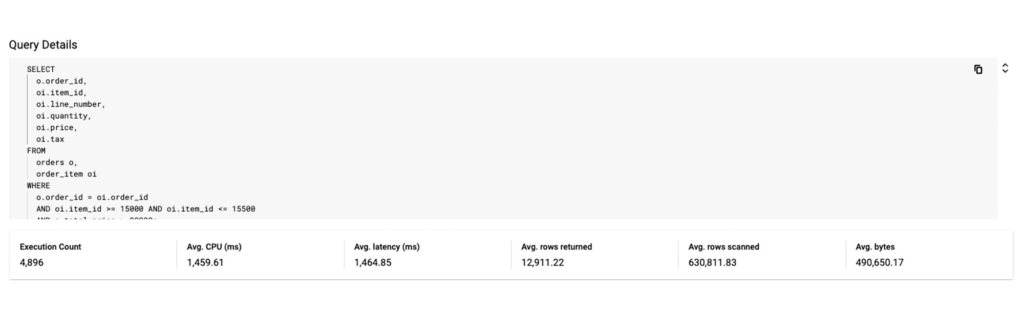
Optimized Query:
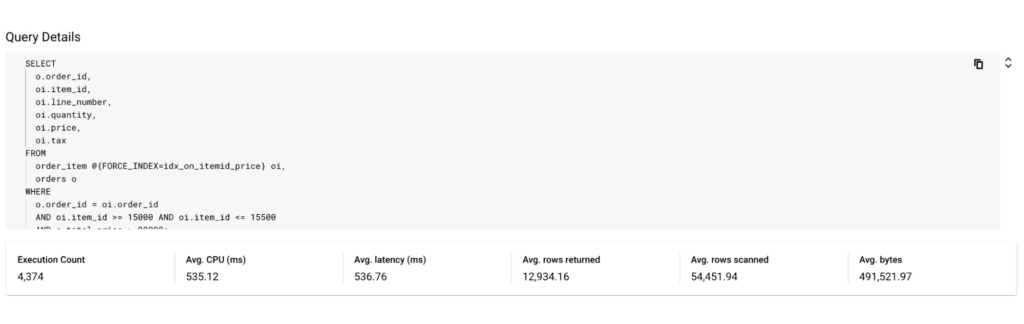
By following this simple visual journey, the user can easily detect, diagnose and debug inefficient queries on Spanner.
Get started with Query Insights today
To learn more about Query Insights, review the documentation here. Query Insights is enabled by default. In the Spanner console, you can click on Query Insights in the left navigation and start visualizing your query performance metrics!
New to Spanner? Get started in minutes with a new database.
Spot Slow MySQL Queries Fast with Stackdriver Monitoring

4038
Of your peers have already read this article.
4:30 Minutes
The most insightful time you'll spend today!
When you’re serving customers online, speed is essential for a good experience. As the amount of data in a database grows, queries that used to be fast can slow down.
For example, if a query has to scan every row because a table is missing an index, response times that were acceptable with a thousand rows can turn into multiple seconds of waiting once you have a million rows.
If this query is executed every time a user loads your web page, their browsing experience will slow to a crawl, causing user frustration. Slow queries can also impact automated jobs, causing them to time out before completion.
If there are too many of these slow queries executing at once, the database can even run out of connections, causing all new queries, slow or fast, to fail.
The popular open-source databases MySQL and Google Cloud Platform‘s fully managed version, Cloud SQL for MySQL, include a feature to log slow queries, letting you find the cause, then optimize for better performance.
However, developers and database administrators typically only access this slow query log reactively, after users have seen the effects and escalated the performance degradation.
With Stackdriver Logging and Monitoring, you can stay ahead of the curve for database performance with automatic alerts when query latency goes over the threshold, and a monitoring dashboard that lets you quickly pinpoint the specific queries causing the slowdown.
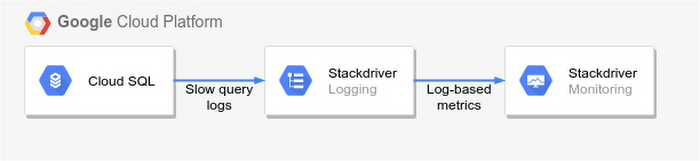
To get started, import MySQL’s slow query log into Stackdriver Logging.
Once the logs are in Stackdriver, it’s straightforward to set up logs-based metrics that can both count the number of slow queries over time, which is useful for setting up appropriate alerts, and also provide breakdowns by slow SQL statement, allowing speedy troubleshooting.
What’s more, this approach works equally well for managed databases in Cloud SQL for MySQL and for self-managed MySQL databases hosted on Compute Engine.
For a step-by-step tutorial to set up slow query monitoring, check out Monitoring slow queries in MySQL with Stackdriver. For more ideas about what else you can accomplish with Stackdriver Logging, check out Design patterns for exporting Stackdriver Logging.
Google Leads the Pack in Big Data NoSQL Market: Forrester Research
DOWNLOAD RESEARCH REPORTS4154
Of your peers have already downloaded this article
2:30 Minutes
The most insightful time you'll spend today!
NoSQL has become critical for all businesses to support modern business applications. It has gone from supporting simple schemaless apps to becoming a mission-critical data platform for large Fortune 1000 companies. It has already disrupted the database market, which was dominated for decades by relational database vendors.
Today, half of global data and analytics technology decision makers either have implemented or are implementing NoSQL platforms, taking advantage of the benefits of a flexible database that serves a broad range of use cases.
Analyst firm Forrester Research in its recent report has named Google Cloud a leader in the Big Data NoSQL market as it supports a broader set of use cases, automation, good scalability and performance, and security offerings.
Download this Forrester Research report to understand why enterprises are turning to NoSQL and why Google Cloud is a leader in this space.
More Relevant Stories for Your Company

Empower Your Firm’s Data Decisions with Dataplex Data Lineage
Today, we are excited to announce the general availability of Dataplex data lineage — a fully managed Dataplex capability that helps you understand how data is sourced and transformed within the organization. Dataplex data lineage automatically tracks data movement across BigQuery, BigLake, Cloud Data Fusion (Preview), and Cloud Composer (Preview),

Blue Apron: Offering a better recipe for modern analytics
When Blue Apron had issues running its data warehouse on another cloud provider, it built an analytics platform using Looker and Google BigQuery to enable faster business decisions about food inventory. Google Cloud Results Enables near real-time business decisions to better manage food inventory and delivery by reducing query times
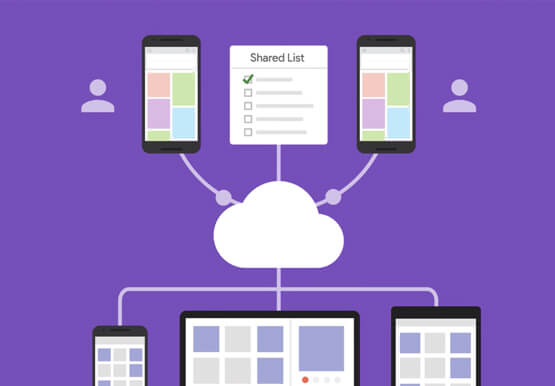

What’s Google Cloud Firestore Database and What are its Benefits for Business and Developers?
Cloud Firestore is a NoSQL document database that simplifies storing, syncing, and querying data for your mobile and web apps at global scale. Cloud Firestore is a fast, fully managed, serverless, cloud-native NoSQL document database that simplifies storing, syncing, and querying data for your mobile, web, and IoT apps at

The Divercity Story: Using Google Cloud to Achieve a More Inclusive and Sustainable Workforce
Despite a growing number of diversity, equity, and inclusion (DEI) initiatives, Black and Latinx people remain highly underrepresented in tech. Although comprising 12.6% and 18% of the U.S. labor force respectively, Black professionals hold only 5% of tech positions, while Latinx professionals fill just 6% of tech roles. Long-standing biases
