





3429
Of your peers have already watched this video.
19:30 Minutes
The most insightful time you'll spend today!
Data vs. COVID-19: How public data is helping flatten the curve
The outbreak of COVID-19 has changed the reality of millions of lives around the world. Communities around the world began social distancing, events were cancelled, and healthcare efforts redirected to fight the pandemic.
Hear how public data and the Google Cloud COVID-19 Public Datasets Program is helping combat the pandemic and informing individual decision-making to help everyone make informed decisions about the spread and risks of the virus, and how cooperative efforts could help flatten the curve.
In this presentation, Javier de la Torre, Founder and Chief Strategy Officer of Carto, and Shane Glass, Developer Advocate, Google Cloud demonstrate how the Carto platform is contributing to spatial analysis and understanding for how the outbreak evolved over time as government policies and social distancing measures were put into place.
They also show how to access these public datasets, what is included in the COVID-19 Public Datasets Program, and how you can use these datasets to develop maps and dashboards that will help us continue to combat the pandemic.
Analytics Hub for Secure Data Sharing and Analytics Unlocks True Data Value and Insights

6757
Of your peers have already read this article.
2:30 Minutes
The most insightful time you'll spend today!
Customers tell us that sharing and exchanging data with other organizations is a critical element of their analytics strategy, but it’s hamstrung by unreliable data and processes, and only getting harder with security threats and privacy regulations on the rise.
Furthermore, traditional data sharing techniques use batch data pipelines that are expensive to run, create late arriving data, and can break with any changes to the source data. They also create multiple copies of data, which brings unnecessary costs and can bypass data governance processes. These techniques do not offer features for data monetization, such as managing subscriptions and entitlements. Altogether, these challenges mean that organizations are unable to realize the full potential of transforming their business with shared data.
To address these limitations, we are introducing Analytics Hub, a new fully managed service, available in Q3, in preview, that helps you unlock the value of data sharing, leading to new insights and increased business value. With Analytics Hub you get:
- A rich data ecosystem by publishing and subscribing to analytics-ready datasets.
- Control and monitoring over how your data is being used, because data is shared in one place.
- A self-service way to access valuable and trusted data assets, including data provided by Google. For example, a unique dataset from Google Search Trends will be available, that you can query and combine with your own data.
- An easy way to monetize your data assets without the overhead of building and managing the infrastructure.
Built on a decade of cross-organizational sharing
While Analytics Hub is a new service, it builds on BigQuery, Google’s petabyte-scale, serverless cloud data warehouse. BigQuery’s unique architecture provides separation between compute and storage, enabling data publishers to share data with as many subscribers as you want without having to make multiple copies of your data. With BigQuery, there are no servers to deploy or manage, which means that data consumers get immediate value from shared data. Data can be provided and consumed in real-time using the streaming capabilities of BigQuery and you can leverage the built in machine learning, geospatial, and natural language capabilities of BigQuery or take advantage of the native business intelligence support with tools like Looker, Google Sheets, and Data Studio.
BigQuery has had cross-organizational, in-place data sharing capabilities since it was introduced in 2010. We took a look at usage metrics in BigQuery and found that over a 7 day period in April, we had over 3,000 different organizations sharing over 200 petabytes of data. These numbers don’t include data sharing between departments within the same organization.
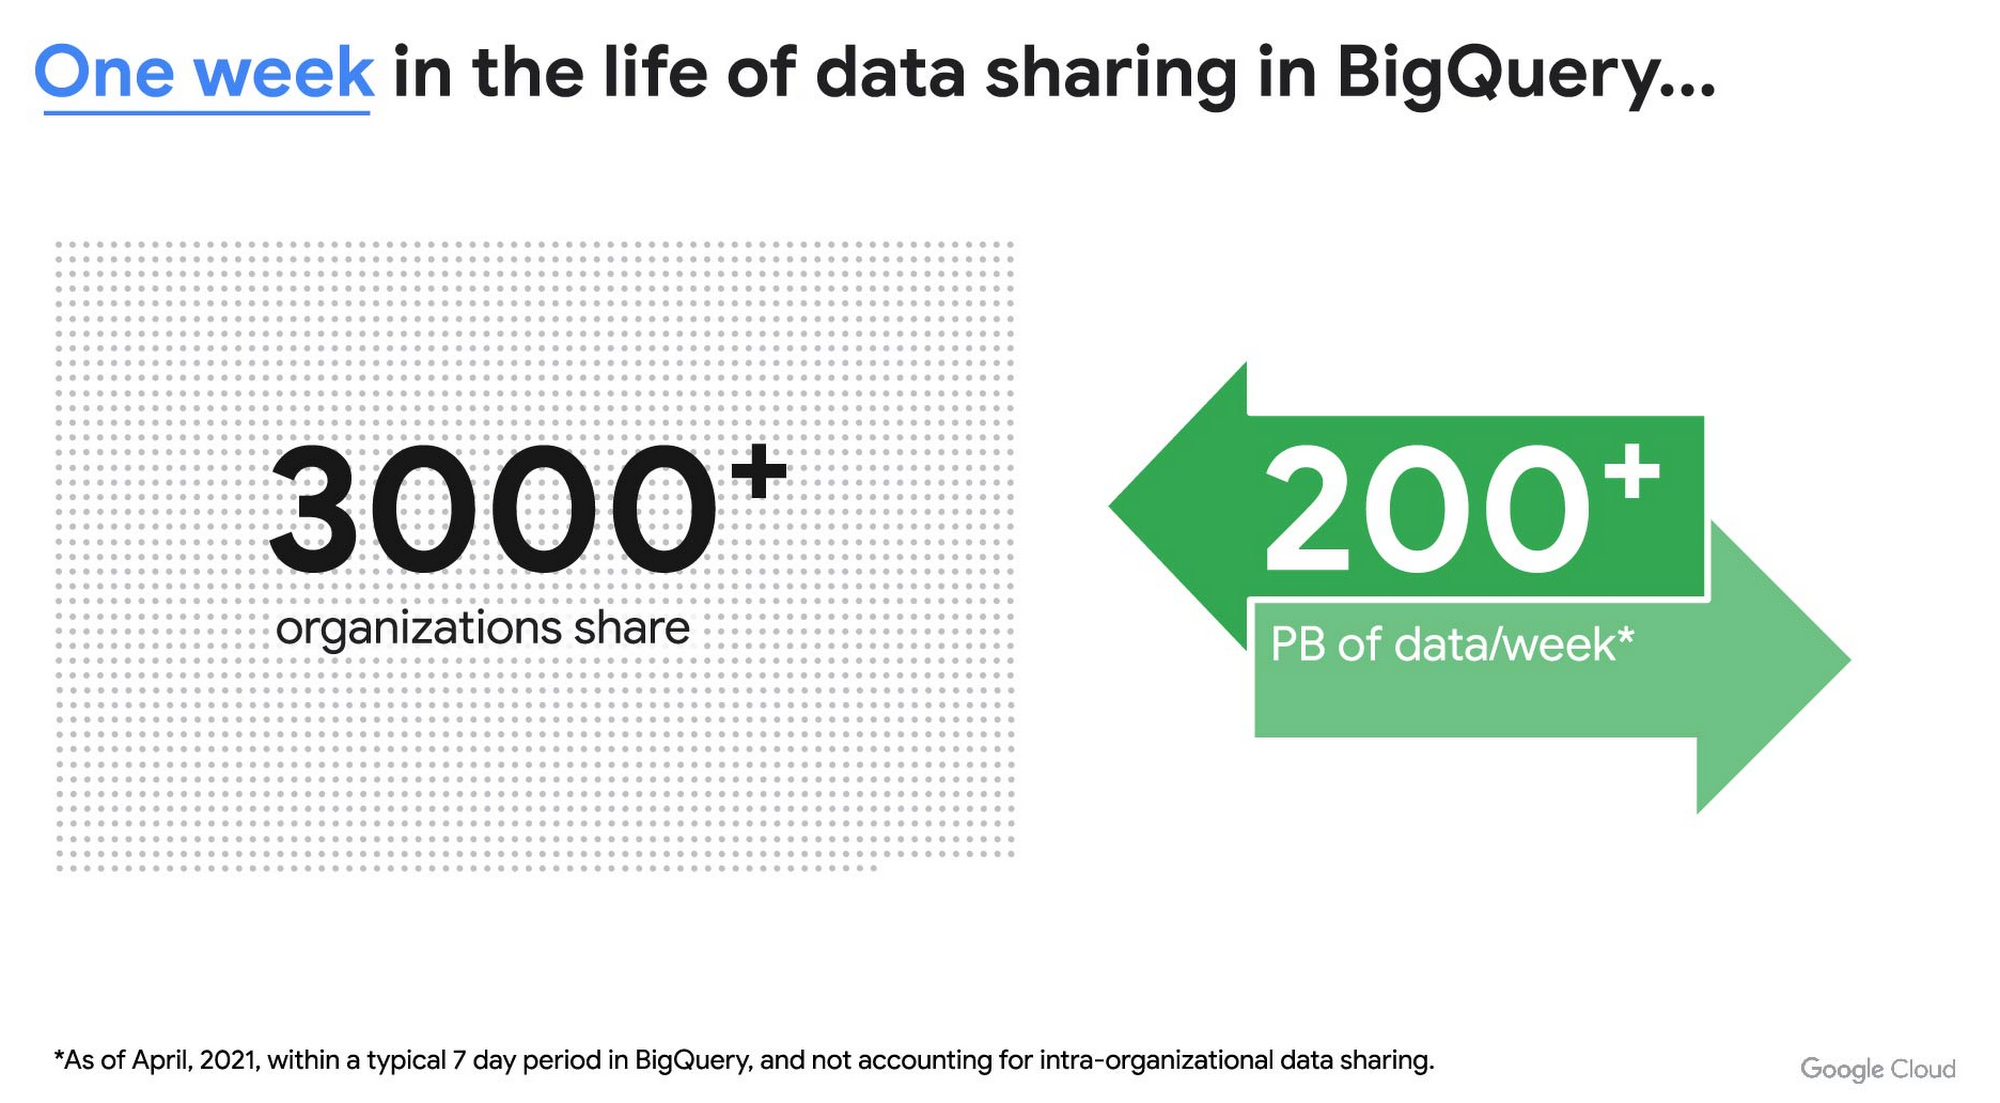
As you can see, data sharing in BigQuery is already popular. But we want to make it easier and even more scalable.
Raising the bar on data sharing
To make data sharing easier and more scalable in BigQuery, Analytics Hub introduces the concepts of shared datasets and exchanges. As a data publisher, you create shared datasets that contain the views of data that you want to deliver to your subscribers. Next, you create exchanges, which are used to organize and secure shared datasets. By default, exchanges are completely private, which means that only the users and groups that you give access to can view or subscribe to the data. You can also create internal exchanges or leverage public exchanges provided by Google. Finally, you publish shared datasets into an exchange to make them available to subscribers.
Data subscribers search through the datasets that are available across all exchanges for which they have access and subscribe to relevant datasets. This creates a linked dataset in their project that they can query and join with their own data. Subscribers pay for the queries that they run against the data while the publisher pays for the storage of the data. Data providers can add new data, new tables, or new columns to the shared dataset and these will be immediately available to subscribers. In addition, the publisher can track subscribers, disable subscriptions, and see aggregated usage information for the shared data.
Analytics Hub makes it easy for you to publish, discover, and subscribe to valuable datasets that you can combine with your own data to derive unique insights. Here are some types of data that will be available through Analytics Hub:
- Public datasets: Easy access to the existing repository of over 200 public datasets, including data about weather and climate, cryptocurrency, healthcare and life sciences, and transportation.
- Google datasets: Unique, freely-available datasets from Google. One example of this is the COVID-19 community mobility dataset. Another example is the forthcoming Google Trends dataset, which will provide the top 25 search terms and top 25 rising search terms over a 5 year window in 210 distinct locations in the US. Trends data can be used by everyone in the organization to gain insights into what customers care about.
- Commercial (paid for) datasets: We are working with leading commercial data providers to bring their data products to Analytics Hub. If you are interested in delivering your data via Analytics Hub, we’re also introducing Data Gravity, an initiative that provides storage benefits and new distribution paths for data published through Analytics Hub.
- Internal datasets: We know that data sharing can be challenging in larger organizations. Analytics Hub can be used for internal data, for example, to share standardized customer demographics with your sales engineering and data science teams.
Customers and partners using Analytics Hub

“Google Search Trends data has always been an important tool for our WPP agency data teams. At WPP we believe that data variety is a superpower which is why we are excited to use the new Trends dataset availability within BigQuery, plus the launch of Analytics Hub. The best creativity in the world is informed by data insights, and influenced by what people search for, so the operational efficiencies we’ll gain via the Analytics Hub and the insights we can drive with Trends data are just phenomenal.”
—Di Mayze Global Head of Data and AI, WPP

“Equifax Ignite is our shared data analytics environment within our Equifax data fabric. We are excited to partner with Google to leverage Analytics Hub and BigQuery to deliver data to over 400 statisticians and data modelers as well as securely sharing data with our partner financial institutions.”
—Kumar Menon, SVP Data Fabric and Decision Science, Equifax

“The flow of data and insights between our teams at Deloitte and our clients is paramount for building truly transformational data cultures. With its purpose-built architecture for secure data exchanges and sharing analytics resources, Google Cloud’s Analytics Hub can help provide significant operational efficiencies for how Deloitte teams support our clients’ data-driven initiatives within their industry ecosystems. It will also help minimize the worries about scale, privacy and security, or the administrative burden associated with each.”
—Navin Warerkar, Managing Director, Deloitte Consulting LLP, and US Google Cloud Data & Analytics GTM Lead

“Crux Informatics is proud to partner with Google to support the launch of Analytics Hub, removing friction for those who need access to analytics-ready data. With thousands of datasets from over 140 sources, Crux Informatics will accelerate access to data on Analytics Hub and together provide a more efficient and cost effective solution to deliver datasets in Google Cloud’s ecosystem.”
—Will Freiberg, CEO, Crux Informatics
Next steps for Analytics Hub
This is just the beginning for Analytics Hub. As we get to preview and general availability, we will be adding additional capabilities, including workflows for publishing and subscribing, publishing analytics assets (Looker Blocks, Data Studio reports, Connected Google Sheets) along with the shared data, the ability for data publishers to specify query restrictions on the usage of their data, and making it easy for data publishers to create sandbox environments for subscribers to work with their data, even if they are not yet on Google Cloud. We will provide features in Analytics Hub for monetization of data, including managing subscriptions, data entitlements, and billing.
Please sign up for the preview, which is scheduled to be available in the third quarter of 2021. In the meantime, you can learn more about BigQuery and how to leverage its built-in data sharing capabilities. Please go to g.co/cloud/analytics-hub to register your interest in Analytics Hub.

4670
Of your peers have already listened to this podcast
30:30 Minutes
The most insightful time you'll spend today!
Why it’s Easier Than Ever for Developers to Break Into Machine Learning and Data Science
The outbreak of COVID-19 has changed the reality of millions of lives around the world. Communities around the world began social distancing, events were cancelled, and healthcare efforts redirected to fight the pandemic.
Hear how public data and the Google Cloud COVID-19 Public Datasets Program is helping combat the pandemic and informing individual decision-making to help everyone make informed decisions about the spread and risks of the virus, and how cooperative efforts could help flatten the curve.
In this presentation, Javier de la Torre, Founder and Chief Strategy Officer of Carto, and Shane Glass, Developer Advocate, Google Cloud demonstrate how the Carto platform is contributing to spatial analysis and understanding for how the outbreak evolved over time as government policies and social distancing measures were put into place.
They also show how to access these public datasets, what is included in the COVID-19 Public Datasets Program, and how you can use these datasets to develop maps and dashboards that will help us continue to combat the pandemic.
5206
Of your peers have already watched this video.
5:00 Minutes
The most insightful time you'll spend today!
How to Build and Maintain Spark and Hadoop Clusters Quickly, Easily and Inexpensively
How often have you struggled to create Spark and Hadoop clusters only to have them become unstable?
Building and maintaining clusters that are the building blocks of big data analytics should not be a time-consuming, repetitive, and expensive process. But with the current set of tools, it often is.
Google Cloud Dataproc solves this. It is a fast, easy-to-use, fully-managed cloud service for running Spark and Hadoop clusters in a simple, more cost-efficient way.
Operations that used to take hours or days take now seconds or minutes instead, and you pay only for the resources you use (with per-second billing).
Watch this five-minute demo to find out how—with just a few clicks—you can set up clusters that build and heal themselves. You’ll find out how to creating a large Dataproc cluster with preemptible VMs, which help run large clusters at a low total cost.
NVIDIA and Google Cloud Pave the Way for Single-cell Genomic Analysis

3007
Of your peers have already read this article.
2:00 Minutes
The most insightful time you'll spend today!
In the past decade, the Healthcare and Life Sciences industry has enjoyed a boon in technological and scientific advancement. New insights and possibilities are revealed almost daily. At Google Cloud, driving innovation in cloud computing is in our DNA. Our team is dedicated to sharing ways Google Cloud can be used to accelerate scientific discovery. For example, the recent announcement of AlphaFold2 showcases a scientific breakthrough, powered by Google Cloud, that will promote a quantum leap in the field of proteomics. In this blog, we’ll review another omics use case, single-cell analysis, and how Google Cloud’s Dataproc and NVIDIA GPUs can help accelerate that analysis.
The Need for Performance in Scientific Analysis
The ability to understand the causal relationship between genotypes and phenotypes is one of the long-standing challenges in biology and medicine. Understanding and drawing insights from the complexity of biological systems abounds from the actual code of life (DNA) through to expression of genes (RNA) to translation of gene transcripts into proteins that function in different pathways, cells, and tissues within an organism. Even the smallest of changes in our DNA can have large impacts on protein expression, structure, and function, which ultimately drives development and response – at both cellular and organism levels. And, as the omics space becomes increasingly data- and compute-intensive, research requires an adequate informatics infrastructure. An infrastructure that scales with growing data demands, enables a diverse range of resource-intensive computational activities, and is affordable and efficient – reducing data bottlenecks and enabling researchers to maximize insight.
But where do all these data and compute challenges come from and what makes scientific study so arduous? The layers of biological complexity begin to be made apparent immediately when looking at not just the genes themselves, but their expression. Although all the cells in our body share nearly identical genotypes, our many diverse cell types (e.g. hepatocytes versus melanocytes) express a unique subset of genes necessary for specific functions, making transcriptomics a more powerful method of analysis by allowing researchers to map gene expression to observable traits. Studies have shown that gene expression is heterogeneous, even in similar cell types. Yet, conventional sequencing methods require DNA or RNA extracted from a cell population. The development of single-cell sequencing was pivotal to the omics field. Single-cell RNA sequencing has been critical in allowing scientists to study transcriptomes across large numbers of individual cells.
Despite its potential, and the increasing availability of single-cell sequencing technology, there are several obstacles: an ever increasing volume of high-dimensionality data, the need to integrate data across different types of measurements (e.g. genetic variants, transcript and protein expression, epigenetics) and across samples or conditions, as well as varying levels of resolution and the granularity needed to map specific cell types or states. These challenges present themselves in a number of ways including background noise, signal dropouts requiring imputation, and limited bioinformatics pipelines that lack statistical flexibility. These and other challenges result in analysis workflows that are very slow, prohibiting the iterative, visual, and interactive analysis required to detect differential gene activity.
Accelerating Performance
Cloud computing can help not only with data challenges, but with some of the biggest obstacles: scalability, performance, and automation of analysis. To address several of the data and infrastructure challenges facing single-cell analysis, NVIDIA developed end-to-end accelerated single-cell RNA sequencing workflows that can be paired with Google Cloud Dataproc, a fully-managed service for running open source frameworks like Spark, Hadoop, and RAPIDS. The Jupyter notebooks that power these workflows include examples using samples like human lung cells and mouse brains cells and demonstrate acceleration between CPU-based processing compared to GPU-based workflows.
Google Cloud Dataproc powers the NVIDIA GPU-based approach and demonstrates data processing capabilities and acceleration, which in turn have the potential of delivering considerable performance gains. When paired with RAPIDS, practitioners can accelerate data science pipelines on NVIDIA GPUs, reducing operations like data loading, processing, and training from hours to seconds. RAPIDS abstracts the complexities of accelerated data science by building upon popular Python and Java libraries effortlessly. When applying RAPIDS and NVIDIA accelerated compute to single-cell genomics use cases, practitioners can churn through analysis of a million cells in only a few minutes.
Give it a Try
The journey to realizing the full potential of omics is long; but through collaboration with industry experts, customers, and partners like NVIDIA, Google Cloud is here to help shine a light on the road ahead. To learn more about the notebook provided for single-cell genomic analysis, please take a look at NVIDIA’s walkthrough. To give this pattern a try on Dataproc, please visit our technical reference guide.
Apache and Dataflow Help with Real-time Indices Processing for Financial Institutions
4916
Of your peers have already read this article.
4:00 Minutes
The most insightful time you'll spend today!
Financial institutions across the globe rely on real-time indices to inform real-time portfolio valuations, to provide benchmarks for other investments, and as a basis for passive investment instruments including exchange-traded products (ETPs). This reliance is growing—the index industry dramatically expanded in 2020, reaching revenues of $4.08 billion.
Today, indices are calculated and distributed by index providers with proximity and access to underlying asset data, and with differentiating real-time data processing capabilities. These providers offer subscriptions to real-time feeds of index prices and publish the constituents, calculation methodology, and update frequency for each index.
But as new assets, markets, and data sources have proliferated, financial institutions have developed new requirements. Financial institutions will need to quickly create bespoke and frequently updating indices that represent a specific actual or theoretical portfolio, with its unique constituents and weightings.
In other words, existing index providers and other financial institutions alike will need mechanisms for rapid creation of real-time indices. This blog post’s focus—an index publication pipeline collaboratively developed by CME Group and Google Cloud—is an example of such a mechanism.
The pipeline closely approximates a particular CME Group index benchmark, but with far greater frequency (in near real time vs. daily) than its official counterpart. It does so by leveraging open-source models such as Apache Beam and cloud-based technologies such as Dataflow, which automatically scales pipelines based on inbound data volume.
Machine learning’s production problem
In the past decade, advances in AI toolchains have enabled faster ML model training—and yet a majority of ML models are still not making it into production. As organizations endeavor to develop their ML capabilities, they soon realize that a real-world ML system is comprised of a small amount of ML code embedded in a network of complex and large ancillary components. Each component brings its own development and operational challenges, which are met by bringing a DevOps methodology to the ML system, commonly referred to as MLOps (Machine Learning Operations). To apply ML to business problems, a firm must develop continuous delivery and automation pipelines for ML.
This index publication collaboration is instructive because it demonstrates MLOps best practices for just such a pipeline. One Apache Beam pipeline, suited for operating on both batch and streaming data, extracts insights and packages them for downstream consumers. These consumers may include ML pipelines that, thanks to Apache Beam, require only one code path for inference across batch and real-time data sources. The pipeline is run inside Google Cloud’s Dataflow execution engine, greatly simplifying management of underlying compute resources.
But the collaboration’s value is not constrained to the ML and data science realm. The project shows that consumers of the Apache Beam pipeline’s insights may also include traditional business intelligence dashboards and reporting tools. It also demonstrates the simplicity and economy of cloud-based time series data such as CME Smart Stream, which is metered by the hour, quickly and automatically provisioned, and consumable at a per-product-code (not per-feed) level.
A focus on real-time processing for financial services
To illustrate the above points, the collaboration applies data engineering and MLOps best practices to a financial services problem. We chose the financial services domain because many financial institutions do not yet have real-time market data processing or MLOps capabilities today, owing to a significant gap on either side of their ML/AI objectives.
Upstream from ML/AI models, financial institutions often experience a data engineering gap. For many financial institutions, batch processes have sufficiently addressed business requirements. As a result, the temporal nature of the time series data underlying these processes is deemphasized. For example, the original purpose of most trade booking systems was to capture a trade and ensure that it found its way to the middle and back office for settlement. It was not built with ML/AI in mind, and its underlying data therefore has not been packaged for consumption by ML/AI processes.
And downstream from ML/AI models, financial institutions often encounter the aforementioned “ML production problem.”
As ML/AI becomes ever more strategic, these two gaps have left many financial institutions in a conundrum—unable to train ML models for lack of properly packaged time series data, and unmotivated to package time series data for lack of ML models. By recreating a key energy market index using open-source libraries and cloud-based tools, this collaboration demonstrates that for the financial services domain a solution to this conundrum is more accessible today than ever.
Creating a new index
We modeled our new index after one of CME Group’s many index benchmarks. The particular index expresses the value of a basket of three New York Mercantile Exchange—listed energy futures as a single price. Today, CME Group publishes the index at the end of the day by calculating the settlement price of each underlying futures contract, and then weighing and summing these values.
While CME Group does not currently publish this index in real time, this collaboration aims to create a near real-time solution leveraging Google Cloud capabilities and CME Group market data delivered via CME Smart Stream. However, in order to publish the value so frequently—every five seconds, with 40-second publish latency—this collaboration’s pipeline has to solve a number of challenges in near-real time.
First, the pipeline must process sparse data from three separate trades feeds in memory to create open-high-low-close (OHLC) bars. More specifically, for five-second windows for each of the three front-month (and sometimes second-month) energy contracts, a bar must be produced. This is solved by using the Apache Beam library to implement functions which, when executed on Dataflow, automatically scale out as input load increases. The bars must be time-aligned across the underlying feeds, which is greatly simplified by Beam’s watermark feature. And for intervals in which no tick data is observed, the Beam library is used to pull forward the last value received, yielding perfect gap-free bars for downstream processors.
Second, the pipeline must calculate volume-weighted average price (VWAP) in near real-time for each front-month contract. The VWAP calculations are also written using the Beam API and executed on Dataflow. Each of these functions requires visibility of each element in the time window, so the functions cannot be arbitrarily scaled out. Nonetheless, this is tractable because their input—OHLC bars—is manageably small.
Third, the pipeline must replicate CME Group’s specific settlement price methodology for each contract. The rules specify whether to use VWAP or another source as price, depending on certain conditions. They also specify how to weigh combinations of monthly contracts during a roll period. The pipeline again encapsulates these requirements as an Apache Beam class, and joins the separate price streams at the correct time boundary.
The end result is a new stream publishing bespoke index data to a Google Cloud Pub/Sub topic thousands of times daily, enabling AI models as well as traditional industry index usage, dashboards, and other tools to assist real-time decision making. The stream’s pipeline uses open source libraries that solve common time series problems out-of-the box, and cloud-based services to reduce the user’s operational and scaling burden.

The importance of cloud-based data
The promise of cloud-based pipeline execution services cannot be realized using legacy data access patterns, which often require market data users to colocate and configure servers and network gear. Such patterns inject expense and scaling complexity into the pipeline’s overall operation, diverting resources from the adoption of MLOps best practices. Instead, a newer, cloud-based access pattern—in which resources subscribe to data streams inexpensively, rapidly and programatically—is necessary.
In 2018, CME Group identified the customer need for accessible futures and options market data. CME Group collaborated with Google Cloud to launch CME Smart Stream, which distributes CME Group’s real-time market data across Google Cloud’s global infrastructure with sub-second latency. Any customer with a CME Group data usage license and a Google Cloud project can consume this data for an hourly usage fee, without purchasing and configuring servers and network gear.
CME Smart Stream met this index pipeline’s requirements for cost-effective, cloud-based streaming data, but this is just one use case. Since the launch of a CME Smart Stream offering on Google Cloud, globally dispersed firms have adopted the solution. For example, Coin Metrics has been using the offering to better inform its customers in the crypto markets. According to CME Group, Smart Stream has become popular with new customers as the fastest, simplest way to access CME Group’s market data from anywhere in the world.
Adapt the design pattern to your needs
By combining cloud-based data, open-source libraries, and cloud-based pipeline execution services, we created a real-time index using the same constituents as its end-of-day counterpart. Additionally, financial institutions will find this approach addresses many other challenges—real-time valuation of a large set of portfolios; benchmark creation for new ETPs; or external publication of new indices.
Give it a try
This approach is available to help you meet your organization’s needs. Please review our user guide, whose Tutorials section provides a step-by-step guide to constructing a simple Apache Beam pipeline to generate metrics on streaming data in real-time, and connecting a new data source to the pipeline. We’ll be discussing this topic in CME Group’s webinar End-to-End Market Data Solutions in the Cloud at 10:30 am ET on June 16th.
More Relevant Stories for Your Company

2022 Healthcare Trends: Healthcare Data, M&As, Better Patient Care, AI in Drug Development & Strategic Partnerships
The COVID-19 pandemic continues to push the healthcare and life sciences industry in entirely new ways. In record time, we’ve witnessed public health officials, vaccine developers, equipment manufacturers, and essential workers take life saving actions—regularly putting their own lives at risk—to respond to the exceptional challenges of our time. Yet

How Google Cloud Helps SAP Admins Create Scalable, Secure Networks
SAP forms the critical backbone of thousands of enterprises, supporting critical business functions such as finance, supply chain, warehouse management, and more. Google Cloud provides a highly scalable and resilient infrastructure to run such workloads and offers tools, such as Smart Analytics and Machine Learning that can accelerate your organization’s digital transformation. In fact, a

Leverage the Power of Looker to Extract Data Value at Web Scale
Data science can be applied to business problems to improve practices and help to strengthen customer satisfaction. In this blog, we address how the addition of Looker extends the value of your Google Cloud investments to help you understand your customer journey, unlock value from first-party data, and optimize existing

How to Enhance Incremental Pipeline Performance while Ingesting Data into BigQuery
When you build a data warehouse, the important question is how to ingest data from the source system to the data warehouse. If the table is small you can fully reload a table on a regular basis, however, if the table is large a common technique is to perform incremental
