





5695
Of your peers have already watched this video.
22:00 Minutes
The most insightful time you'll spend today!
Chronicle Security Analytics: Key to Address Security Data Overload
Google Cloud’s Chronicle is a security analytics platform built for modern use cases to combat modern threats. In today’s world, enterprises have undergone significant changes in all aspects, and must adapt to their security needs to counter threats and attacks. Watch the video to learn Google Cloud’s initiative to help businesses improve their security by 10x to catch up with the way the world is changing and how Chronicle Security Analytics is poised to help address data security challenges.
6089
Of your peers have already watched this video.
1:30 Minutes
The most insightful time you'll spend today!
Explore the Innovations and Architecture Powering Spanner and BigQuery
Previously, databases had architectures with tightly coupled storage and compute. This resulted in higher latency, and with faster networks these constraints no longer surface. With Google Cloud’s BigQuery and CloudSpanner, the storage and compute architecture have been separated, allowing for better scalability and availability to address businesses’ high throughput data needs.
Watch the video to understand how these database and analysis products leverage Google’s distributed storage system, in-house custom network hardware and software, internal cluster management system and more!

6804
Of your peers have already downloaded this article
3:08 Minutes
The most insightful time you'll spend today!
Reach the Right Customers
How can AI help you target customers who are looking for products like yours?
The challenge: This customer wants to buy the best cat food for her pets.

How AI Works
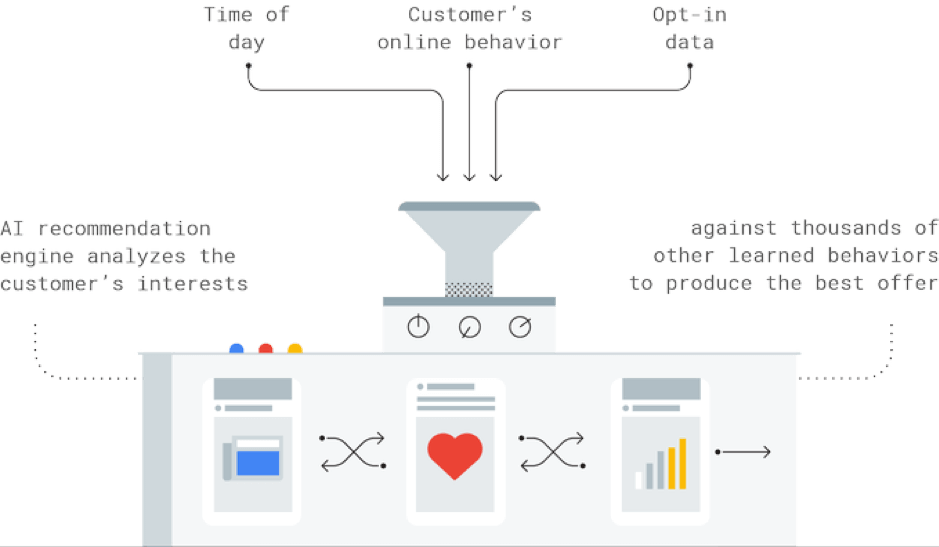
The Result
A targeted offer for a discount on luxury cat food is shown to the customer.

Predict What Customers Want
How can AI help you stay one step ahead when customer demand is uncertain?
The challenge: This lemonade seller isn’t sure how much lemonade he’ll need in the week ahead.

How AI Works
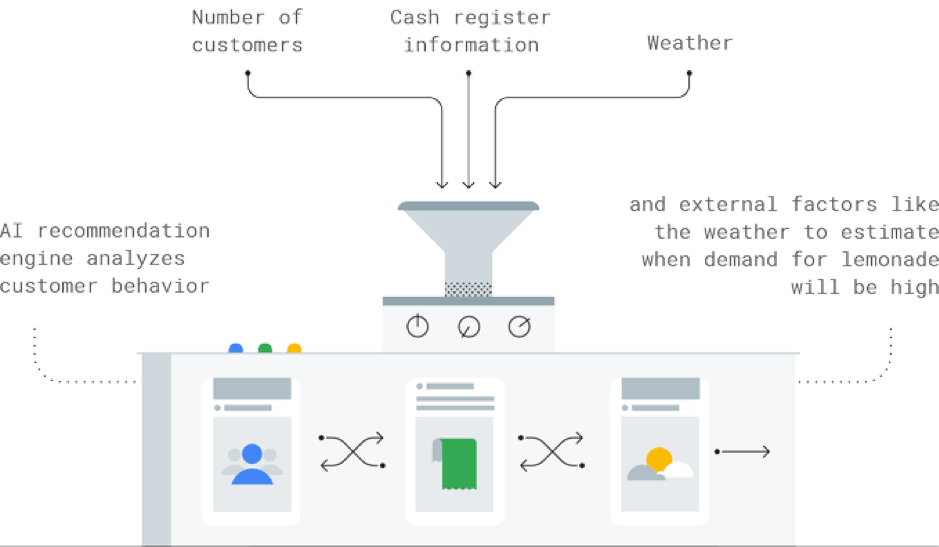
The Result
The seller makes just the right amount of lemonade to satisfy his customers and earn a juicy profit.

Keep Your Customers
Your next job is retaining your customers. How can AI deliver campaigns that drive loyalty?
The challenge: This customer has bought products from a fitness brand. But can that brand ensure she becomes a loyal fan?

How AI Works
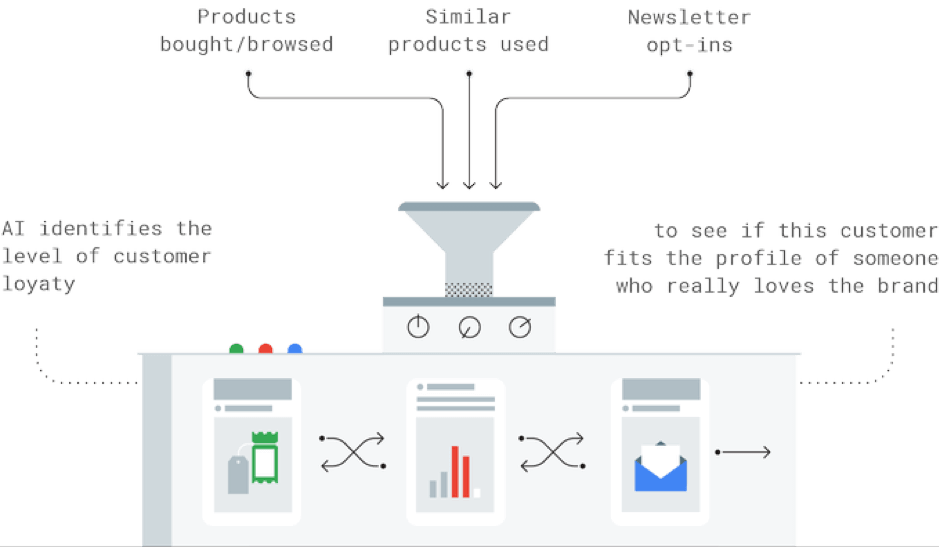
The Result
The brand delivers personalized offers that entice the customer to add to her sportswear collection — at exclusive discounts, too.

Ahead of the Curve: 5 Data and AI Trends Set to Shape 2023

2273
Of your peers have already read this article.
4:00 Minutes
The most insightful time you'll spend today!
How will your organization manage this year’s data growth and business requirements? Your actions and strategies involving data and AI will improve or undermine your organization’s competitiveness in the months and years to come. Our teams at Google Cloud have an eye on the future as we evolve our strategies to protect technology choice, simplify data integration, increase AI adoption, deliver needed information on demand, and meet security requirements.
Google Cloud worked with* IDC on multiple studies involving global organizations across industries in order to explore how data leaders are successfully addressing key data and AI challenges. We compiled the results in our 2023 Data and AI Trends report. In it, you’ll find the metrics-rich research behind the top five data and AI trends, along with tips and customer examples for incorporating them into your plans.
1: Show data silos the door
Given the increasing volumes of data we’re all managing, it’s no surprise that siloed transactional databases and warehousing strategies can’t meet modern demands. Organizations want to improve how they store, manage, analyze, and govern all their data, while reducing costs. They also want to eliminate conflicting insights from replicated data and empower everyone with fresh data.
A unified data cloud enables the integration of data and insights into transformative digital experiences and better decision making.
Andi Gutmans, GM and VP of Engineering for Databases, Google Cloud
In the report, you can learn how to adopt a unified data cloud that supports every stage of the data lifecycle so that you can improve data usage, accessibility, and governance. Inform your strategy by drawing on organizations’ examples such as a data fabric that improves customer experiences by connecting more than 80 data silos, as well as other unified data clouds that save money and simplify growth.
2: Usher in the age of the open data ecosystem
Data is the key to unlocking AI, speeding up development cycles, and increasing ROI. To protect against data and technology lock-in, more organizations are adopting open source software and open APIs.
Tweet this quote
Understand how you can simplify data integration, facilitate multicloud analytics, and use the technologies you want with an open data ecosystem, as described in the report. Learn from metrics about global open source adoption and public dataset usage. And explore how global companies adopted open data ecosystems to improve patient outcomes, increase website traffic by 25%, and cut operating costs by 90%.
3: Embrace the AI tipping point
Pulling useful information out of data is easier with AI and ML. Not only can you identify patterns and answer questions faster but the technologies also make it easier to solve problems at scale.
We’ve reached the AI tipping point. Whether people realize it or not, we’re already using applications powered by AI—every day. Social media platforms, voice assistants, and driving services are easy examples.
June Yang, VP, Cloud AI and Industry Solutions, Google Cloud
Organizations share how they’re reaching their goals using AI and ML by empowering “citizen data scientists” and having them focus on small wins first. Gain tips from Yang and other experts for developing your AI strategy. And read how organizations achieve outcomes such as a reduction of 7,400 tons per year in carbon emissions and a more than 200% increase in ROI from ad spend by using pattern recognition and other AI capabilities.

4: Infuse insights everywhere
Yesterday’s BI solutions have led to outdated insights and user fatigue with the status quo, based on generic metrics and old information. Research shows that as new tools come online, expectations for BI are changing, with companies revising their strategies to improve decision making, speed up the development of new revenue streams, and increase customer acquisition and retention by providing individuals with needed information on demand.
Organizations are equipping business decision-makers with the tools they need to incorporate required insights into their everyday workflows.
Kate Wright, Senior Director, Product Management, Google Cloud
In the report, you’ll discover why and how data leaders are rethinking their BI analytics strategies and applications to improve users’ trust and use of data in automated workflows, customizable dashboards, and on-demand reports. Global companies also share how they improve decision making with self-service BI, customer experiences with IoT analysis, and threat mitigation with embedded analytics.
5: Get to know your unknown data
Increasing data volumes can make it harder to know where and what data they store, which may create risk. Case in point: If a customer unexpectedly shares personally identifiable information during a recorded customer support call or chat session, that data might require specialized governance, which the standardized storage process may not provide.
If you don’t know what data you have, you cannot know that it’s accurately secured. You also don’t know what security risks you are incurring, or what security measures you need to take.
Anton Chuvakin, Senior Staff Security Consultant, Google Cloud
Check out the report to learn about data security risks that are often overlooked and how to develop proactive governance strategies for your sensitive data. You can also read how global organizations have increased customer trust and productivity by improving how they discover, classify, and manage their structured and unstructured data.
Be ready for what’s next
What’s exciting about these trends is that they’re enabling organizations across industries to realize very different goals using their choice of technologies. And although all the trends depend on each other, research shows you can realize measurable benefits whether you adopt one or all five.
Review the report yourself and learn how you can refine your organization’s data and AI strategies by drawing on the collective insights, experiences, and successes of more than 800 global organizations.
3014
Of your peers have already watched this video.
25:00 Minutes
The most insightful time you'll spend today!
Data Catalog for Data Discovery and Metadata Management
Data discovery and metadata management is a common pain point for most enterprises. Data Catalog is a managed service that addresses this pain point with a scalable and performant solution.
“Data catalog, simply put, enables users to discover, understand, and manage all their data assets,” says Shekhar Bapat, Product Manager, Google Cloud.
Data Catalog also offers integration with DLP for auto detection and tagging of sensitive data and facilitates better data governance. Data Catalog provides support for non-Google Cloud data assets and enables customers to discover, understand, and manage ALL their data.
The session is co-presented with Shruti Thaker, Head of Alt Vendor Data and Alpha Capture, BlackRock, which has invested in Data Catalog. Thaker will share how BlackRock is using Data Catalog to create an effective metadata solution for BlackRock data assets.
Time-series Model on Google Cloud Allows Better Transparency on Fishing and Marine Activities

4405
Of your peers have already read this article.
3:30 Minutes
The most insightful time you'll spend today!
Who would have known that today technology would enable us with the ability to use machine learning to track vessel activity, and make pattern inferences to help address IUU (illegal, unreported, and unregulated) fishing activities. What’s even more noteworthy is that we now have the computing power to share this information publicly in order to enable fair and sustainable use of our ocean.
An amazing group of humans at the nonprofit Global Fishing Watch took on this massive big data challenge and succeeded. You can immediately access their dynamic map on their website globalfishingwatch.org/map that is bringing greater transparency to fishing activity and supporting the creation and management of marine protected areas throughout the world.
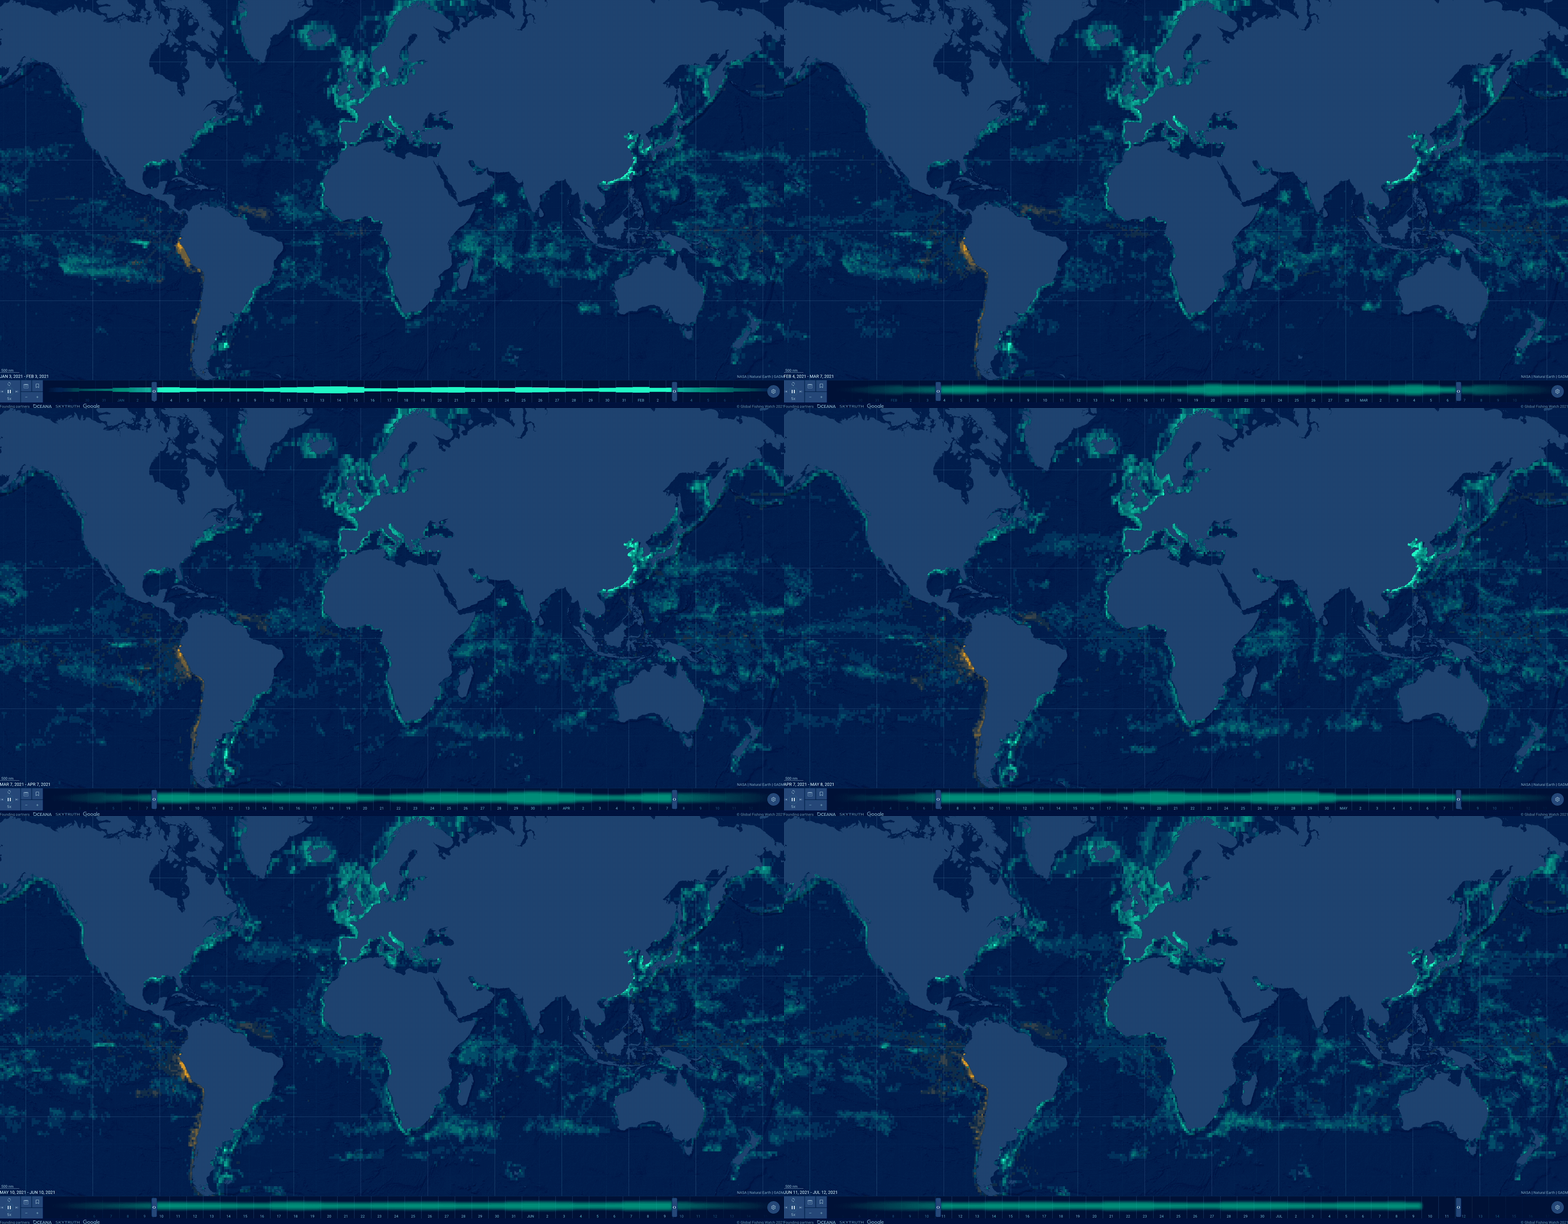
In our second episode of our People and Planet AI series we were inspired by their ML solution to this challenge, and we built a short video and sample with all the relevant code you need to get started with building a basic time-series classification model in Google Cloud, and visualize it in an interactive map.
Architecture
These are the components used to build a model for this sample:
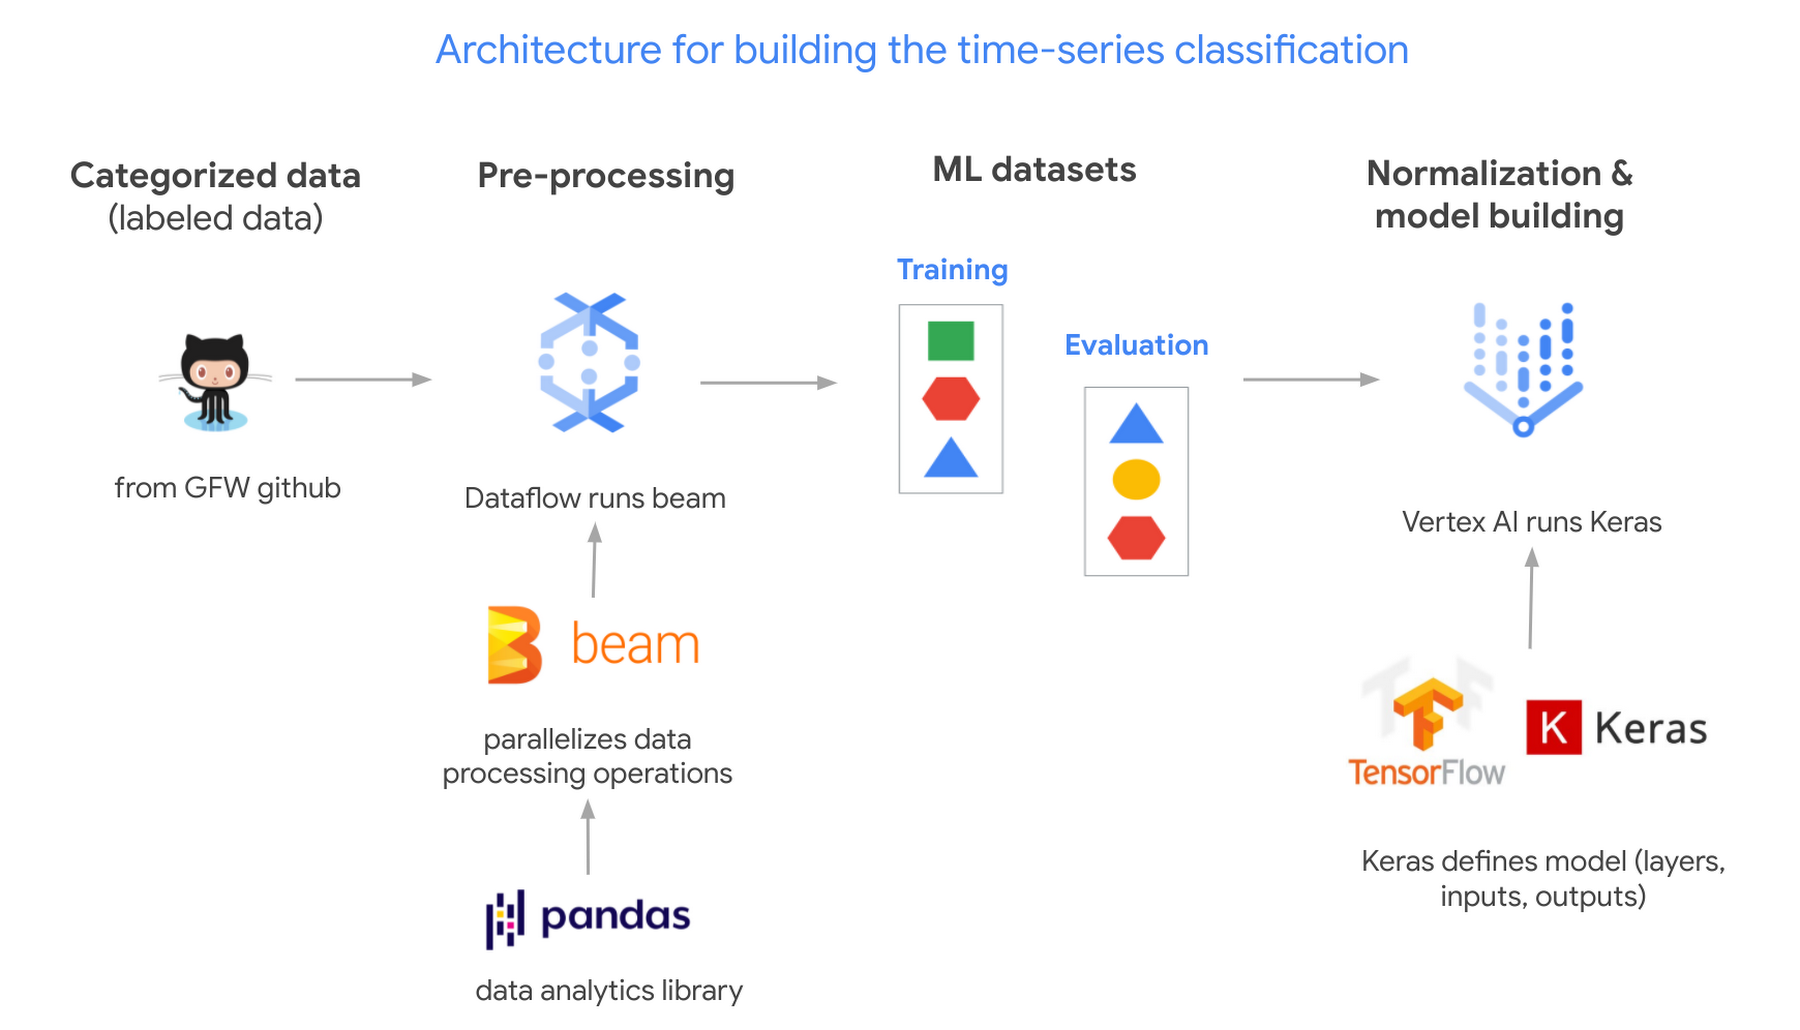
- Global Fishing Watch GitHub: where we got the data
- Apache Beam: (open source library) runs on Dataflow.
- Dataflow: (Google’s data processing service) creates 2 datasets; 1 for training a model and the other to evaluate its results.
- TensorflowKeras: (high level API library) used to define a machine learning model, which we then train in Vertex AI.
- Vertex AI: (a platform to build, deploy, and scale ML models) we train and output the model.
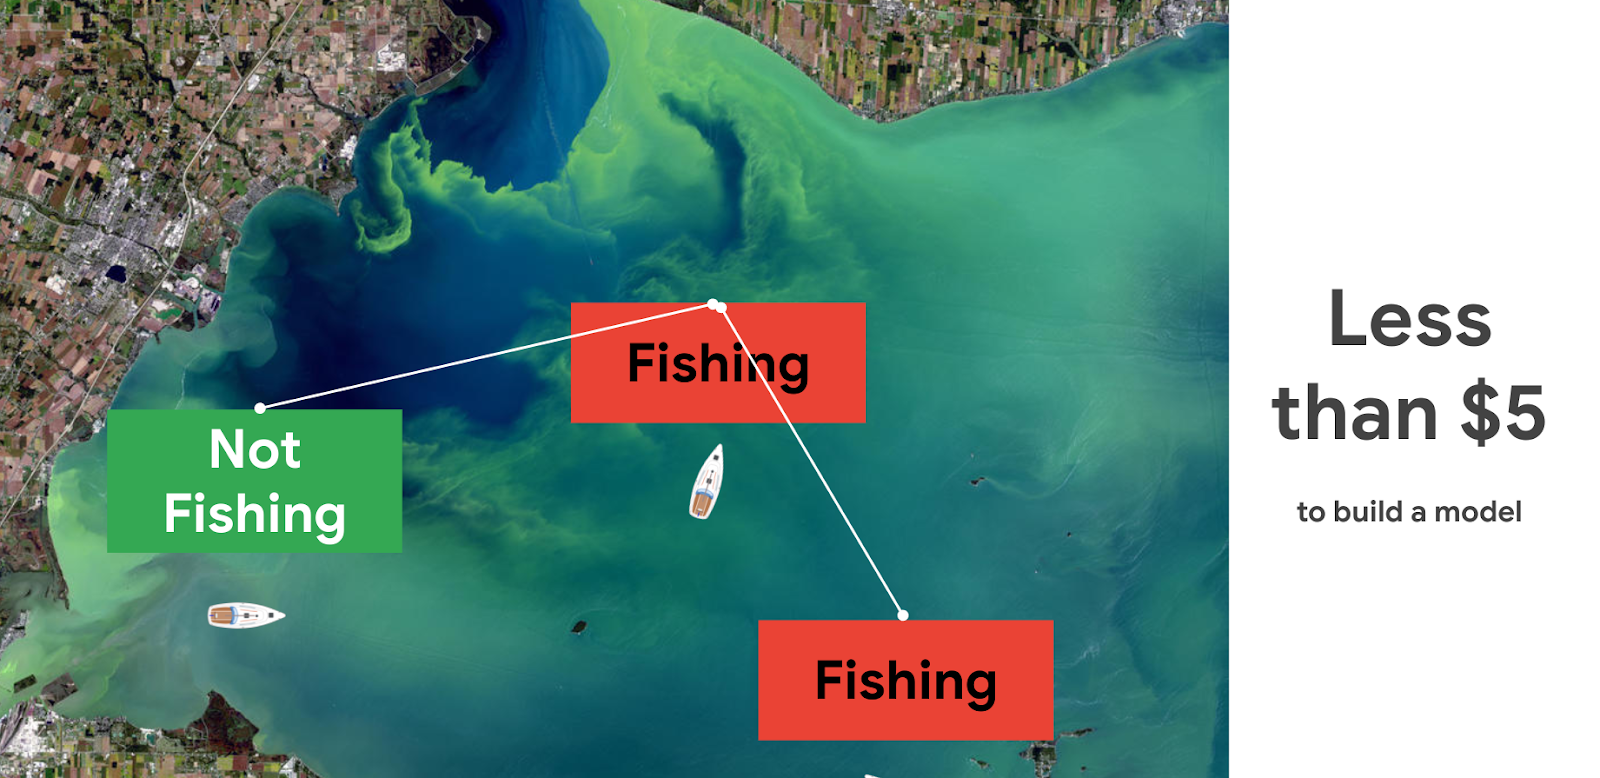
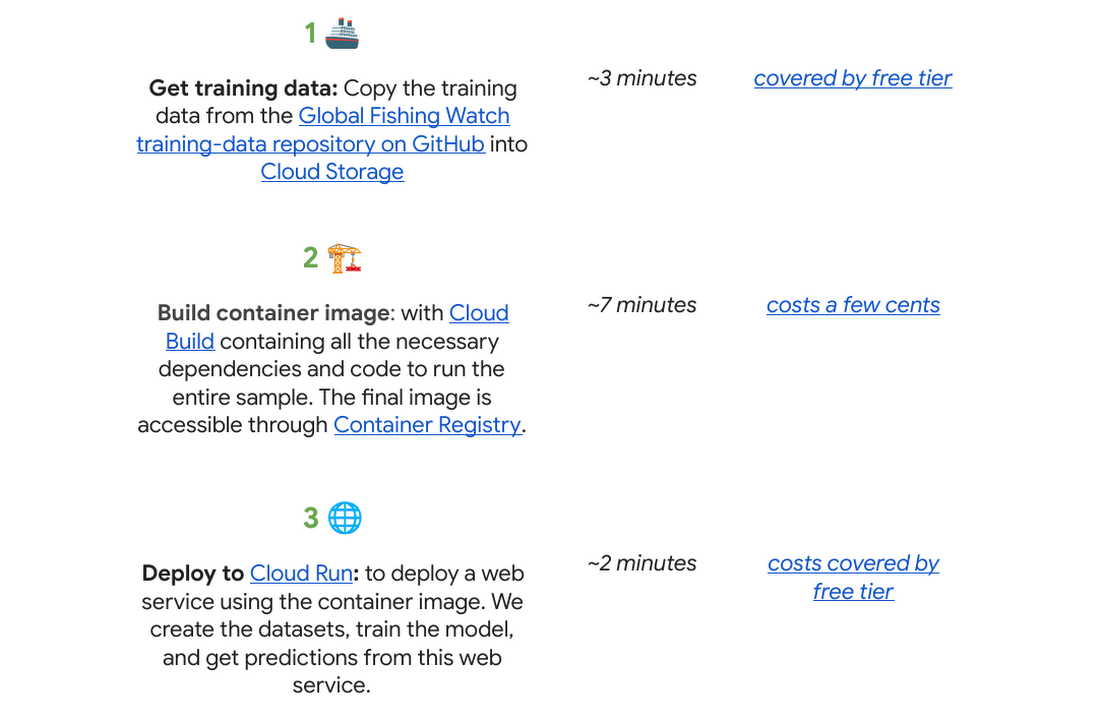
Pricing and steps
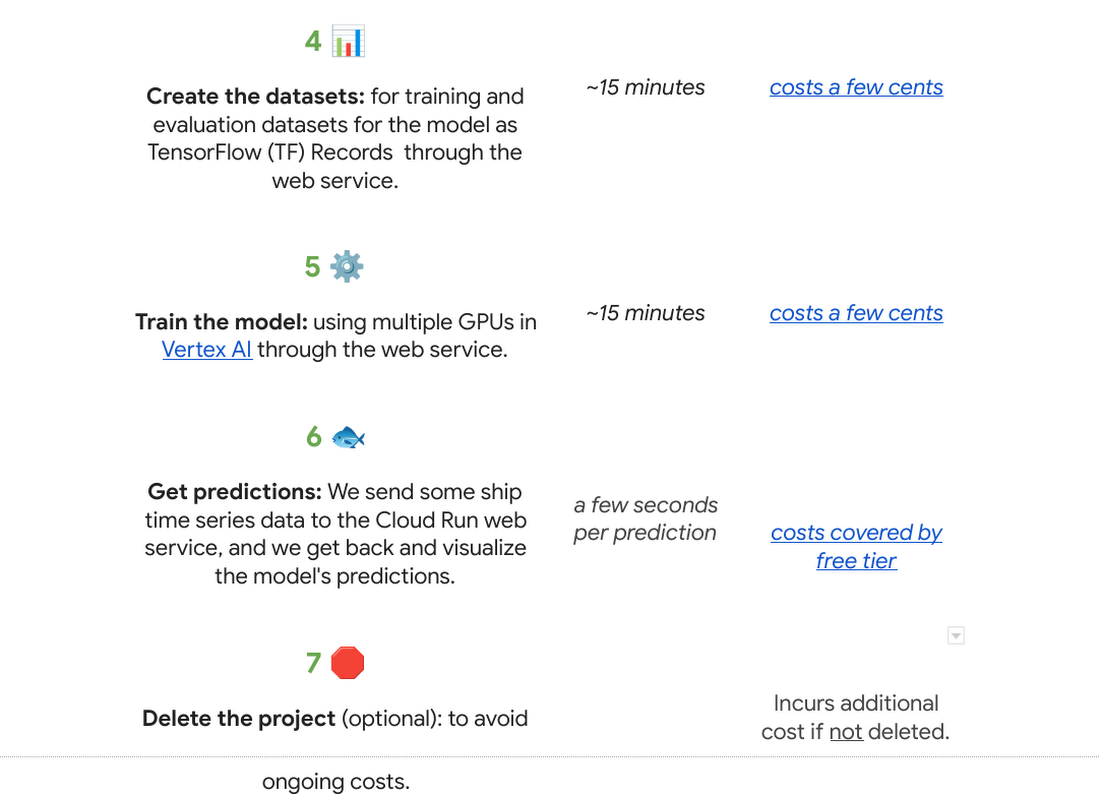
The total cost to run this solution was less than $5.
There are seven steps we went through with their approximate time and cost:
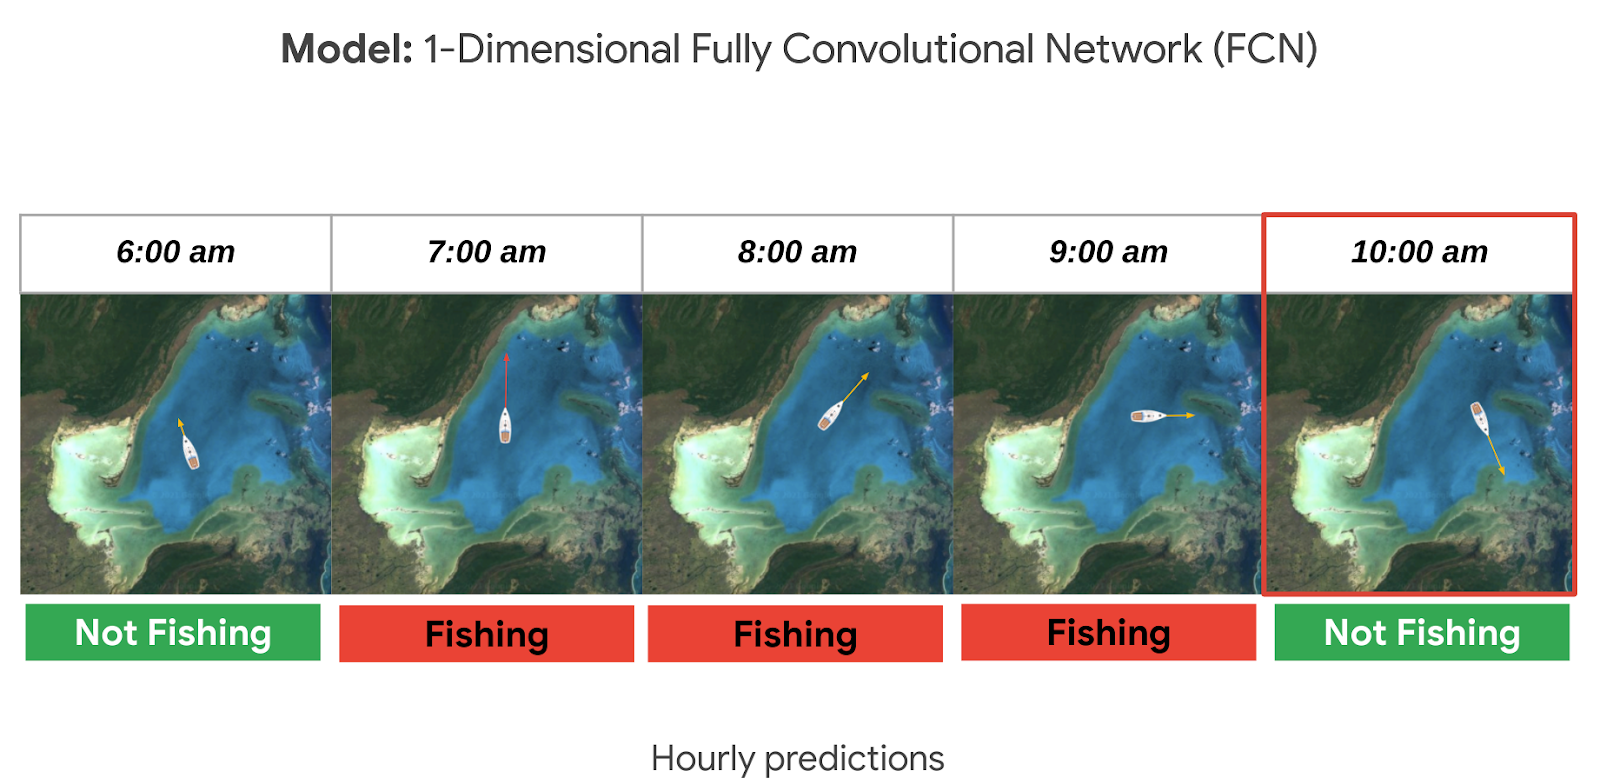
Why do we use a time series classification model?
Vessels in the ocean are constantly moving, which creates distinctive patterns from a satellite view.
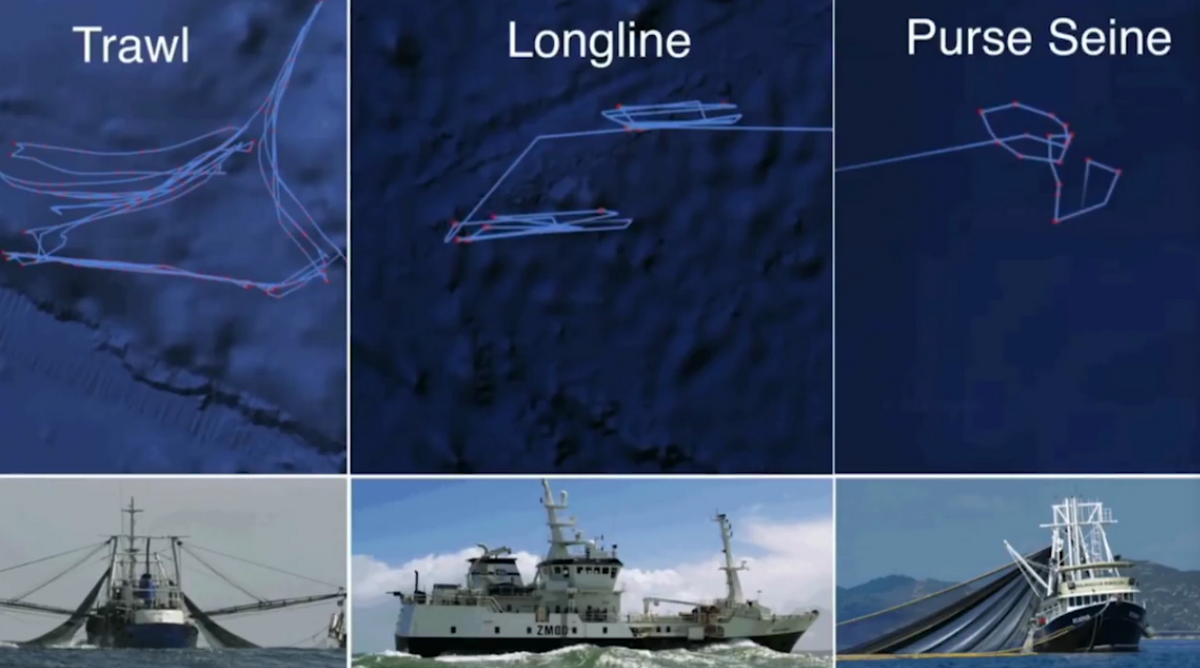
We can train a model to recognize the shapes of a vessel’s trajectory. Large vessels are required to use the automatic identification system, or AIS. The GPS-like transponders regularly broadcast a vessel’s maritime mobile service identity, or MMSI, and other critical information to nearby ships, as well as to terrestrial and satellite receivers. While AIS is designed to prevent collisions and boost overall safety at sea, it has turned out to be an invaluable system for monitoring vessels and detecting suspicious fishing behavior globally.

One tricky part is that the MMSI data location signal (which includes a timestamp, latitude, longitude, distance from port, and more) is not emitted at regular intervals. AIS broadcast frequency changes with vessel speed (faster at higher speeds), and not all AIS messages that are broadcast are received – terrestrial receivers require line-of-sight, satellites must be overhead, and high vessel density can cause signal interference. For example, AIS messages might be received frequently as a vessel leaves the docks and operates near shore, then less frequently as they move further offshore until satellite reception improves. This is challenging for a machine learning model to interpret. There are too many gaps in the data, which makes it hard to predict.
A way to solve this is to normalize the data and generate fixed-sized hourly windows. Then the model can predict if the vessel is fishing or not fishing for each hour.

It could be hard to know if a ship is fishing or not by just looking at its current position, speed, and direction. So we look at the data from the past as well, looking at the future could also be an option if we don’t need to do real time predictions. For this sample, it seemed reasonable to look 24 hours into the past to make a prediction. This means we need at least 25 hours of data to make a prediction for a single hour (24 hours in the past + 1 current hour). But we could predict longer time sequences as well. In general, to get hourly predictions, we need (n+24) hours of data.
Options to deploy and access the model
For this sample specifically we used Cloud Run to host the model as a web app so that other apps can call it to make predictions on an ongoing basis; this is our favorite in terms of pricing if you need to access your model from the internet over an extended period of time (charged per prediction request). You can also host it directly from Vertex AI where you trained and built the model, just note there is an hourly cost for using those VMs even if they are idle. If you do not need to access the model over the internet, you can make predictions locally or download the model onto a microcontroller if you have an IoT sensor strategy.

Want to go deeper?
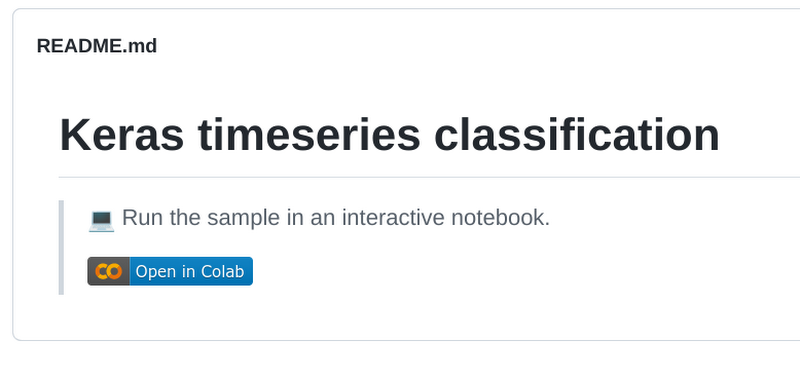
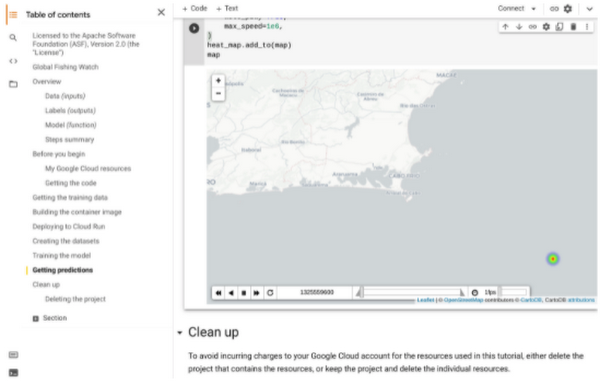
If you found this project interesting and would like to dive deeper either into the specifics of the thought process behind each step of this solution or even run through the code in your own project (or test project); we invite you to check out our interactive sample hosted on Colab, which is a free Jupyter notebook. It serves as a guide with all the steps to run the sample, including visualizing the predictions on a dynamically moving map using an open source Python library called Folium.
There’s no prior experience required! Just click “open in Colab” which is linked at the bottom of GitHub.
You will need a Google Cloud Platform project. If you do not have a Google Cloud project you can create one with the free $300 Google Cloud credit, you just need to ensure you set up billing, and later delete the project after testing the desired sample.
🌏🌎🌍 We hope to inspire you to build other beautiful climate-related solutions.
More Relevant Stories for Your Company

Upgrade Your Contact Center with Knowlarity’s AI-powered Speech Analytics for Higher CX
Did you know, everyday about 56 million hours worth of phone conversations, equalling to 420 billion spoken words are handled by contact centers? Knowlarity, a renowned cloud business communication service provider with nearly 6,000 customers and over a million virtual users, leverages AI-powered speech analytics that offer insights to gauge

Sainsbury’s Uses AI to Figure Out How the World Eats
Retail will forever be an industry that must constantly reinvent itself in response to, and anticipation of, ever-changing consumer demands. Digital transformation is fueling these changes and we've previously spoken about how businesses including Ulta Beauty and Kohl’s are taking advantage of Google Cloud to put data at the center of what they do
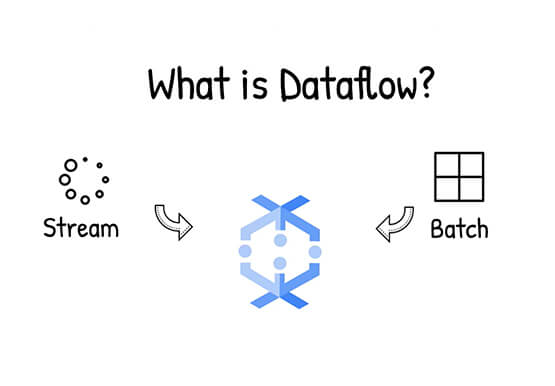

What is Dataflow?
What is Dataflow, and how can you use it for your data processing needs? In this episode of Google Cloud Drawing Board, Priyanka Vergadia walks you through Dataflow, a serverless system for processing and enriching data, supporting both streaming and batch models. Here's what's inside: 0:00 - 0:14 Video snapshot0:15

2022 Healthcare Trends: Healthcare Data, M&As, Better Patient Care, AI in Drug Development & Strategic Partnerships
The COVID-19 pandemic continues to push the healthcare and life sciences industry in entirely new ways. In record time, we’ve witnessed public health officials, vaccine developers, equipment manufacturers, and essential workers take life saving actions—regularly putting their own lives at risk—to respond to the exceptional challenges of our time. Yet
