





3978
Of your peers have already watched this video.
22:21 Minutes
The most insightful time you'll spend today!
Boosting Chrome OS adoption with effective change management
Can you remember the last time you asked a child to do something how did you convince them to do what you wanted? How many times did they ask you why probably more than once, right? So we know change is hard when we ask someone to make a change we’re asking a lot from them. Very often with IT projects we expect people to change, we don’t really think through the implications of this.
The purpose of this video is to guide you to migrate to Chromebooks and help you understand the reason why. When putting together your change management plan there’s a much larger chance of your project being able to deliver on its business objectives.
Introducing new technology into your organization is an exciting step. However, change management and workforce adoption of the new technology can be challenging. Get insights from Google’s Chrome Enterprise expert on change management strategies and best practices for increasing Chromebook adoption in your organization.
Center for Internet Security’s Latest Benchmark for Securing Chrome
5402
Of your peers have already read this article.
1:30 Minutes
The most insightful time you'll spend today!
As the way people work continues to evolve, keeping security policies in place that protect organizations but give workers the ability to get things done is more important than ever. IT and security teams must aim to stay a step ahead of web-based security threats that come their organization’s way. To help, the Center for Internet Security (CIS) team has released the latest CIS Benchmark 2.1 for Google Chrome. This Benchmark offers independent recommendations on which Chrome policies to configure to help support organizations’ security and compliance needs. Thanks to Chrome being built with security at its core, in many cases, Chrome default settings are aligned with CIS recommendations.
Chrome is secure by default, but we also pride ourselves on providing customizations for enterprises to allow Chrome to better fit the needs of their business. And with hundreds of policies available through Chrome Browser Cloud Management and Group Policy Objects (Note: The CIS Benchmark is also available as a GPO), organizations can do just that.
Throughout the CIS guide you’ll notice that there are different designations for configuration profiles. Any labeled Level 1, are considered to be a good baseline for an organization. Level 2 profiles are recommended for deployments that require the highest level of security, but note that these settings could have a trade off on user productivity. We recommend looking at each setting and determining if it’s a good fit for your business.
The benchmark is made up of five sections:
- Enforced Defaults — Notes policies that are configured by default when you install Chrome. Enforcing these settings at an enterprise level can prevent these settings from being changed by business users to less secure options.
- Attack Surface Reduction — Details how to disable web features that may not be necessary in your enterprise environment and could reduce your overall attack surface.
- Privacy — Surfaces settings that improve user privacy.
- Data Loss Prevention — Contains settings that can help prevent data loss and protect your organization’s data. (Note: These recommendations cover additional capabilities that can be added to Chrome through BeyondCorp Enterprise).
- Forensics (Post Incident) — Shares recommendations on policies that give insights into post incident forensics and analysis.
Organizations can use these benchmarks to optimize the best way to secure Chrome in their environment. Download the CIS Benchmark here and check out our team’s configuration guide for additional recommendations on how to configure Chrome.
Note: This benchmark was created using a consensus review process composed of subject matter experts. Consensus participants provide perspective from a diverse set of backgrounds such as consulting, software development, audit and compliance, security research, operations, government, and legal. While these recommendations come from a trusted source, it’s important for each organization to weigh which policies make the most sense for their business.
Google Meet on Glass: A New Way of Collaborating Teams with Video Meetings in Real-time

3815
Of your peers have already read this article.
1:30 Minutes
The most insightful time you'll spend today!
Open beta now available to all Google Workspace customers
Seeing is believing. For many service technicians, trainers, and other frontline workers, the ability to share a real-time view of what they can see with their virtual clients or teams can make all the difference. That’s what we’ve heard from global participants in the closed beta of Google Meet running on Glass Enterprise Edition 2 that we announced last year.
Starting today, we’re making Google Meet on Glass Enterprise Edition 2 (Meet on Glass) more broadly available through an open beta. Any Google Workspace customer around the world can now give their employees, suppliers, and partners greater sight with Glass—using the simple and intuitive Google Meet environment they’re already used to. With Meet on Glass, meeting participants can experience a first-person view of the Glass wearer’s perspective and collaborate with the entire video meeting in real time.

Making it easier to solve hard problems
Customers who’ve been testing Meet on Glass are linking their teams across geographies to collaborate in new ways and solve problems together. In the US, real estate services group CBRE has implemented Meet on Glass to allow employees at job sites to connect with HQ teams and project managers. Connecting the whole team with live video from the frontline is allowing faster decision making and clearer communications between team members.
To be successful, remote assistance via video call must be simple and seamless. CBRE and other early customers have shared that they don’t want their workers to have to become technical experts to use video collaboration in this way. Ease of use—both for Google Meet and for Glass—and speed to join a video meeting are top priorities for them. And with Google Workspace integration, their teams can now join Calendar events directly from Glass with just a few taps. No complex signing in or scanning codes are required; users simply choose from their calendar on Glass to instantly join the meeting.
Getting Google Meet on Glass Enterprise Edition 2
The Meet team is working with the community of Google Workspace partners to enable Google Meet on Glass Enterprise Edition 2 for customers in North America, Europe, and Australia. Customers in Japan can now also get Glass through a first-of-its-kind partnership with NTT DOCOMO, which can provide Meet on Glass directly to its customers in Japan. After extensive testing, NTT DOCOMO chose Google Meet on Glass as the preferred solution for their business customers who want frontline collaboration solutions for their enterprises.
Meet on Glass is one of the ways we’re bringing powerful new video conferencing experiences to customers around the world, regardless of the devices they’re using to connect and collaborate with their teams. When combined with our Google meet hardware and peripherals, the possibilities for real-time connection and problem solving are even greater. And it’s part of our ongoing commitment to creating innovative and immersive meeting experiences that help people feel like they’re working together, not just meeting together.
Sign up now to participate in the Google Meet on Glass Enterprise Edition 2 open beta.

6310
Of your peers have already downloaded this article
4:04 Minutes
The most insightful time you'll spend today!
When it comes to data analysis, it’s easy to fall into routine. But no matter how much of a whiz you are at formulas or pivot tables, superb spreadsheet skills only take you so far if you’re working with multiple versions or outdated datasets.
On average, your employees spend up to eight hours each week—an entire work day—searching for and consolidating information.
What if businesses spent their time applying data insights instead of tracking them down?
Working in the cloud means your data can easily stay up to date because information is automatically saved as it’s typed. Multiple team members can collaborate in real-time from their phone, tablet or computer (online and offline) and create a single source of truth for projects, like quarterly budgets.
Powered by Google’s machine intelligence, Sheets does a lot
of the heavy
lifting for you when it comes to data analysis. You can ask a question
about your data and Sheets will return an answer using natural language
processing. Sheets also builds
charts, suggests
formulas and creates
pivot tables for you.
3918
Of your peers have already watched this video.
26:56 Minutes
The most insightful time you'll spend today!
Teamwork from anywhere: G Suite’s vision for content collaboration
So the world has changed. We all know that the COVID-19 pandemic has fundamentally shifted where we work, when we work, and how we work.
And during this time period, there has been a dramatic increase in the number of people working from home. It went from just 13% before to 47% in April 2020. And these numbers are likely to be greater today with upcoming fluctuations as companies figure out how to return to work. We are all now operating in this new normal together.
Overnight, we lost the ability to build face-to-face connections with our teams, to work hand-in-hand on a project in the same room with the real-time back and forth exchange of ideas, and to just be able to stop by someone’s desk to ask them for feedback on a document.
Now, our need to collaborate and operate effectively as a team hasn’t changed through all this. But being remote has made that so much harder. And in this new environment, virtual collaboration is no longer just a strategic priority. But needs to be a necessity for all organizations. Now across the entire world, we saw organizations had to react quickly to the disruptions that were caused by COVID-19 in order to keep going.
In this video, find out how teams across the world are collaborating to enable faster decision-making, increasing productivity, and enhancing customer experience.
CARTO’s Data Visualization Powered by Google Cloud and deck.g

4088
Of your peers have already read this article.
7:00 Minutes
The most insightful time you'll spend today!
Editor’s note: Today’s blog post is from Alberto Asuero, CTO of CARTO, the location intelligence platform. Today he shares more details about the source of the data for advanced data visualizations created with Google Maps Platform and deck.gl and how the CARTO platform enables this workflow.
During Google Cloud Next in October, the Google team announced the newest release of the deck.gl visualization library, thanks to a collaboration with our geospatial company CARTO and the vis.gl Technical Steering Committee (TSC). The deck.gl release includes a deep integration with the new WebGL-powered features in the Maps JavaScript API that allows deck.gl to render 2D and 3D visualizations directly on the Google basemap.
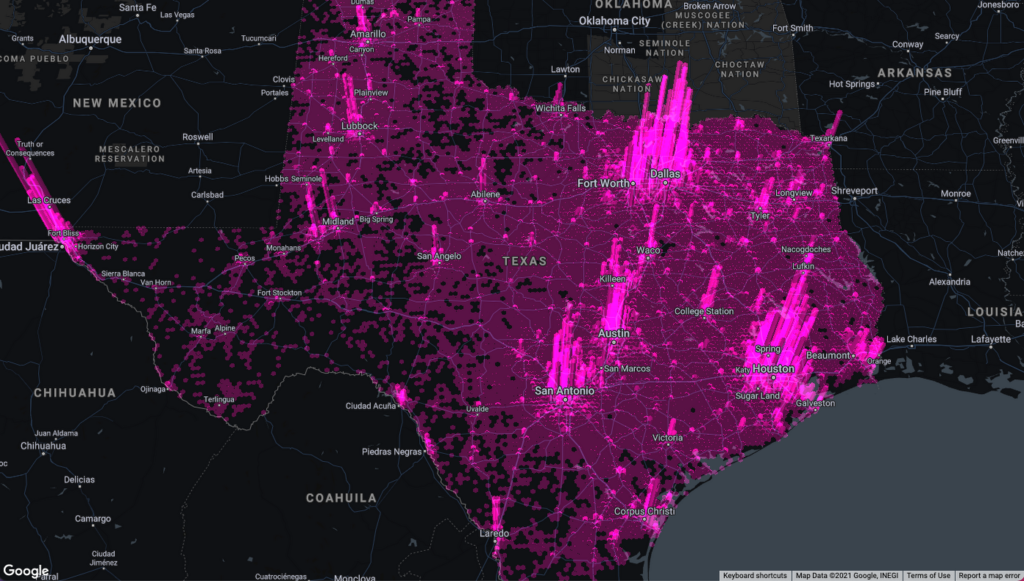
Our team built an example app that visualizes a variety of data sources that show the potential for electrification of truck fleets in Texas. This app showcases the different types of advanced data visualizations that can be created with Google Maps Platform and deck.gl. Today, I want to share more details about the source of the data for these visualizations and how the CARTO platform enables this workflow.
Google Cloud provides a strong serverless data warehousing solution, BigQuery, with support for geospatial queries. When you are dealing with spatial data, creating maps to explore and visualize these datasets is an important and common need. The CARTO Spatial Extension for BigQuery provides an easy way to create connections to the data warehouse, design a map with data coming from BigQuery tables, and then add these visualizations to a web app using deck.gl.
Making a simple map
To create a simple map using the CARTO platform, you can sign up for a trial account. Once you have signed in, you can set up a connection to your BigQuery instance using a service account. Then, you can go to the Data Explorer and browse the available datasets to find the table you want to use as the datasource in your map. For more information, check out the CARTO documentation.
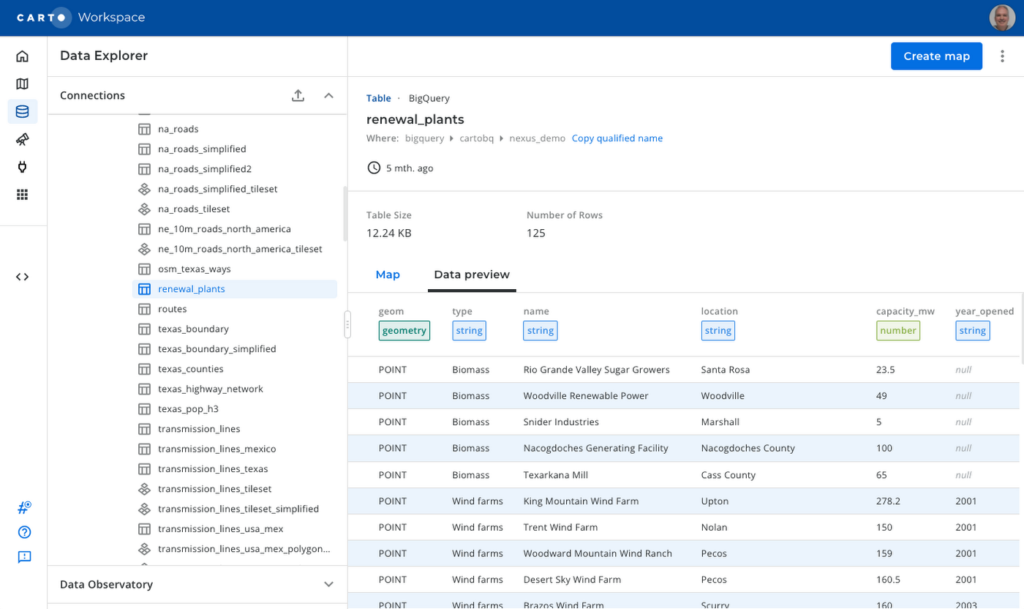
To create a visualization of power transmission lines in Texas, you can start with the Texas state boundary to provide some context. In the Data Explorer, you can preview the table and click the “Create map” button in the top-right corner to start designing your visualization.
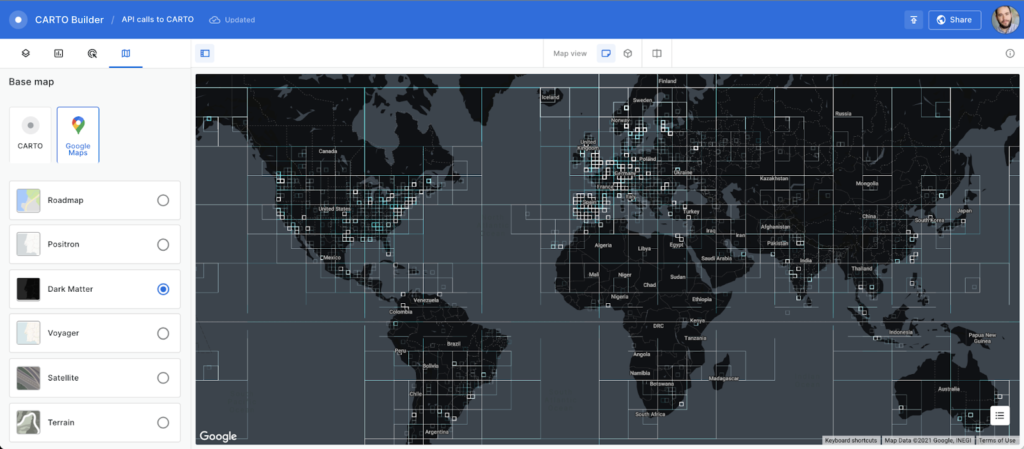
Using the CARTO Builder map making tool, select one of the available Google vector basemap styles and customize the layer style.
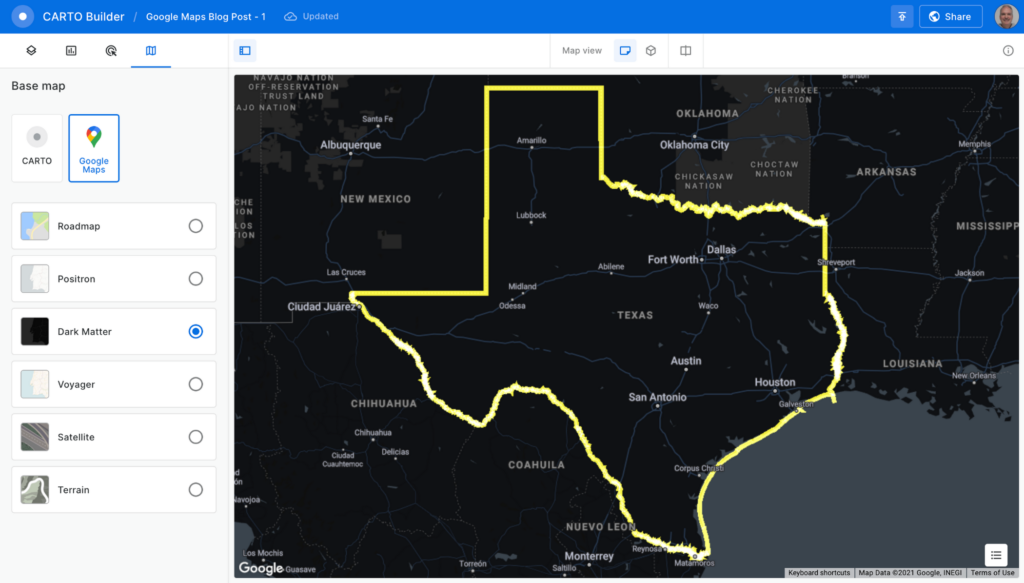
You can visualize tables and the results from queries executed in the data warehouse, which is a powerful feature because you can also execute spatial analysis functions using SQL, including those from the CARTO Analytics Toolbox. In this case, you can intersect the lines in the table containing all the U.S. transmission lines within the Texas boundary. Click on the “Add source from…” button and select the “Custom Query (SQL)” option to add the following query:
SELECT *FROM cartobq.nexus_demo.transmission_linesWHERE ST_INTERSECTS(geometry,(SELECT geom FROM cartobq.nexus_demo.texas_boundary_simplified));
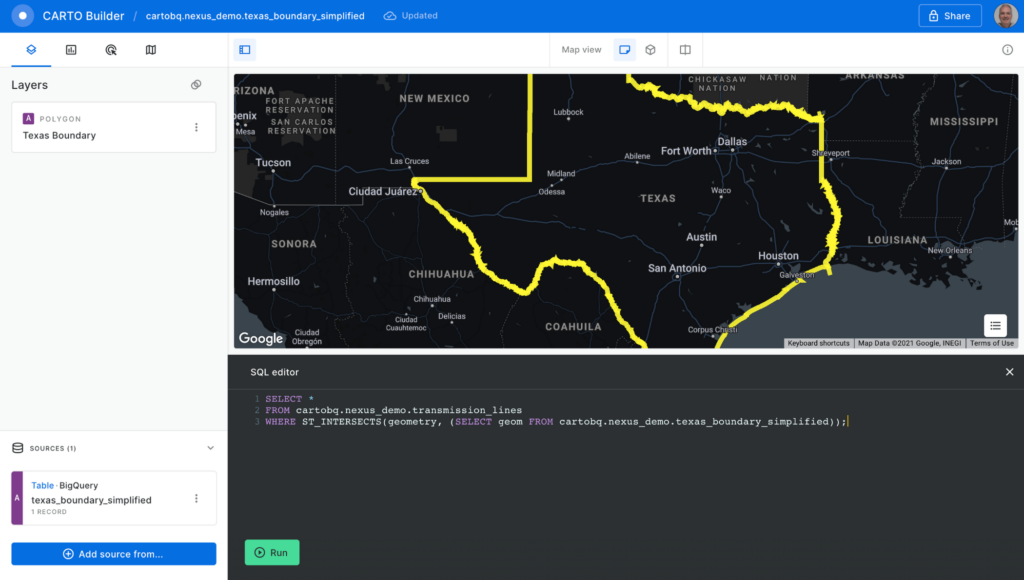
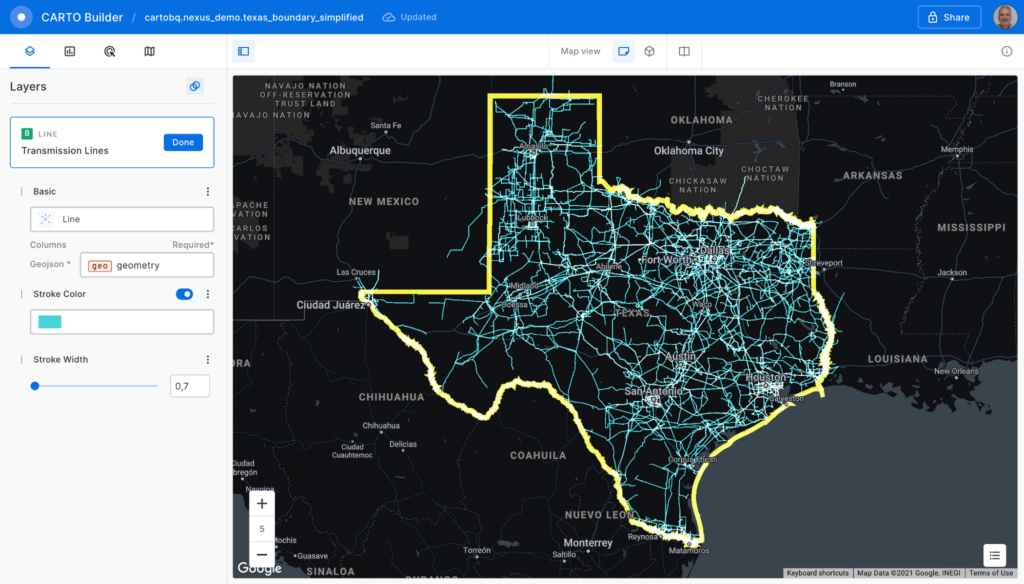
Click the “Run” button, and the query is executed in BigQuery. The results are sent back to the Builder tool. Perform some style customizations in the new layer, and your map is ready.
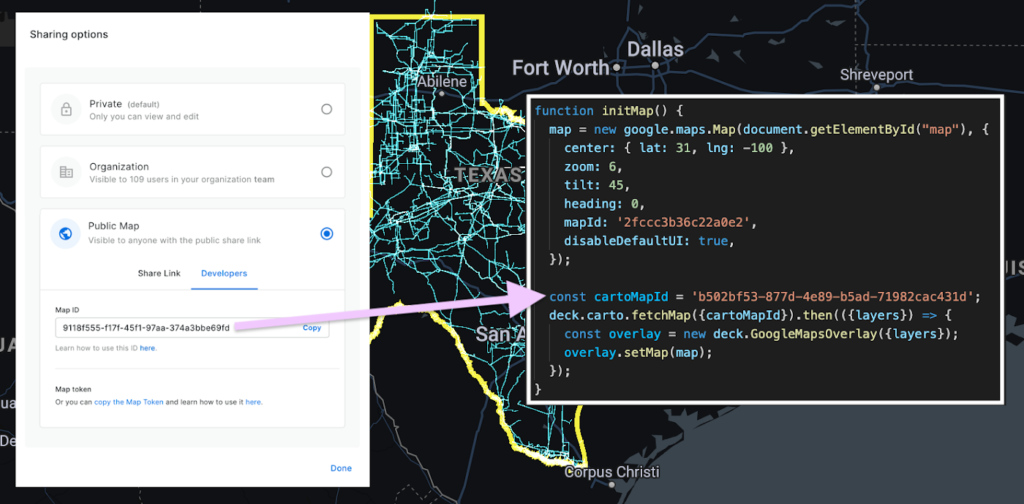
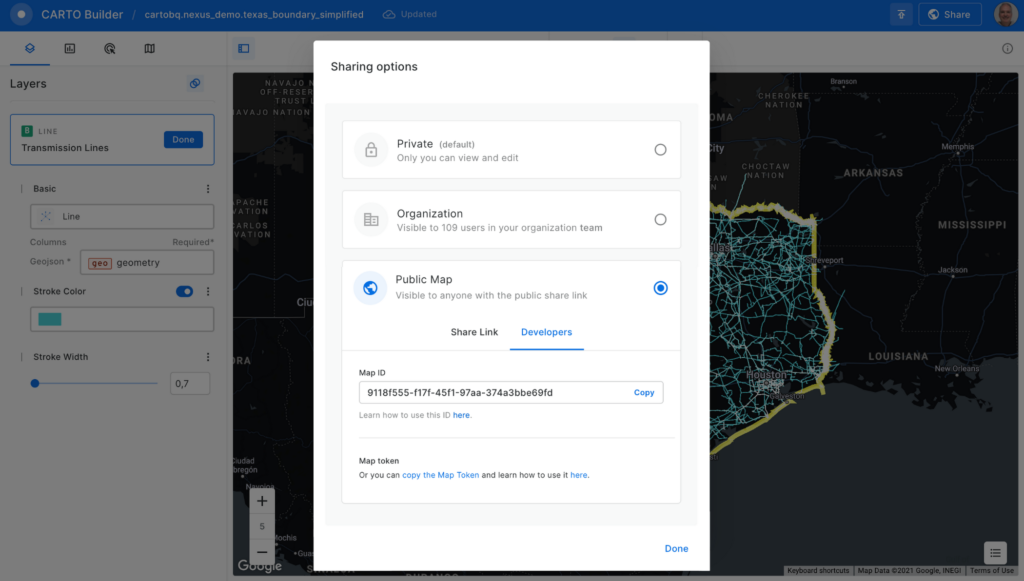
Before adding the map to the Google Maps Platform application, you’ll need to make it public. Click on the “Share” button and select the “Developers” tab to copy the map ID.
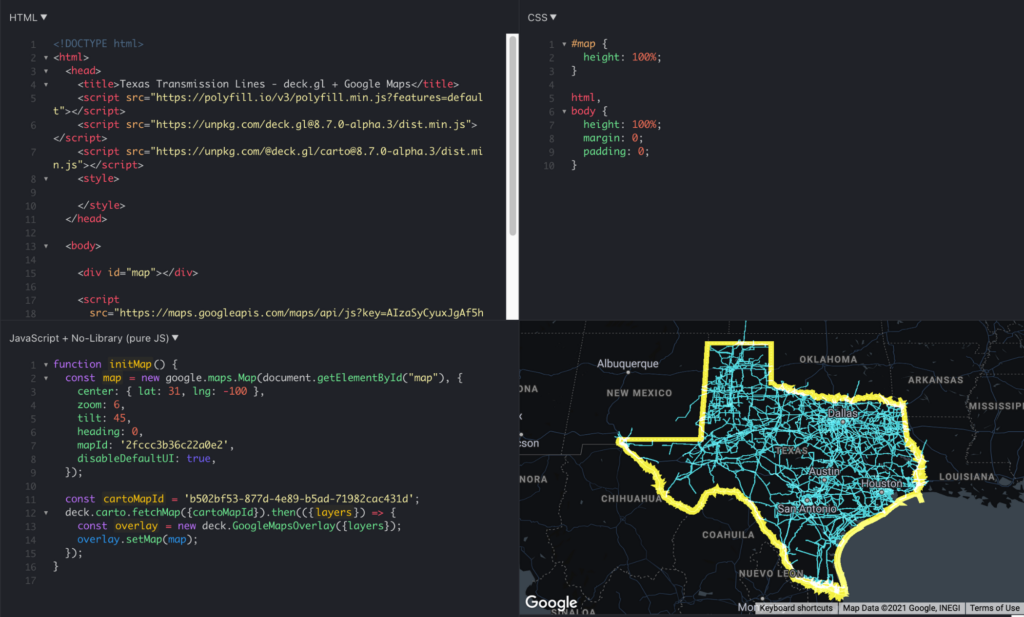
Now, you can add the visualization into your Google Maps Platform application, which is as easy as adding these four lines of code:
const cartoMapId = 'b502bf53-877d-4e89-b5ad-71982cac431d'; deck.carto.fetchMap({cartoMapId}).then(({layers}) => { const overlay = new deck.GoogleMapsOverlay({layers}); overlay.setMap(map); });
You can use the map ID copied from CARTO Builder to call the fetchMap function. This function connects to the platform and retrieves all the information needed for the visualization, including a collection of deck.gl layers with all the styling properties you’ve specified. Create an instance of the deck.gl GoogleMapsOverlay with this collection of layers and add it to the map.
You can see the full example in this fiddle.
Visualizing very large datasets
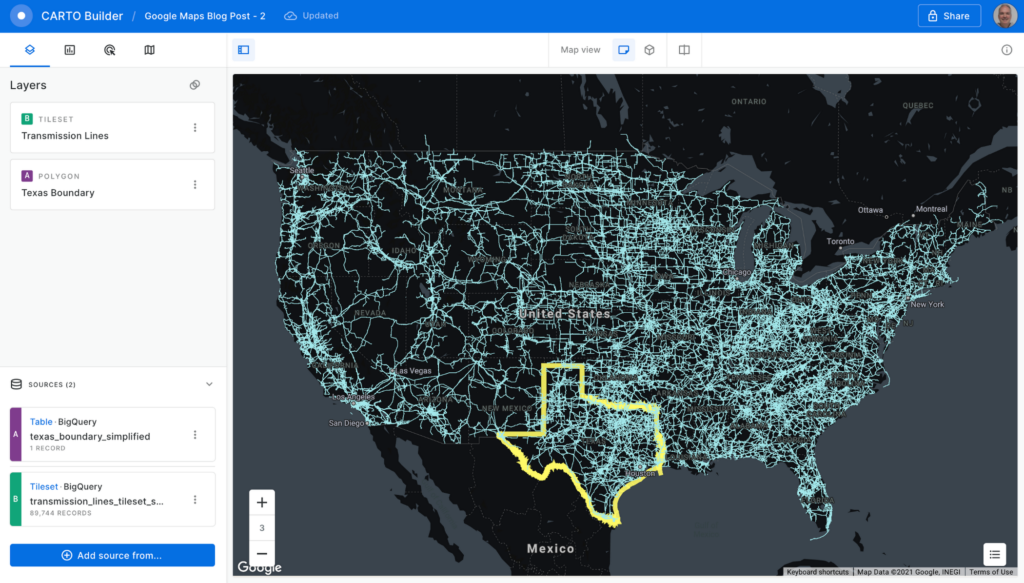
One of the main features of BigQuery is the ability to scale processing to massive datasets. With the CARTO platform, you can also visualize very large datasets using tilesets, an optimized data structure containing pre-generated vector tiles for fast visualization. Tilesets are generated within BigQuery using the Analytics Toolbox functions in a parallelized process that can handle billions of points.
For example, you can create a visualization using tilesets with the whole dataset of transmission lines for the U.S., more than 100MB of geometries.
The issue with these large datasets is that they do not fit in memory all at once, so you need to split them into tiles for them to be rendered progressively. CARTO takes care of this, allowing you to create tilesets directly in BigQuery or dynamically generate them on the fly.
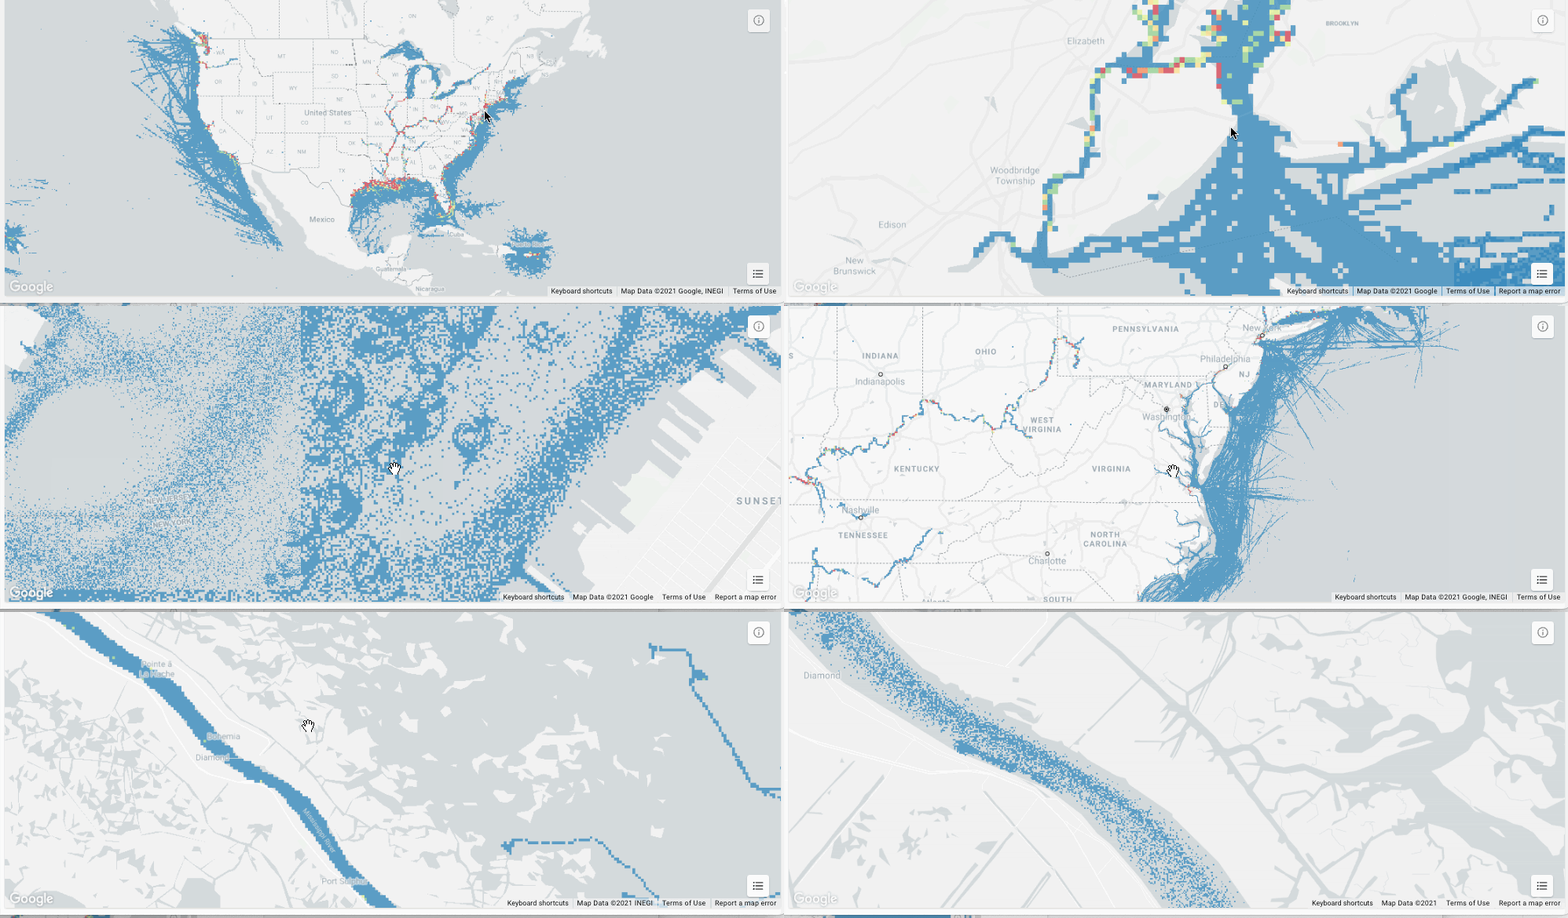
This method for data loading in maps can scale as much as needed; for example, take a look at this 17 billion point visualization of vessel data.
What about live data?
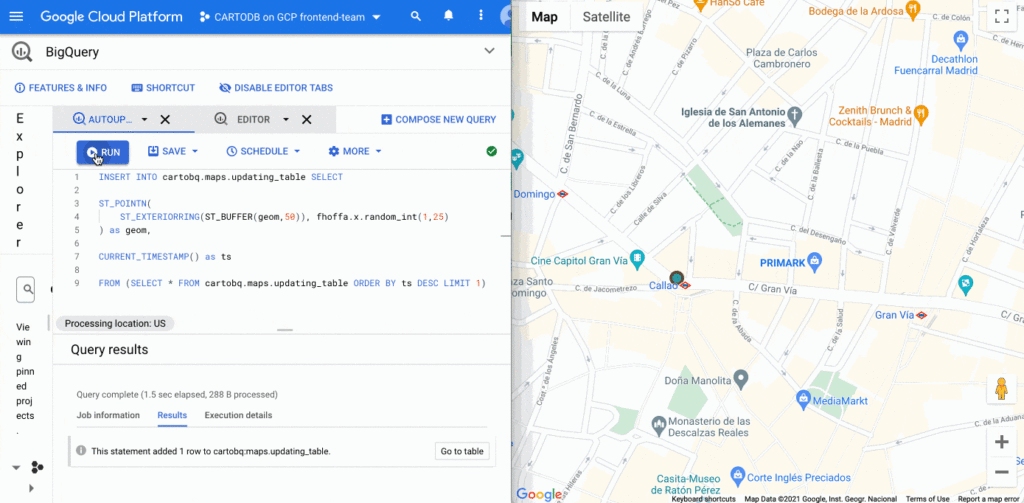
BigQuery supports streaming data that is continuously updated. In these scenarios, you want to be able to update your visualization at regular intervals, as the data changes. It’s easy to update this visualization using deck.gl. You just need to set the autoRefresh parameter to true when fetching the map and specify the function you want to execute when new data is downloaded:
const {layers} = await deck.carto.fetchMap({ cartoMapId, autoRefresh: true, onNewData: (parsedMap) => { … } });
You can add points to a table with an INSERT function on the BigQuery console and see the data updated on the map in real time.
Going further
In addition to the simple ways to create visualizations shown above, deck.gl has the flexibility to create a wide variety of visualizations. The CARTO platform provides you with the functionality to access data from your data warehouse and create these data visualizations with advanced cartographic capabilities, but you can extend it and go beyond that using any of the advanced visualizations available in the deck.gl layer catalog.
There are two additional options that give you more control over the deck.gl code. The first one is to use the CartoLayer directly without fetchMap. You’ll need to indicate the connection to use from the CARTO platform and the data source type and name or query. Then we can specify the styling properties.
const overlay = new deck.GoogleMapsOverlay({layers: [new deck.carto.CartoLayer({connection: 'bqconn',type: deck.carto.MAP_TYPES.TABLE,data: `cartobq.public_account.retail_stores`,getFillColor: [238, 77, 90],pointRadiusMinPixels: 6,}),],});
The second option is to use the fetchLayerData function that allows you to have more control over the format used for data transfer between BigQuery and your application and can be used with advanced visualizations that require an specific data format like ArcLayer, H3HexagonLayer or TripsLayer.
deck.carto.fetchLayerData({type: deck.carto.MAP_TYPES.TABLE,source: `cartobq.geo_for_good_meetup.texas_pop_h3`,connection: 'bqconn',format: deck.carto.FORMATS.JSON,credentials: {accessToken: 'eyJhbGciOiJIUzI1NiJ9.eyJhIjoiYWNfbHFlM3p3Z3UiLCJqdGkiOiI1YjI0OWE2ZCJ9.Y7zB30NJFzq5fPv8W5nkoH5lPXFWQP0uywDtqUg8y8c'}}).then(({data}) => {const layers= [new deck.H3HexagonLayer({id: 'h3-hexagon-layer',data,extruded: true,getHexagon: d => d.h3,getFillColor: [182, 0, 119, 150],getElevation: d => d.pop,elevationScale: 2.5,parameters: {blendFunc: [luma.GL.SRC_ALPHA, luma.GL.DST_ALPHA],blendEquation: luma.GL.FUNC_ADD}})];const overlay = new deck.GoogleMapsOverlay({layers});overlay.setMap(map);});
For complete code using both options, take a look at these examples.
Learn more
You can access demos and documentation on the deck.gl docs website and the CARTO Documentation Center. If you have questions, you can ping the CARTO team on the CARTO Users Slack workspace.
For more information on Google Maps Platform, visit the Google Maps Platform website.
More Relevant Stories for Your Company

An Expert’s Guide to Productivity and Well-being while Embracing WFH and Hybrid Style
Driving impact over output in a new era of work As Google’s productivity advisor, I spend a lot of time coaching executives on ways they can make the most of their work day. Over the years, people have come to me with very different ideas about what productivity is, why

Google Dataflow Named Leader in The 2021 Forrester Wave™: Streaming Analytics
We are excited to announce that Google has been named a Leader in The Forrester Wave™: Streaming Analytics, Q2 2021 report. Thank you to our strong community of customers and partners for working with us to deliver a customer focused product. We believe Forrester’s recognition is an acknowledgement of our leadership


On-Demand Webinar: The Underrated Impact of Real-Time Collaboration on Your Business
There comes a time in your life when you have to build that dreaded sales report, once a month. That’s the stuff of nightmares. First, you need to gather data from multiple sources, sometimes multiple, siloed sheets, different departments, numerous salespeople, and wait endlessly. That’s time-consuming. Then you have to

Cloud-Native Observability: Google Cloud and Chronosphere Join Forces
As digital transformation continues apace, cloud native adoption has skyrocketed — and so has the volume, velocity, and variety of data that organizations must monitor to maintain visibility over their IT environments. Rather than a fixed number of virtual machines (VMs) running a single application each, systems are more flexible
