






How Domino’s Increased Monthly Revenue By 6% with Google Marketing Platform
READ FULL INTRODOWNLOAD AGAIN5761
Of your peers have already downloaded this article
1:30 Minutes
The most insightful time you'll spend today!

Upgrade Your Contact Center with Knowlarity’s AI-powered Speech Analytics for Higher CX
DOWNLOAD E-BOOK6202
Of your peers have already downloaded this article
7:00 Minutes
The most insightful time you'll spend today!
Did you know, everyday about 56 million hours worth of phone conversations, equalling to 420 billion spoken words are handled by contact centers? Knowlarity, a renowned cloud business communication service provider with nearly 6,000 customers and over a million virtual users, leverages AI-powered speech analytics that offer insights to gauge customer preferences and emotions, campaign performance, agent’s effectiveness and much more. Knowlarity’s programmatic speech analytics platform is built with Google Cloud to optimize contact center performance by transcribing and analyzing millions of calls to impact savings, operations, CX, customer loyalty and retention, and revenue generation.
Download the e-Book to learn more about Knowlarity’s speech analytics for your business’ contact centers and elevate your agents’ performance by leveraging ML, natural language processing (NLP) and AI capabilities.
Wayfair: Carving the path towards MLOps excellence with Vertex AI

2796
Of your peers have already read this article.
1:30 Minutes
The most insightful time you'll spend today!
Editor’s note: In part one of this blog, Wayfair shared how it supports each of its 30 million active customers using machine learning (ML). Wayfair’s Vinay Narayana, Head of ML Engineering, Bas Geerdink, Lead ML Engineer, and Christian Rehm, Senior Machine Learning Engineer, take us on a deeper dive into the ways Wayfair’s data scientists are using Vertex AI to improve model productionization, serving, and operational readiness velocity. The authors would like to thank Hasan Khan, Principal Architect, Google for contributions to this blog.
When Google announced its Vertex AI platform in 2021, the timing coincided perfectly with our search for a comprehensive and reliable AI Platform. Although we’d been working on our migration to Google Cloud over the previous couple of years, we knew that our work wouldn’t be complete once we were in the cloud. We’d simply be ready to take one more step in our workload modernization efforts, and move away from deploying and serving our ML models using legacy infrastructure components that struggle with stability and operational overhead. This has been a crucial part of our journey towards MLOps excellence, in which Vertex AI has proved to be of great support.
Carving the path towards MLOps excellence
Our MLOps vision at Wayfair is to deliver tools that support the collaboration between our internal teams, and enable data scientists to access reliable data while automating data processing, model training, evaluation and validation. Data scientists need autonomy to productionize their models for batch or online serving, and to continuously monitor their data and models in production. Our aim with Vertex AI is to empower data scientists to productionize models and easily monitor and evolve them without depending on engineers. Vertex AI gives us the infrastructure to do this with tools for training, validating, and deploying ML models and pipelines.
Previously, our lack of a comprehensive AI platform resulted in every data science team having to build their own unique model productionization processes on legacy infrastructure components. We also lacked a centralized feature store, which could benefit all ML projects at Wayfair. With this in mind, we chose to focus our initial adoption of the Vertex AI platform on its Feature Store component.
An initial POC confirmed that data scientists can easily get features from the Feature Store for training models, and that it makes it very easy to serve the models for batch or online inference with a single line of code. The Feature Store also automatically manages performance for batch and online requests. These results encouraged us to evaluate the adoption of Vertex AI Pipelines next, as the existing tech for workflow orchestration at Wayfair slowed us down greatly. As it turns out, both of these services are fundamental to several models we build and serve at Wayfair today.
Empowering data scientists to focus on building world-class ML models
Since adopting Vertex AI Feature Store and AI Pipelines, we’ve added a couple of capabilities at Wayfair to significantly improve our user experience and lower the bar to entry for data scientists to leverage Vertex AI and all it has to offer:
- Building a CI/CD and scheduling pipeline
Working with the Google team, we built an efficient CI/CD and scheduling pipeline based on the common tools and best practices at Wayfair and Google. This enables us to release Vertex AI Pipelines to our test and production environments, leveraging cloud-native services.
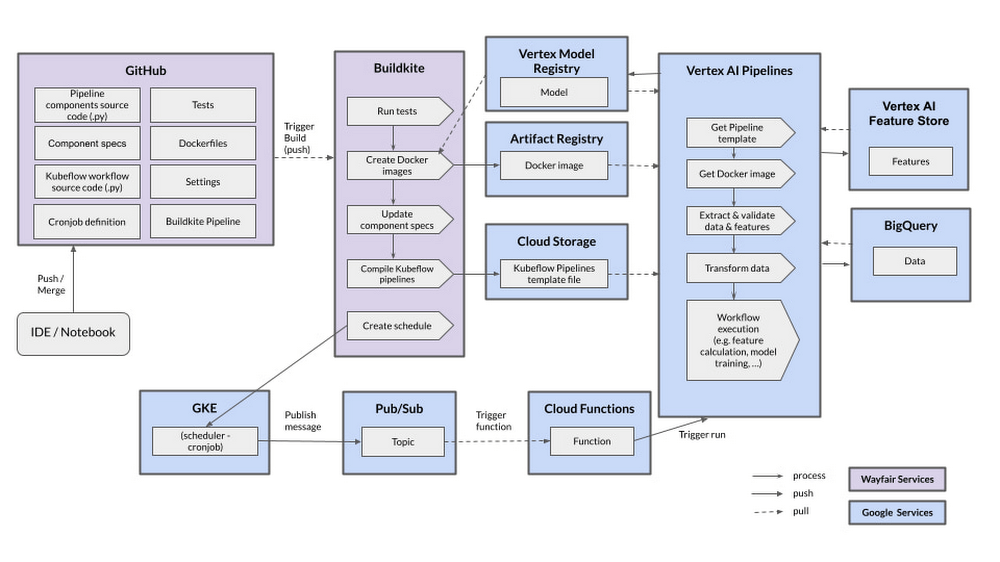
Keeping in mind that all our code is managed in GitHub Enterprise, we have dedicated repositories for Vertex AI Pipelines where the Kubeflow code and definitions of the Docker images are stored. If a change is pushed to a branch, a build starts in the Buildkite tool automatically. The build contains several steps, including unit and integration tests, code linting, documentation generation and automated deployment. The most important artifacts that are released at the end of the build are the Docker image and the compiled Kubeflow template. The Docker image is released to the Google Cloud Artifact Registry and we store the Kubeflow template in a dedicated Google Cloud Storage Bucket, fully versioned and secured. This way, all the components we need to run a Vertex AI Pipeline are available once we run a pipeline (manually or scheduled).
To schedule pipelines, we developed a dedicated Cloud Function that has the permissions to run the pipeline. This Function listens to a Pub/Sub topic where we can publish messages with a defined schema that indicates which pipeline to run with which parameters. These messages are published from a simple cron job that runs according to a set schedule on Google Kubernetes Engine. This way, we have a decoupled and secure environment for scheduling pipelines, using fully-supported and managed infrastructure.
Abstracting Vertex AI services with a shared library
We abstracted the relevant Vertex AI services currently in use with a thin shared Python library to support the teams that develop new software or migrate to Vertex AI. This library, called wf-vertex, contains helper methods, examples, and documentation for working with Vertex AI, as well as guidelines for Vertex AI Feature Store, Pipelines, and Artifact Registry.
One example is the run_pipeline method, which publishes a message with the correct schema to the Pub/Sub topic so that a Vertex AI pipeline is executed. When scheduling a pipeline, the developer only needs to call this method without having to worry about security or infrastructure configuration:
@cli.command()
def trigger_pipeline() -> None:
    from wf_vertex.pipelines.pipeline_runner import run_pipeline

    run_pipeline(
       template_bucket= f"wf-vertex-pipelines-{env}/{TEAM}",  # this is the location of the template, where the CI/CD has written the compiled templates to
       template_filename="sample_pipeline.json",  # this is the filename of the pipeline template to run
       parameter_values= {"import_date": today()}  # it’s possible to add pipeline parameters
)
Most notable is the establishment of a documented best practice for enabling hyperparameter tuning in Vertex AI Pipelines, which speeds up hyperparameter tuning times for our data scientists from two weeks to under one hour.
Because it is not yet possible to combine the outputs of parallel steps (components) in Kubeflow, we designed a mechanism to enable this. It entails defining parameters at runtime and executing the resulting steps in parallel via the Kubeflow parallel-for operator. Finally, we created a step to combine the results of these parallel steps and interpret the results. In turn, this mechanism allows us to select the best model in terms of accuracy from a set of candidates that are trained in parallel:
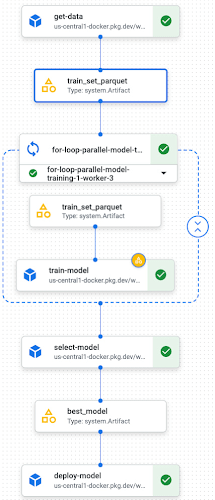
Our CI/CD, scheduling pipelines, and shared library have reduced the effort of model productionization from more than three months to about four weeks. As we continue to build the shared library, and as our team members continue to gain expertise in using Vertex AI, we expect to further reduce this time to two weeks by the end of 2022.
Looking forward to more MLOps capabilities
Looking ahead, our goal is to fully leverage all the Vertex AI features to continue modernizing our MLOps stack to a point where data scientists are fully autonomous from engineers for any of their model productionization efforts. Next on our radar are Vertex AI Model Registry and Vertex ML Metadata alongside making more use of AutoML capabilities. We’re experimenting with Vertex AI for AutoML models and endpoints to benefit some use cases at Wayfair next to the custom models that we’re currently serving in production.
We’re confident that our MLOps transformation will introduce several capabilities to our team, including: automated data and model monitoring steps to the pipeline, as well as metadata management, and architectural patterns in support of real-time models requiring access to Wayfair’s network. We also look forward to performing continuous training of models by fully automating the ML pipeline that allows us to achieve continuous integration, delivery, and deployment of model prediction services.
We’ll continue to collaborate and invest in building a robust Wayfair-focused Vertex AI shared library. The aim is to eventually migrate 100% of our batch models to Vertex AI. Great things to look forward to on our journey towards MLOps excellence.
BigQuery ML for Sentiment Analysis: How to Make the Most of Your Data

1805
Of your peers have already read this article.
4:30 Minutes
The most insightful time you'll spend today!
Introduction
We recently announced BigQuery support for sparse features which help users to store and process the sparse features efficiently while working with them. That functionality enables users to represent sparse tensors and train machine learning models directly in the BigQuery environment. Being able to represent sparse tensors is a useful feature because sparse tensors are used extensively in encoding schemes like TF-IDF as part of data pre-processing in NLP applications and for pre-processing images with a lot of dark pixels in computer vision applications.
There are numerous applications of sparse features such as text generation and sentiment analysis. In this blog, we’ll demonstrate how to perform sentiment analysis with the space features in BigQuery ML by training and inferencing machine learning models using a public dataset. This blog also highlights how easy it is to work with unstructured text data on BigQuery, an environment traditionally used for structured data.
Using sample IMDb dataset
Let’s say you want to conduct a sentiment analysis on movie reviews from the IMDb website. For the benefit of readers who want to follow along, we will be using the IMDb reviews dataset from BigQuery public datasets. Let’s look at the top 2 rows of the dataset.
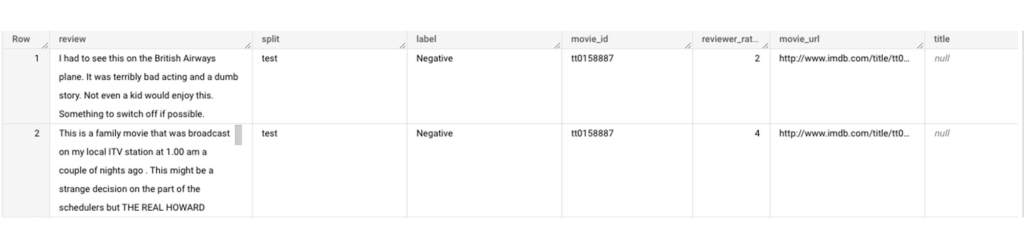
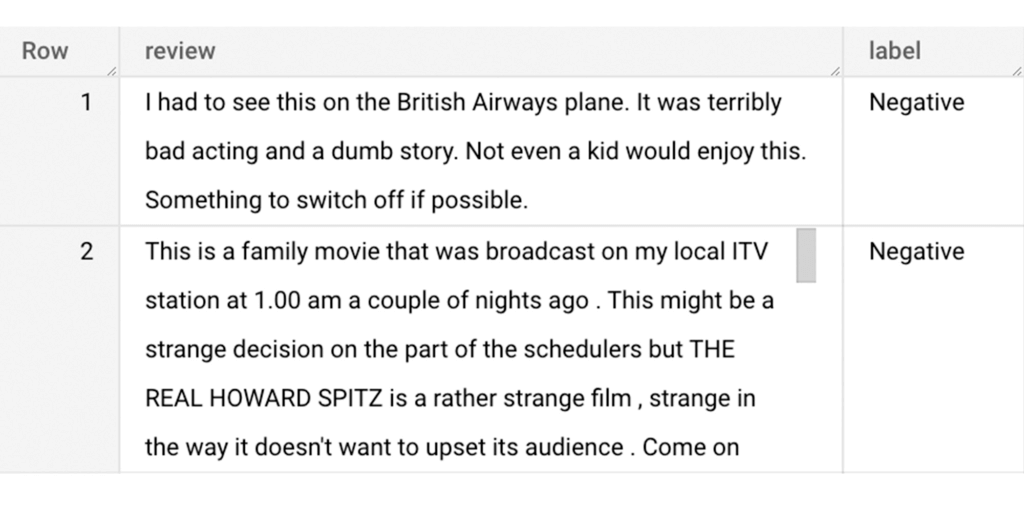
Although the reviews table has 7 columns, we only use reviews and label columns to perform sentiment analysis for this case. Also, we are only considering negative and positive values in the label columns. The following query can be used to select only the required information from the dataset.
SELECT
 review,
 label,
FROM
 `bigquery-public-data.imdb.reviews`
WHERE
 label IN ('Negative', 'Positive')
The top 2 rows of the result is as follows:
Methodology
Based on the dataset that we have, the following steps will be carried out:
- Build a vocabulary list using the review column
- Convert the review column into sparse tensors
- Train a classification model using the sparse tensors to predict the label (“positive” or “negative”)
- Make predictions on new test data to classify reviews as positive or negative.
Feature engineering
In this section, we will convert the text from the reviews column to numerical features so that we can feed them into a machine learning model. One of the ways is the bag-of-words approach where we build a vocabulary using the words from the reviews and select the most common words to build numerical features for model training. But first, we must extract the words from each review. The following code creates a dataset and a table with row numbers and extracted words from reviews.
-- Create a dataset named `sparse_features_demo` if doesn’t exist
CREATE SCHEMA IF NOT EXISTS sparse_features_demo;


-- Select unique reviews with only negative and positive labels
CREATE OR REPLACE TABLE sparse_features_demo.processed_reviews AS (
 SELECT
   ROW_NUMBER() OVER () AS review_number,
   review,
   REGEXP_EXTRACT_ALL(LOWER(review), '[a-z]{2,}') AS words,
   label,
   split
 FROM (
   SELECT
     DISTINCT review,
     label,
     split
   FROM
     `bigquery-public-data.imdb.reviews`
   WHERE
     label IN ('Negative', 'Positive')
 )
);
The output table from the query above should look like this:
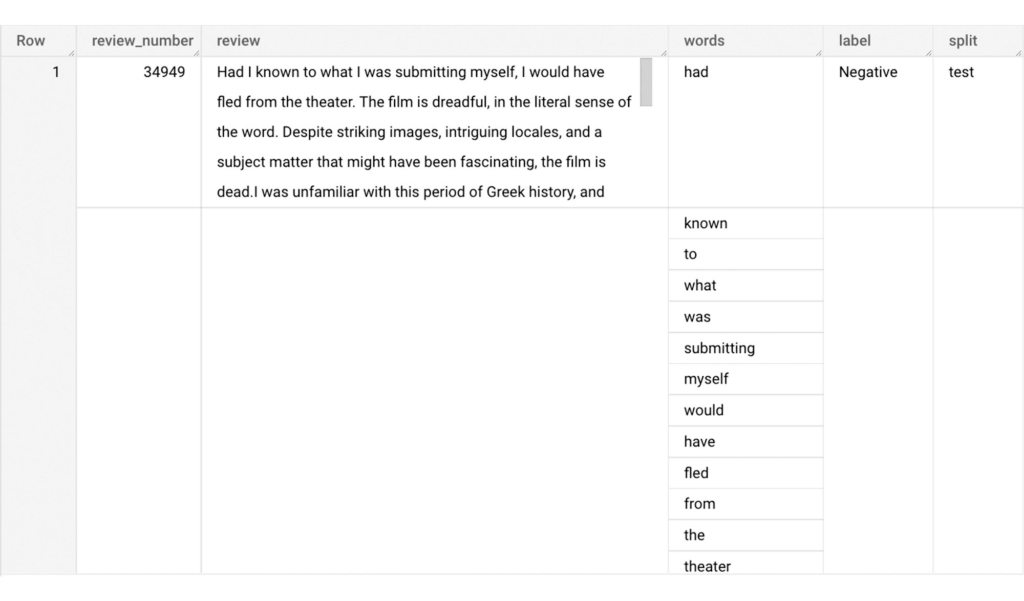
The next step is to build a vocabulary using the extracted words. The following code creates a vocabulary including word frequency and word index from reviews. For this case, we are going to select only the top 20,000 words to reduce the computation time.
-- Create a vocabulary using train dataset and select only top 20,000 words based on frequency
CREATE OR REPLACE TABLE sparse_features_demo.vocabulary AS (
 SELECT
   word,
   word_frequency,
   word_index
 FROM (
   SELECT
     word,
     word_frequency,
     ROW_NUMBER() OVER (ORDER BY word_frequency DESC) - 1 AS word_index
   FROM (
     SELECT
       word,
       COUNT(word) AS word_frequency
     FROM
       sparse_features_demo.processed_reviews,
       UNNEST(words) AS word
     WHERE
       split = "train"
     GROUP BY
       word
   )
 )
 WHERE
   word_index < 20000 # Select top 20,000 words based on word count
);
The following shows the top 10 words based on frequency and their respective index from the resulting table of the query above.
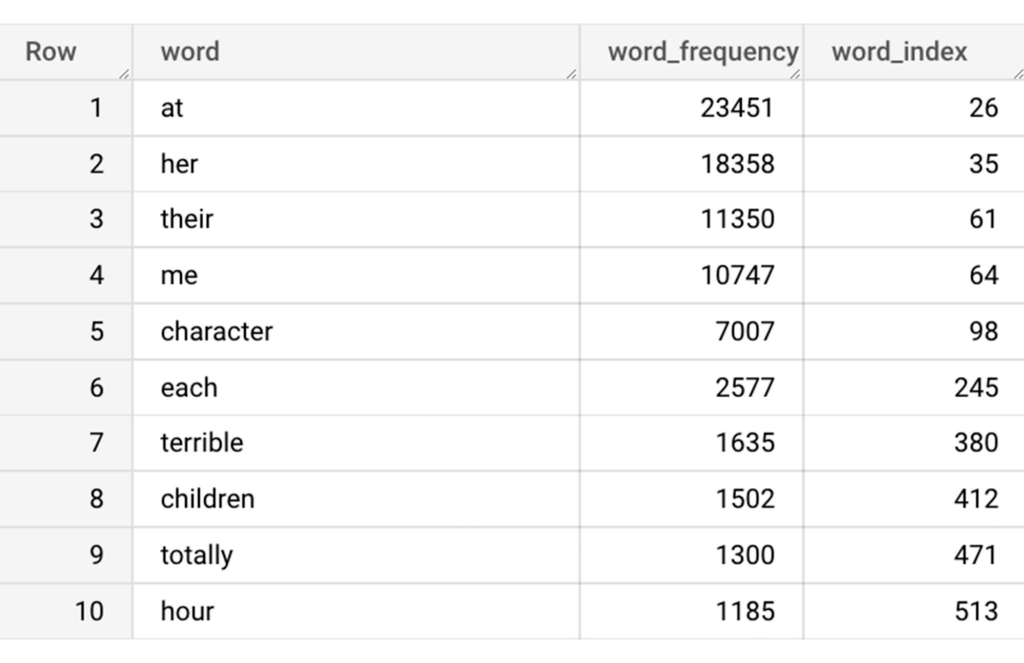
Creating a sparse feature
Now we will use the newly added feature to create a sparse feature in BigQuery. For this case, we aggregate word_index and word_frequency in each review, which generates a column as ARRAY[STRUCT] type. Now, each review is represented as ARRAY[(word_index, word_frequency)].
-- Generate a sparse feature by aggregating word_index and word_frequency in each review.
CREATE OR REPLACE TABLE sparse_features_demo.sparse_feature AS (
 SELECT
   review_number,
   review,
   ARRAY_AGG(STRUCT(word_index, word_frequency)) AS feature,
   label,
   split
 FROM (
   SELECT
     DISTINCT review_number,
     review,
     word,
     label,
     split
   FROM
     sparse_features_demo.processed_reviews,
     UNNEST(words) AS word
   WHERE
     word IN (SELECT word FROM sparse_features_demo.vocabulary)
 ) AS word_list
 LEFT JOIN
   sparse_features_demo.vocabulary AS topk_words
   ON
     word_list.word = topk_words.word
 GROUP BY
   review_number,
   review,
   label,
   split
);
Once the query is executed, a sparse feature named `feature` will be created. That `feature` column is an `ARRAY of STRUCT` column which is made of `word_index` and `word_frequency` columns. The picture below displays the resulting table at a glance.
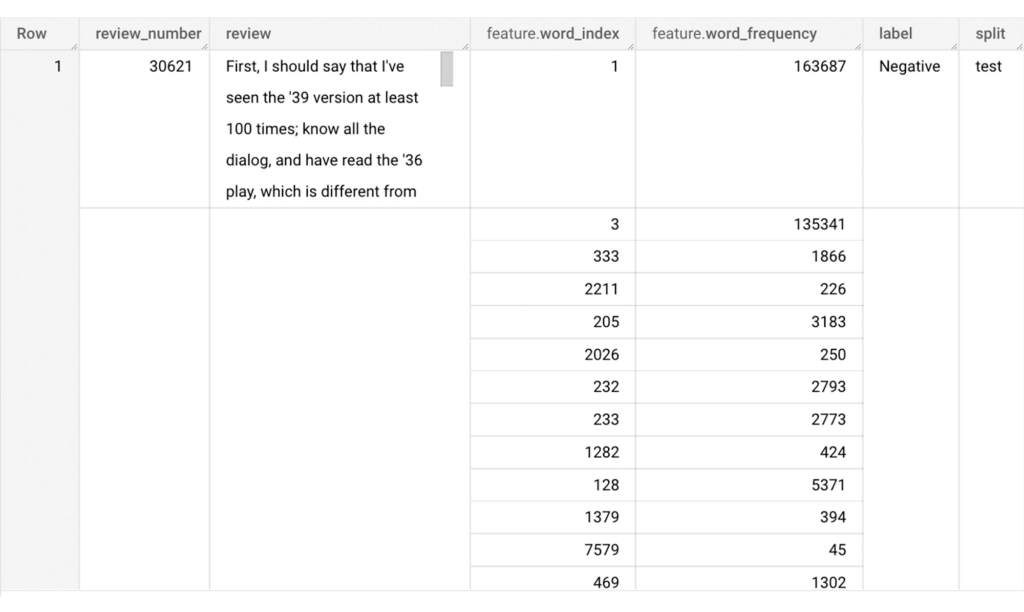
Training a BigQuery ML model
We just created a dataset with a sparse feature in BigQuery. Let’s see how we can use that dataset to train with a machine learning model with BigQuery ML. In the following query, we will train a logistic regression model using the review_number, review, and feature to predict the label:
-- Train a logistic regression classifier using the data with sparse feature
CREATE OR REPLACE MODEL sparse_features_demo.logistic_reg_classifier
 TRANSFORM (
   * EXCEPT (
       review_number,
       review
     )
 )
 OPTIONS(
   MODEL_TYPE='LOGISTIC_REG',
   INPUT_LABEL_COLS = ['label']
 ) AS
 SELECT
   review_number,
   review,
   feature,
   label
 FROM
    sparse_features_demo.sparse_feature
 WHERE
   split = "train"
;
Now that we have trained a BigQuery ML Model using a sparse feature, we evaluate the model and tune it as needed.
-- Evaluate the trained logistic regression classifier
SELECT * FROM ML.EVALUATE(MODEL sparse_features_demo.logistic_reg_classifier);
The score looks like a decent starting point, so let’s go ahead and test the model with the test dataset.

-- Evaluate the trained logistic regression classifier using test data
SELECT * FROM ML.EVALUATE(MODEL sparse_features_demo.logistic_reg_classifier,
 (
   SELECT
     review_number,
     review,
     feature,
     label
   FROM
     sparse_features_demo.sparse_feature
   WHERE
     split = "test"
 )
);
The model performance for the test dataset looks satisfactory and it can now be used for inference. One thing to note here is that since the model is trained on the numerical features, the model will only accept numeral features as input. Hence, the new reviews have to go through the same transformation steps before they can be used for inference. The next step shows how the transformation can be applied to a user-defined dataset.
Sentiment predictions from the BigQuery ML model
All we have left to do now is to create a user-defined dataset, apply the same transformations to the reviews, and use the user-defined sparse features to perform model inference. It can be achieved using a WITH statement as shown below.
WITH
 -- Create a user defined reviews
 user_defined_reviews AS (
   SELECT
     ROW_NUMBER() OVER () AS review_number,
     review,
     REGEXP_EXTRACT_ALL(LOWER(review), '[a-z]{2,}') AS words
   FROM (
     SELECT "What a boring movie" AS review UNION ALL
     SELECT "I don't like this movie" AS review UNION ALL
     SELECT "The best movie ever" AS review
   )
 ),


 -- Create a sparse feature from user defined reviews
 user_defined_sparse_feature AS (
   SELECT
     review_number,
     review,
     ARRAY_AGG(STRUCT(word_index, word_frequency)) AS feature
   FROM (
     SELECT
       DISTINCT review_number,
       review,
       word
     FROM
       user_defined_reviews,
       UNNEST(words) as word
     WHERE
       word IN (SELECT word FROM sparse_features_demo.vocabulary)
   ) AS word_list
   LEFT JOIN
     sparse_features_demo.vocabulary AS topk_words
     ON
       word_list.word = topk_words.word
   GROUP BY
     review_number,
     review
 )


-- Evaluate the trained model using user defined data
SELECT review, predicted_label FROM ML.PREDICT(MODEL sparse_features_demo.logistic_reg_classifier,
 (
   SELECT
     *
   FROM
     user_defined_sparse_feature
 )
);
Here is what you would get for executing the query above:
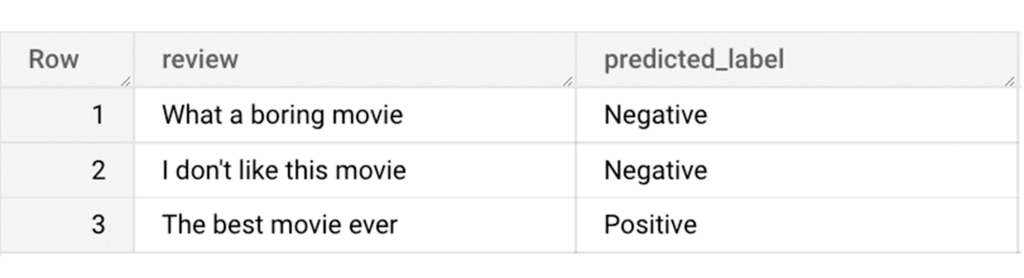
And that’s it! We just performed a sentiment analysis on the IMDb dataset from a BigQuery Public Dataset using only SQL statements and BigQuery ML. Now that we have demonstrated how sparse features can be used with BigQuery ML models, we can’t wait to see all the amazing projects that you would create by harnessing this functionality.
If you’re just getting started with BigQuery, check out our interactive tutorial to begin exploring.
5155
Of your peers have already watched this video.
24:00 Minutes
The most insightful time you'll spend today!
BK Medical’s Lift and Shift of SAP Environs on Google Cloud Results in Real-time Success
BK Medical is known for designing active imaging systems to help care providers visualize anatomy and provide real-time guidance to aid surgical interventions. After becoming an entity independent of the parent company, Analogic corporation, BK Medical decided to separate its SAP environs from the latter, and move into cloud. After assessing cloud vendors with Managecore, BK Medical chose Google Cloud as its managed service provider that could serve as a single source of truth and also help walk through the lift and shift of SAP ECC systems to the cloud. Watch the video to learn how the migration impacted BK Medical’s goals.
What Drives Your Organization to be Data-driven?

4873
Of your peers have already read this article.
4:00 Minutes
The most insightful time you'll spend today!
Every organization has its own unique data culture and capabilities. Yet each is expected to use technology trends and solutions in the same way as everyone else. Your organization may be built on years of legacy applications, you may have developed a considerable amount of expertise and knowledge, yet you may be asked to adopt a new approach based on a technology trend. On the other hand, you may be on the other side of the spectrum, a digitally native organization built with engineering principles from scratch without legacy systems but expected to follow the same principles as process driven, established organizations. The question is, should we treat these organizations in the same way when it comes to data processing? In this series of blogs and papers this is what we are exploring: how to set up an organization from the first principles from data analyst, data engineering and data science point of view. In reality, there is no such organization that is solely driven by one of these but it is likely to be a combination of multiple types. What type of organization you become is then driven by how much you are influenced by each of these principles.
When you are considering what data processing technology encompasses, take a step back and make a strategic decision based on your key goals. This can be whether you optimize for performance, cost, reduction in operational overhead, increase in operational excellence, integration of new analytical and machine learning approaches. Or perhaps you’re looking to leverage existing employees’ skills while meeting all your data governance and regulatory requirements. We will be exploring these different themes and will focus on how they guide your decision-making process. You may be coming from technologies which are solving some of the past problems and some of the terminologies may be more familiar, however they don’t scale your capabilities. There is also the opportunity cost of prioritizing legacy and new issues that arise from a transformation effort, and as a result your new initiative can set you further behind on your core business while you play catch up to an ever changing technology landscape.
Data value chain
The key for any ingestion and transformation tool is to extract data from a source and start acting on it. The ultimate goal is to reduce the complexity and increase the timeliness of the data. Without data, it is impossible to create a data driven organization and act on the insights. As a result, data needs to be transformed, enriched, joined with other data sources, and aggregated to make better decisions. In other words, insights on good timely data mean good decisions.
While deciding on the data ingestion pipeline, one of the best approaches is to look into the volume of data, the velocity of the data, and type of data that is arriving. Other considerations include the number of different data sources you are managing, whether you need to scale to thousands of sources using generic pipelines, whether you want to create one generic pipeline but then apply data quality rules and governance. ETL tools are ideal for this use case as generic pipelines can be written and then parameterized.
On the other hand, consider the data source. Can the data be directly ingested without transforming and formatting the data? If the data does not need to be transformed and can be ingested directly into the data warehouse as a managed solution. This not only reduces the operational costs but also allows for more timely data delivery. If the data is coming in through an unstructured format such as XML or in a format such as EBCDIC and needs to be transformed and formatted, then a tool with ETL Capabilities can be used depending on the speed of the data arrival.
It is also important to understand the speed and time of arrival of the data. Think about your SLAs and time durations/windows that are relevant for your data ingestion plans. This would not only drive the ingestion profiles but would also dictate which framework to use. As discussed above, velocity requirements would drive the decision-making process.
Type of Organization
Different organizations can be successful by employing different strategies based on the talent that they have. Just like in sports, each team plays with a different strategy with the ultimate goal of winning.
Organizations often need to decide on what’s the best strategy to take in respect to data ingestion and processing – whether you need to hire an expensive group of data engineers, or exploit your data wizards and analysts to enrich and transform data that can be acted on, or whether it would be more realistic to train the current workforce to do more functional/high value work rather than to focus on building generally understood and available foundational pieces.
On the other hand, the transformation part of ETL pipelines as we know it, dictates where the load will be. All of these are made a reality in the cloud native world where data can be enriched, aggregated, and joined. Loading data into a powerful and modern data warehouse means that you can already join and enrich the data using ELT. Consequently, ETL isn’t really needed in its strict terms anymore if the data can be loaded directly into the data warehouse.
All of the above was not possible in the traditional, siloed, and static data warehouses and data ecosystems whereby systems would not talk to each other or there were capacity constraints in respect to both storing and processing the data in the expensive Data Warehouse. This is no longer the case in the BigQuery world as storage is now cheap and transformations are now much more capable without constraints of virtual appliances.
If your organization is already heavily invested into an ETL tool, one option is to use them to load BigQuery and transform the data initially within the ETL tool. Once the as-is and to-be are verified to be matching, then with the improved knowledge and expertise one can start moving workloads into BigQuery SQL, and effectively do ELT.
Furthermore, if your organization is coming from a more traditional data warehouse that extensively relies on stored procedures and scripting, then the question that one may ask is, do I continue leveraging these skills and expertise and use these capabilities that are also provided in BigQuery? ELT with BigQuery is more natural, similar to what’s already in Teradata BTEQ, Oracle PL/SQL but migrating from ETL to ELT requires changes. This change then enables exploiting streaming use cases, such as real-time use cases in retail. This is because there is no preceding step before data is loaded and made available.
Organizations can be broadly classified under 3 types as Data Analyst Driven, Data Engineering driven, and Blended organization. We will be covering a Data Science driven organization within the Blended category.
Data Analyst Driven
Analysts understand the business and are used to using SQL/spreadsheets. Allowing them to do advanced analytics through interfaces that they are accustomed to enables scaling. As a result, easy to use ETL tooling to bring data quickly into the target system becomes a key driver. Ingesting data directly from a source or staging area then also becomes critical as it allows analysts to exploit their key skills using ELT and increases timeliness of the data. This is commonplace with traditional EDWs and realized by extended capabilities of using Stored Procedures and Scripting. Data is enriched, transformed, and cleansed using SQL and ETL tools act as the orchestration tools.
The capabilities brought by cloud computing on separation of data and computation changes the face of the EDW as well. Rather than creating complex ingestion pipelines, the role of the ingestion becomes, bringing data close to the cloud, staging on a storage bucket or on a messaging system before being ingested into the cloud EDW. This then releases data analysts to focus on looking into data insights using tools and interfaces that they are accustomed to.
Data Engineering / Data Science Driven
Building complex data engineering pipelines is expensive but enables increased capabilities. This allows creating repeatable processes and scaling the number of sources. Once complemented with cloud it enables agile data processing methodologies. On the other hand, data science organizations allow carrying out experiments and producing applications that work for specific use cases but are not often productionised or generalized.
Real-time analytics enables immediate responses and there are specific use cases where low latency anomaly detection applications are required to run. In other words, business requirements would be such that it has to be acted upon as the data arrives on the fly. Processing this type of data or application requires transformation done outside of the target.
All the above usually requires custom applications or state-of-the-art tooling which is achieved by organizations that excel with their engineering capabilities. In reality, there are very few organizations that can be truly engineering organizations. Many fall into what we call here as the blended organization.
Blended org
The above classification can be used on tool selection for each project. For example, rather than choosing a single tool, choose the right tool for the right workload, because this would reduce operational cost, license cost and use the best of the tools available. Let the deciding factor be driven by business requirements: each business unit or team would know the applications they need to connect with to get valuable business insights. This coupled with the data maturity of the organization would be the key to making sure the right data processing tool would be the right fit.
In reality, you are likely to be somewhere on a spectrum. Digital native organizations are likely to be closer to being engineering driven, due to their culture and business that they are in. However, brick and mortar organizations would be closer to being analyst driven due to the significant number of legacy systems and processes they possess. These organizations are either considering or working toward digital transformation with an aspiration of having a data engineering / software engineering culture like Google.
The blended organization with strong skills around data engineering, would have built the platform and built frameworks, to increase reusable patterns would increase productivity and then reduce costs. Data engineers focus on running Spark on Kubernetes whereas infrastructure engineers focus on container work. This in turn provides unparalleled capabilities as application developers focus on the data pipelines and even the underlying technologies or platforms changes code stays the same. As a result, security issues, latency requirements, cost demands and portability are addressed at multiple layers.
Conclusion – What type of organization are you?
Often an organization’s infrastructure is not flexible enough to react to a fast changing technological landscape. Whether you are part of an organization which is engineering driven or analyst driven, organizations frequently look at technical requirements that inform which architecture to implement. But a key, and frequently overlooked, component needed to truly become a data-driven organization is the impact of the architecture on your data users. When you take into account the responsibilities, skill sets, and trust of your data users, you can create the right data platform to meet the needs of your IT department as well as your business.
To become a truly data-driven organization, the first step is to design and implement an analytics data platform that meets your technical and business needs. The reality is that each organization is different and has a different culture, different skills, and capabilities. Key is to leverage its strengths to stay competitive while adopting new technologies when it is needed and as it fits to your organization.
To learn more about the elements of how to build an analytics data platform depending on the organization you are, read our paper here.
More Relevant Stories for Your Company

Leverage ML to Spot Anomalies in Real-time Forex Data
Let's say you are a quantitative trader with access to real-time foreign exchange (forex) price data from your favorite market data provider. Perhaps you have a data partner subscription, or you're using a synthetic data generator to prove value first. You know there must be thousands of other quants out there with your same
Apache and Dataflow Help with Real-time Indices Processing for Financial Institutions
Financial institutions across the globe rely on real-time indices to inform real-time portfolio valuations, to provide benchmarks for other investments, and as a basis for passive investment instruments including exchange-traded products (ETPs). This reliance is growing—the index industry dramatically expanded in 2020, reaching revenues of $4.08 billion. Today, indices are calculated and distributed by

Google’s Record-breaking Performance Tops the MLPerf Benchmark Results
The latest round of MLPerf benchmark results have been released, and Google's TPU v4 supercomputers demonstrated record-breaking performance at scale. This is a timely milestone since large-scale machine learning training has enabled many of the recent breakthroughs in AI, with the latest models encompassing billions or even trillions of parameters

How Toyota’s Google Cloud-powered Voice Assistant Gives a Turboboost to Drivers’ Experience
Over the decades, technology has helped us organize large amounts of physical information in ways that are streamlined, efficient, and easily accessible. Rows upon rows of encyclopedias are no longer needed; simply punch in or speak a query into Google Search and find numerous results at your fingertips. There’s no
