






6791
Of your peers have already downloaded this article
3:08 Minutes
The most insightful time you'll spend today!






Mrs. T’s Pierogies Moves SAP Systems to Google Cloud for Faster Analytics Capabilities for its SAP Data

6834
Of your peers have already read this article.
1:30 Minutes
The most insightful time you'll spend today!
Pierogies might just be the ultimate comfort food. But when Mrs. T’s Pierogies — the leading manufacturer of frozen pierogies in the US — learned it needed to transition its existing on-premises SAP ECC to S/4HANA, the company sought a little comfort for itself.
Founded in 1952, Mrs. T’s Pierogies now produces more than 650 million pierogies a year. Moving that many pierogies requires a powerful ERP system — and an equally powerful IT infrastructure on which to run it. Mrs. T’s realized that the SAP-mandated transition of its ERP solution to SAP S/4HANA was an opportunity to move its SAP systems to Google Cloud and gain real-time analytics capabilities for faster sales forecasting, more effective trade promotions, and more sophisticated planning.
From necessity to opportunity
Mrs. T’s successfully ran its SAP ECC solution on its own on-premises servers for years. But after SAP decided to sunset the product, Mrs. T’s realized that it faced multiple challenges, including:
- Migrating its SAP ECC 6.0 system from an on-premises leagcy OS to a cloud-based Linux environment
- Moving data from its SAP DB2 database to HANA
- Transitioning from ECC to SAP S/4HANA
That complex transition needed to take place with little or no downtime, since nearly all of the company’s invoices, warehouse movements, and transfer orders used the Electronic Data Interchange (EDI) protocol. Missing even a few hours of EDI transactions would put significant revenue at stake. Adding to the challenge: Some Mrs. T’s customers would not accept an invoice past five days, which left little room for error. Mrs. T’s chose Rackspace Technology, a longtime Google Cloud partner, to oversee the move.
Mrs. T’s could have chosen to run S/4HANA on its legacy hardware but saw migration to Google Cloud as an opportunity to improve key aspects of its business, in particular data analytics. Historically, sales planning and forecasting involved time-consuming manual processes. But the speed, availability, and scalability of Google Cloud meant that Mrs. T’s could take advantage of S/4HANA’s embedded analytics capabilities. Migrating could also open the door to leveraging Google Cloud’s native integration of SAP data to power Google tools such as BigQuery, Google Cloud AI Building Blocks, and more.
The move to Google Cloud also gave Mrs. T’s an opportunity to update its disaster recovery process. Previously, the company backed up to tape. So, if its SAP systems went down, a member of the IT department would have to drive the most recent tape backups an hour to its cold site, where the disaster recovery partner would load the SAP backup tape, boot the system up, switch network connections to that site, and cross their fingers. Not only would downtime be significant, but restored data would be limited to the periodic tape backup.
“Everything just worked”
Once Mrs. T’s decided to migrate to Google Cloud, the company worked with Rackspace Technology to implement the system. The first phase focused on moving the SAP production environment from on-premises infrastructure to Google Cloud and updating its database to HANA, which took place over 12 weeks. The switchover occurred over a weekend and was all but invisible to users. “We came in on Monday and everything just worked,” recalls Timothy Coyle, Director of Information Systems & Technology. In a second four-month phase, the company transitioned from ECC to S/4.
The move to Google Cloud paid dividends immediately. Batch transactions occurred twice as fast and on-screen end-user transactions rendered instantly. The upgrade also gave the finance team access to embedded analytics and monitoring for the first time. With everything now in the cloud, disaster recovery could be dynamic and nearly instantaneous, with a worst-case scenario of just 5 to 10 minutes of downtime.
“Mrs. T’s needed a skilled and experienced partner that could move its SAP environment to Google Cloud with no negative impacts to its business. We knew this migration was a key initiative in Mrs. T’s digital transformation journey,” says Chuck Britton, Google Partner Development Manager at Rackspace. “We also knew that running SAP on Google Cloud would give the business the fast and flexible analytical capabilities it needed for its SAP data.”
From ideation to production, Mrs. T’s migrated from its legacy on-premises infrastructure to a modern SAP S/4HANA solution on Google Cloud in only seven months, with minimal downtime and zero disruptions. Now that the migration is complete, Mrs. T’s has a flexible, highly scalable environment to run the SAP applications and data that fuel the business. Says Coyle, “Our strategic intent for IT is to make processes simpler, people more productive, and infrastructure more secure. This project fits right square in the middle of that strategic philosophy.”
Learn more about ways in which Google Cloud can transform your SAP experience and about Rackspace Google Cloud solutions for SAP customers.
3369
Of your peers have already watched this video.
16:30 Minutes
The most insightful time you'll spend today!
Scaling Data-Driven Insights Across a Complex Global Organization with Looker and BigQuery
In this video, SpringML and Iron Mountain share how migrating data to Google Cloud not only saved hundreds of thousands of dollars in licensing consolidation but allows stakeholders across a complex global organization to:
- Consolidate 1,200 data management applications into one data lake
- Unify information governance practices across disparate corporate verticals and departments
- Provide a single view of operational and customer data for enhanced decision making across 43 countries and 200 acquisitions
- Unlock the power of data science and predictive analytics
Standardizing across varying systems and processes onto one platform took just a matter of weeks for a project that could have taken about a year.
SpringML and Iron Mountain share how this was done, lessons learned and next steps for their collaboration adopting Looker and BigQuery into Iron Mountain.
Wayfair Writes its Success Story with BigQuery for Internal Analytics

4924
Of your peers have already read this article.
4:00 Minutes
The most insightful time you'll spend today!
Editor’s note: Home-goods and furniture giant Wayfair first partnered up with Google Cloud to transform and scale its storefront—work that proved its value many times over during the unprecedented surge in ecommerce traffic during 2020. Today, we hear how BigQuery’s performance and cost optimization have transformed the company’s internal analytics to create an environment of “yes”.
At Wayfair, we have several unique challenges relating to the scale of our product catalog, our global delivery network, and our position in a multi-sided marketplace that supports both our customers and suppliers. To give you a sense of our scale we have a team of more than 3,000 engineers with tens of millions of customers. We supply more than 20 Million items using more than 16,000 supplier partners.
Serving those constituents generates a lot of analytics work. Wayfair runs over a billion ‘analytic’ database queries a year, from both humans and systems, against multi-petabyte datasets. Scaling our previous environment to meet these challenges required us to maintain dozens of copies of data for different use cases and manage complex data synchronization routines to move trillions of records each day, resulting in long development times and high support costs for our analytics projects.
Centralizing our data using Cloud Storage and BigQuery enabled us to break down existing silos and build unified pipelines for our batch and real-time operations. BigQuery shines by letting us decouple our compute and storage resources and flexibly ingest structured data in streaming and batch modes. We also benefit from the same decoupling for more complicated machine learning (ML) workflows in Dataproc and Cloud Storage. In particular, BigQuery is extremely low maintenance. From ML and easy data integrations to the integrated query cache, many out-of-the-box features have proven valuable for multiple use cases.
Beyond storage and compute, Google Cloud offers multiple tools to maximize the value of our data. For example, we can easily connect Data Studio to BigQuery for lightning-fast dashboarding of enterprise KPI reporting. When we need to dive deeper into a metric, Looker provides an interface and semantic model that empowers more business users to answer important questions — without understanding SQL or our vast dataset and table structure.
The combination of all of Google Cloud’s tools enables every Wayfairian the opportunity to self-serve their data visualization and analysis needs. We are able to support all of the requirements of our internal and external users, from descriptive analytics to alerting and ML, in a platform that blends Google’s proprietary technology with open-source standards.we have seen a greater than 90% reduction in the number of analytic queries in production that take more than one minute to run
As a result, we have seen a greater than 90% reduction in the number of analytic queries in production that take more than one minute to run, which delights our users and increases adoption of our analytics tools across the business.
Higher performance means saying “Yes” more often
We went into the BigQuery experience expecting very strong performance on large, aggregate queries and excellent scalability — the kind of performance that could enable consistent 5-15 minute processing queries and 5-10 second response times for large analytics queries.
We weren’t disappointed — we saw slightly better than linear performance profiles as record counts went up from millions to trillions for a flat resource allocation. BigQuery had the expected high performance for aggregate queries. This made our large data processing pipelines predictable and straightforward to maintain and optimize.
Below is a plot of gigabytes processed by a query against query run time in seconds; outliers are filtered and the axes are pruned to ranges where we had a large sample size. This focuses on longer-duration queries. As an example of the linear performance, a 2 terabyte query averages 5 minutes — 2.5min/terabyte — and an 18 terabyte query (9 times as much data) averages 25s — only 1.4min/terabyte. This is despite the fact that complex queries [sorting and analytic functions are particularly problematic] are more common with large data sizes. We do see increasing variability at large sizes as slot limits and other resource constraints come into play, but these factors are controllable and ultimately a business optimization decision.
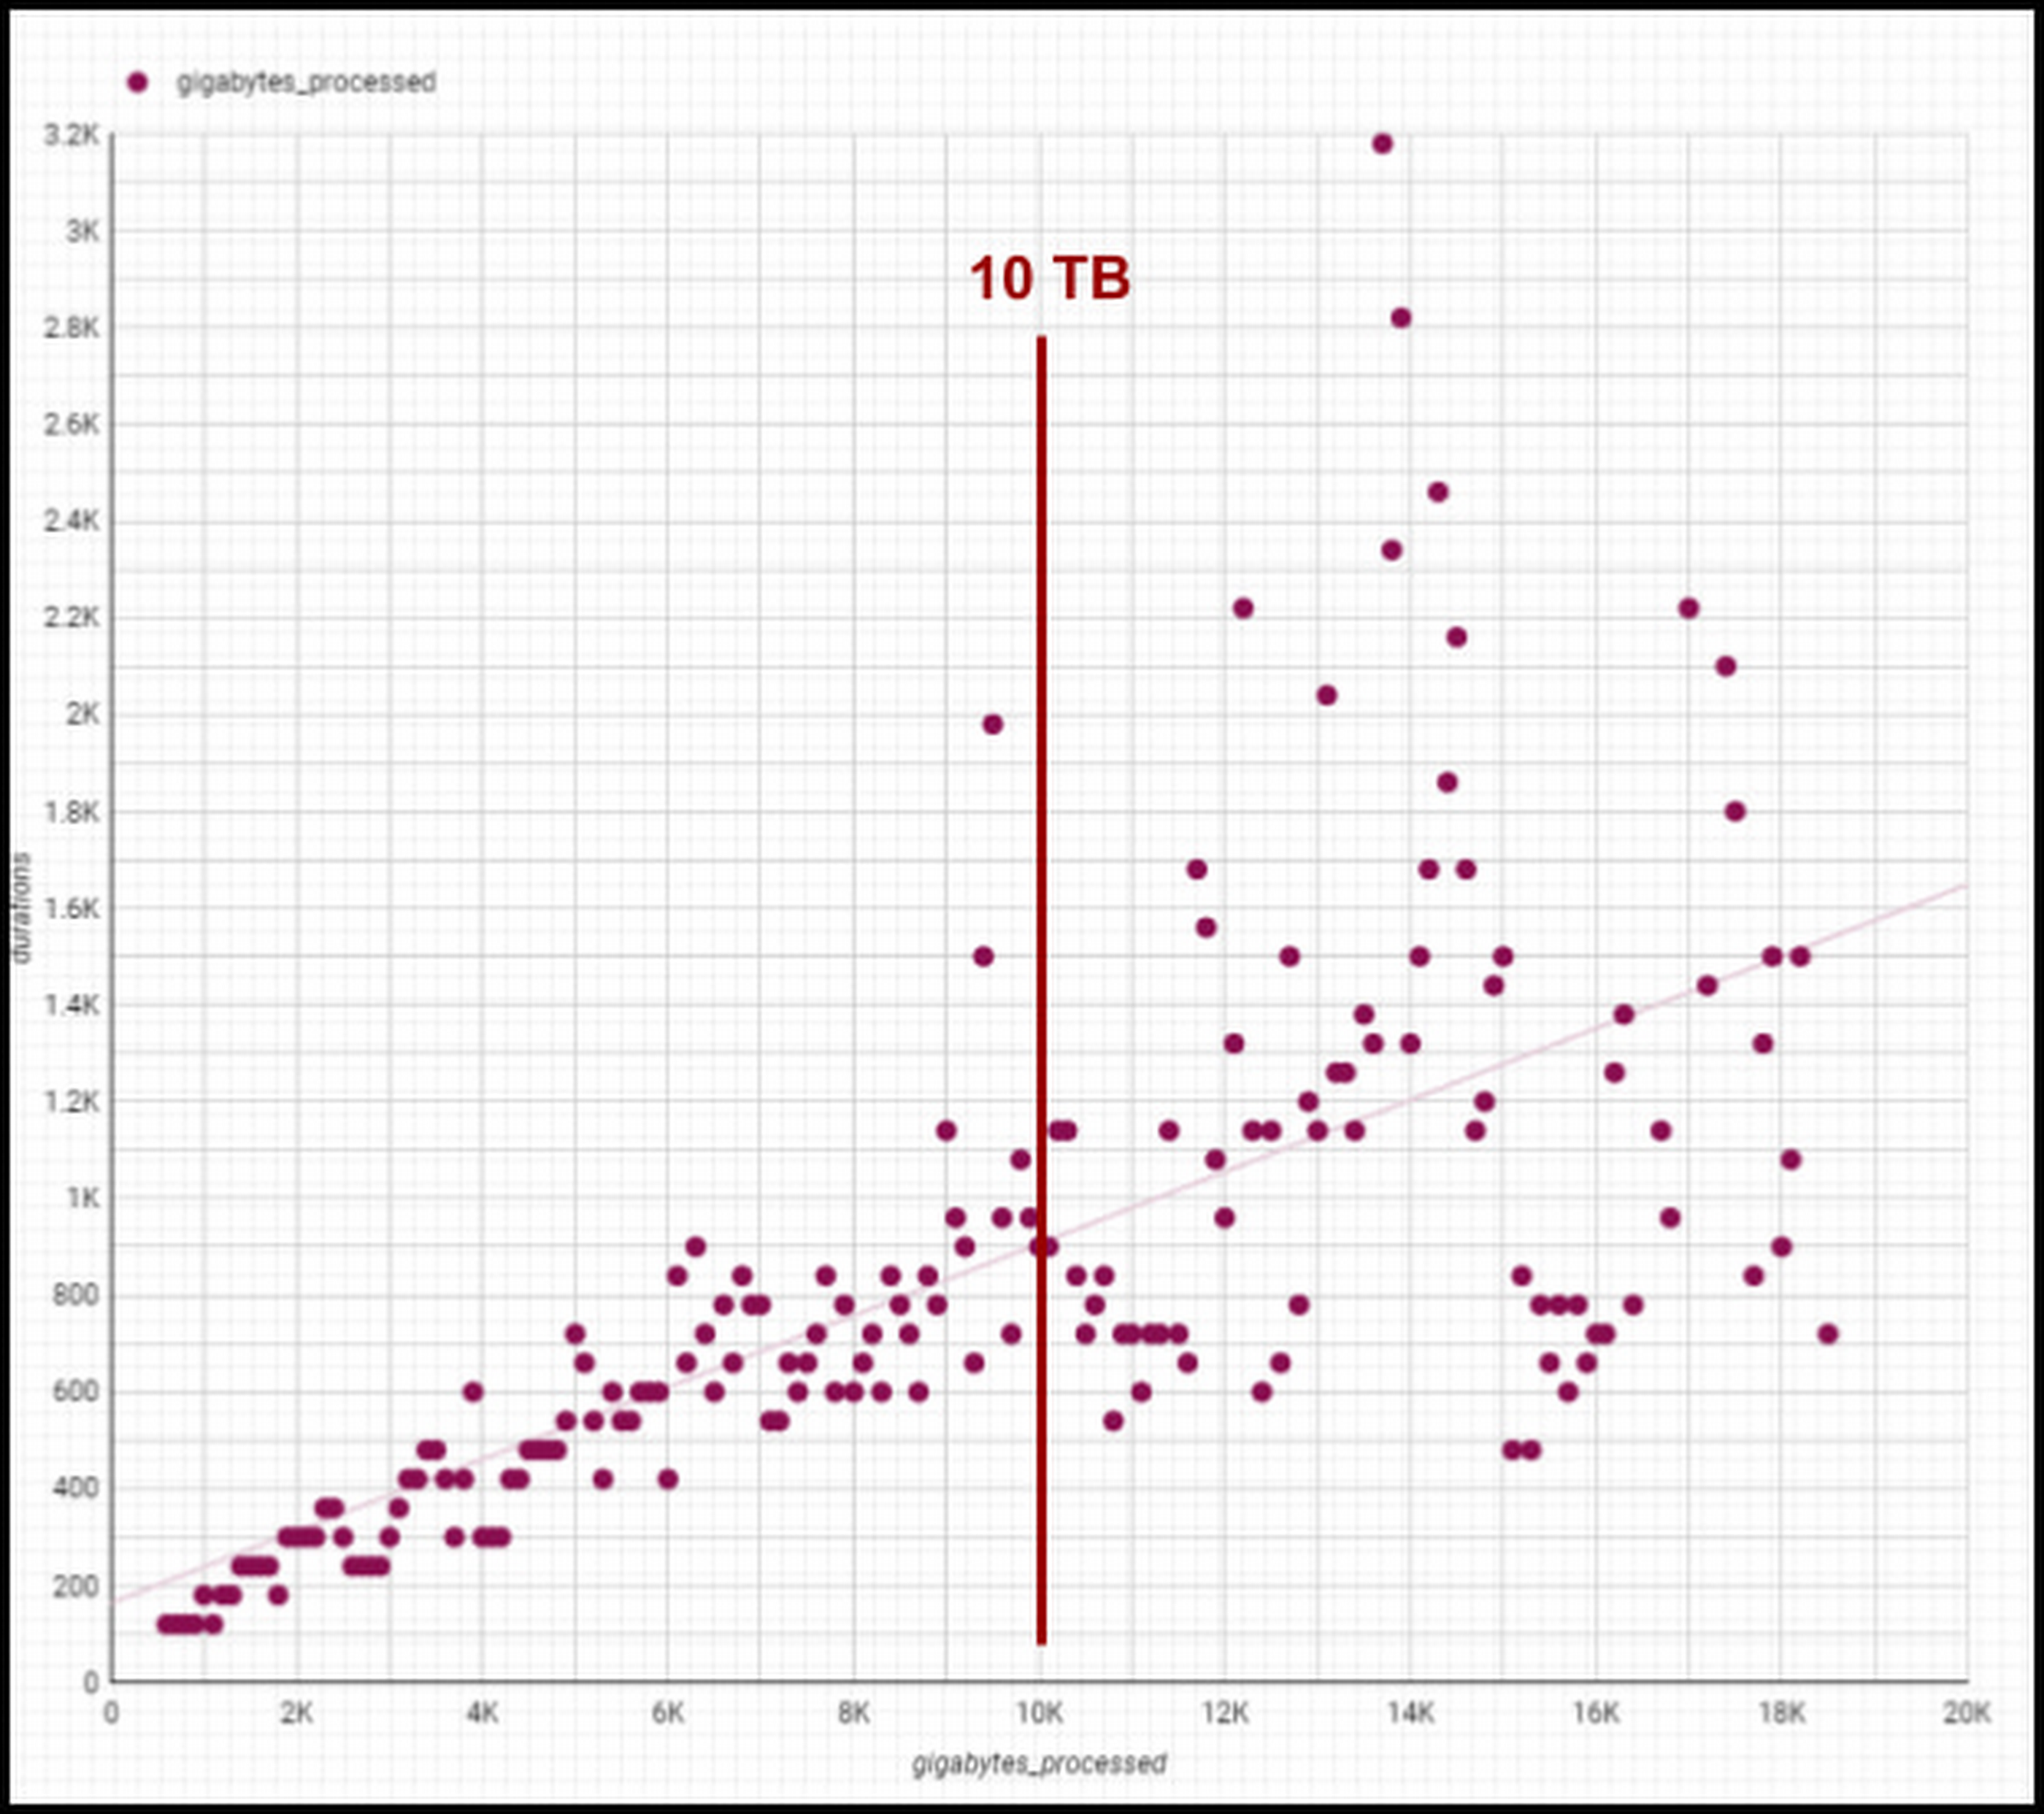
Though individual values vary greatly depending on query complexity [analytic functions/sorting can be computationally expensive], the overall trend line is below 1-1 for bytes versus duration, meaning our BigQuery query runtimes are increasing slower than our data volumes. We are still seeing sub 1:1 threshold runtimes, and we’re already at 100 PB of total data with single queries running on 50PB or more. Going strong!
One unexpected and pleasant surprise has been high performance for smaller queries, such as those required for development, interactive analytics, and internal applications we use for forecasting, segmentation, and other latency-sensitive data workflows. BigQuery’s resource management systems have provided smoother degradation and parallelism profiles than we initially expected for a multi-tenant platform.
We regularly see sub-second p50 query performance for interactive use cases, with p90 performance coming in under 10 seconds for Looker, Data Studio, and AtScale — meeting the threshold we set to avoid analysts losing focus during a business investigation. The chart below shows p50, p90, and p95 timing for core workloads, as well as the number of queries in each bucket and the number of unique users. [Looker and Atscale will use small numbers of service accounts for a large number of users].

This has enabled two important shifts in the way our customers experience analytics services:
- Delivering better user productivity. People no longer have long wait times to get results for a basic query delivering an improved overall user experience.
- Scaling our data transformation. BigQuery has proven, effective data transformation that allows us to embrace the industry shift away towards ELT (extract, load, transform) to transform raw data right within the database.
We no longer have to ask ourselves, “Can we meet the SLA for this data processing task?” The new conversation is, “Of course, we can meet it. What’s the associated cost based on how many resources we assign?” We can make cost and resource trade-offs clear to our users and say “yes” more often to requirements that have measurable business value.
Supporting cost vs. performance decisions
Democratized access to internal analytics is a powerful decision-making tool. With BigQuery’s robust tooling, the decision about how to best allocate computational resources is in the hands of the analytics groups closest to the business decision being made. If they want to spend a sprint optimizing a dashboard, they can show exactly how much money it will save. If they choose not to optimize a report, they can offset the decision with concrete cost savings and other realized value.
Wayfair teams also benefit from visibility into their committed costs by abstracting away the details of the underlying services, including BigQuery slots, the virtual CPUs used to execute SQL queries.
Take a look at this example view consumed by our teams (the metrics for these dashboards are from the BigQuery INFORMATION_SCHEMA (jobs and reservations tables):
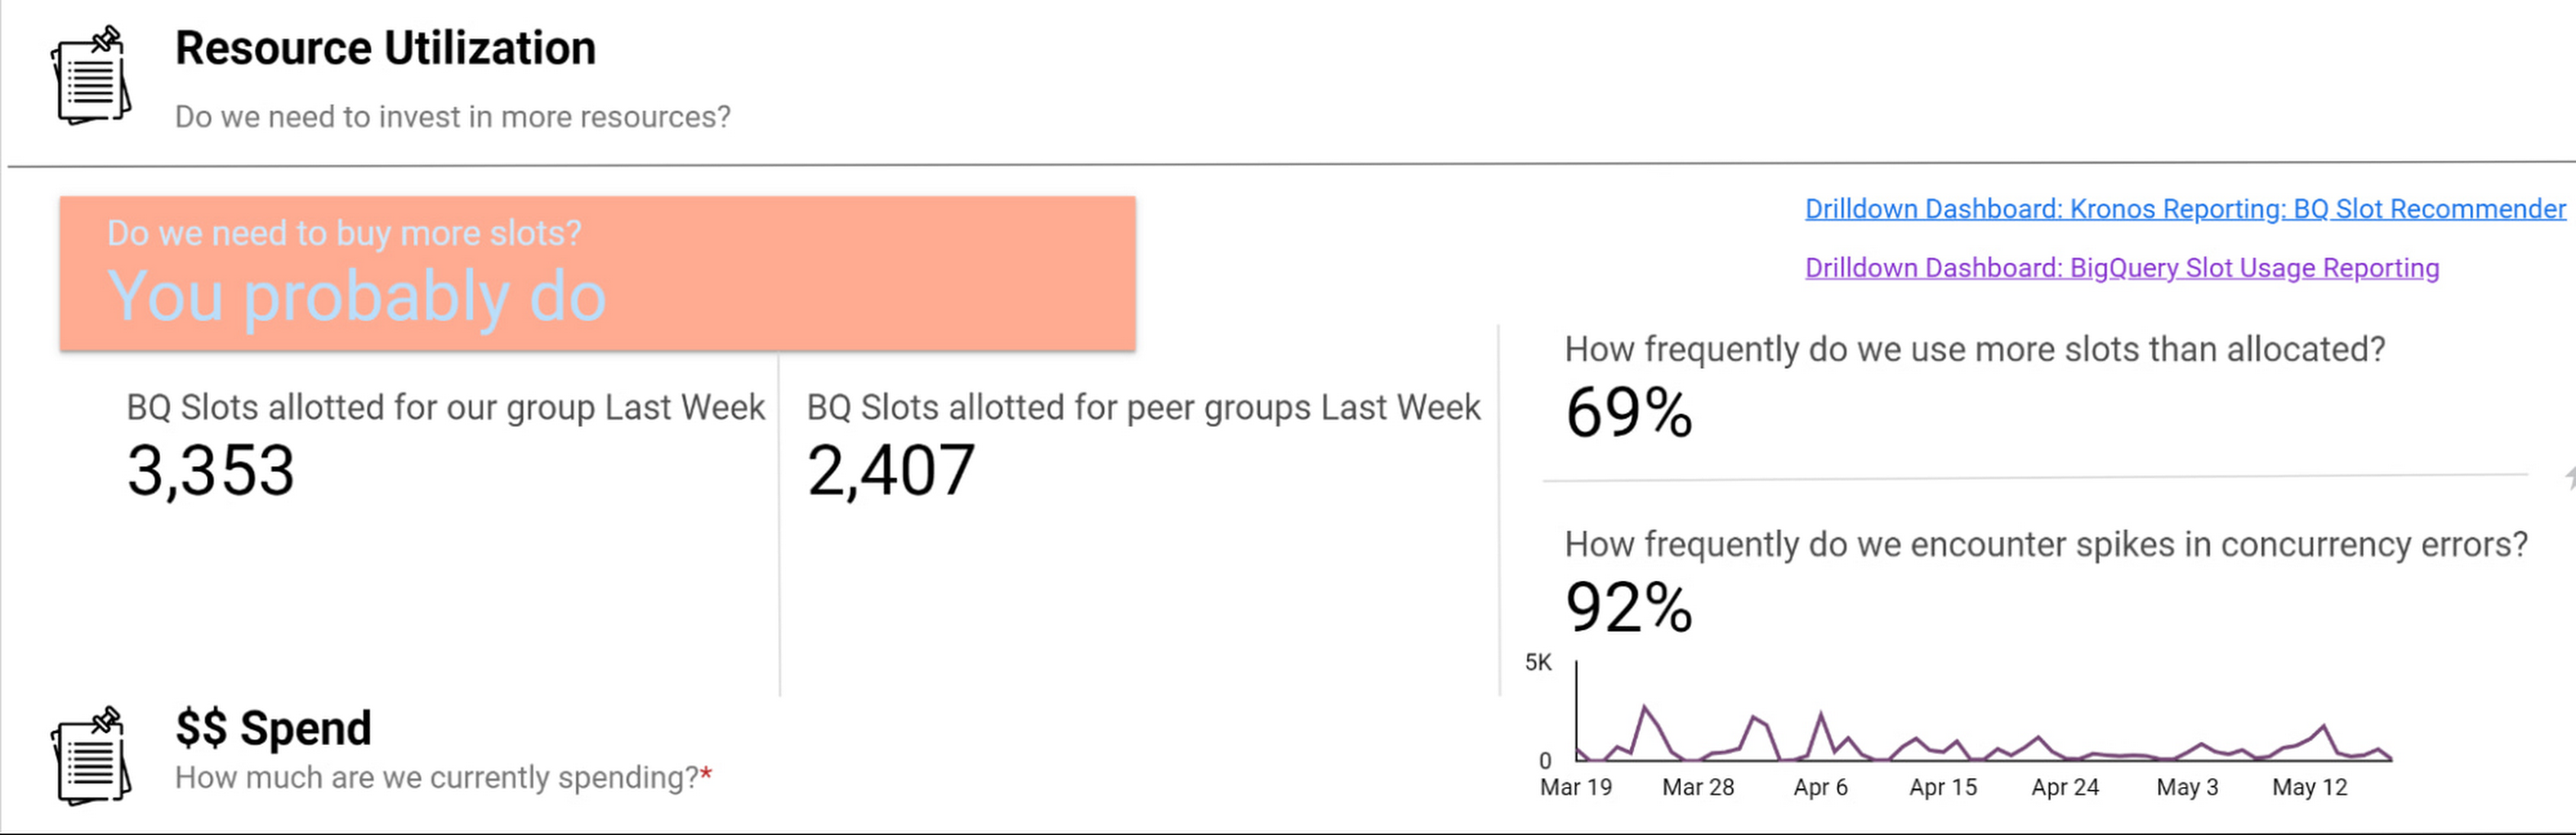
Suppose an organization wants to purchase capacity for a period of time. In that case, we provide an average cost for a slot during that time and charge them based on their slot usage for queries, multiplied by the average price.
Teams can see whether their consumption matches their reservations with a consistent, high-level number. We apply the same approach to tools like Dataproc by aggregating up the costs of component services and providing an organizational cost for those services.
How we use performance signals to improve user efficiency
Instead of overcorrecting for occasional performance fluctuations by allocating excessive resources, we try to align incentives so that people make the right choices for the business. Showback doesn’t work in a vacuum — it requires context and integrated insights. Teams need to show the cost of running a dashboard as well as the ROI is in terms of end user engagement and what peer dashboards with equivalent source datasets might cost.
We want to give users the freedom to do things the way they want and need to while also educating them on achieving their goals and using best practices to reduce their costs and improve their performance. The goal is never for all dashboards to load “less than x seconds” — we believe that any dashboard can load in x seconds when it is properly designed and resourced.
For instance, BigQuery allocates slots for a new workload quickly and efficiently, and queries that are optimized and have dedicated resources consistently complete quickly. When users experience a slowdown, it’s typically because they are sharing resources or inefficiently using their resources. Variable performance is a useful signal to help users discover opportunities to optimize queries and work more productively. We value these signals as we like to focus on the aggregate experience of all users interacting with the tool, not individual interaction.
A natural way to improve user efficiency is to reward ideal behaviors and discourage those that do not align with our analytics strategy. Some examples include splitting out high-demand reporting from ad-hoc exploration to reduce concurrency errors or encouraging people to use materialized tables instead of writing complex custom SQL. For instance, a dedicated reporting project might only include an organization’s Data Studio dashboard if it directly references a table or meets other optimization requirements. Using this approach, we give our users a high degree of freedom and experimentation at the entry-level while providing a well-documented path to scale.
Visibility into query performance improves business performance
The detailed tracking information we get from Google Cloud products is critical — Google’s robust analytics performance has enabled us to scale Data Studio to over 15,000 Wayfarians. Of course, a larger user base always comes with concerns that less sophisticated users may not appropriately optimize their queries or make the best use of the infrastructure.
Evaluating the different Data Studio dashboards helps us identify opportunities to use better query optimization practices, such as reducing custom queries, connecting directly to permanent tables, or using the BI Engine to improve dashboard performance. Recently, our team built new billing projects specific for Data Studio reporting. We can scale up a reservation dedicated to reporting about a major sales event in minutes.
Beyond everyday reporting, holidays and sales events may require higher, guaranteed performance. BigQuery’s flexible capacity commitments allow us to decide at a business level whether an urgent need requires us to reprioritize resources immediately or whether we have the time to optimize queries and rebuild dashboards to be performant. These new billing projects let us evaluate if teams need to scale up resourcing, what areas they can optimize in BigQuery, or if a new reservation is needed to resource that team separately.
Recommendations for achieving high performance at low cost
Are you wondering how to allocate BigQuery slots? Teams must see direct, immediate return on their investment in performance and optimization.
Our first rule of thumb is to align resource utilization with ownership as closely as possible. This makes it easier for teams to secure dedicated resources, even if they start out small. We’re comfortable doing this because BigQuery dynamically reassigns capacity between the targeted reservation and other consumers in milliseconds. We always get the total usage of our slots — there is no wasted capacity even when we break assignments down granularly.
Once a team has a reservation, we provide reporting that consumes various BigQuery information schema views, such as query logs and reservation information, and processes it into aggregated reporting. We look for metrics like the average slots available to a query at a point in time, overall query performance, and how long queries took to execute to pinpoint the overall health of a reservation against our business objectives. Flex slots also let us experiment easily with additional capacity, and BigQuery’s performance is so consistent that we can use straightforward models to estimate return on additional slot investment.
Other key cost optimization tips we have found helpful at Wayfair include:
- Optimize for worst-case performance. Given BigQuery’s ability to share slots, we expect teams will often see much better performance, but we find that thinking it’s more effective when teams think about the most pessimistic case when resourcing their jobs.
- Take advantage of BI Engine reservations. We like to think critically about the data and workload. BI Engine reservations are excellent for workloads that query lots of small dimension tables or a few larger tables loaded into memory. In cases like that, such as with OLAP tools using pre-computed aggregates, we’ve seen BI engine investments drive a 25% reduction in average query time—excellent ROI.
- Leverage Looker for large, longitudinal datasets. Since Looker supports a wide range of use cases, we see a broader range of performance — p50 is still under a second, but p95 can get as high as a minute. For these cases, we recommend modeling user patterns [first of month, first day of week] and dynamically allocating more slots for these periods while deprioritizing batch workloads in the key windows.
- Lean in heavily on the BQ cache for broad-based reporting. To avoid a Monday morning reporting lag, We use the BigQuery cache to avoid Monday morning report loading lags. Up to 30% of our Data Studio queries hit the BQ cache, ensuring our Data Studio p95 consistently stays under 10 seconds.
- Use slots-per-job to improve experience. In our reporting, we find that the most valuable view is slots-per-job. We look for dips in slots available for jobs as this situation often correlates strongly with poor user experiences. For example, our reporting showed us that Looker has the highest volumes of queries and users on Mondays and during each month’s first two business days. We used this information to scale up slots to support these periods of highest demand, delivering on performance SLAs to support business users.

- Get a global picture of usage. We manage slots in a central tool. Teams input their requirements into a calendar to indicate when they want higher or lower capacity to inform our flex slot purchases and annual commitments. It might seem like dozens of relatively inconsistent workloads at the team level, but the picture changes when you look at demand across a week (or our entire business). Understanding global usage makes it easy for us to model baseline capacity recommendations for serving year slots versus flexible demands.
Reaping the rewards of BigQuery
From our first initial undertaking with Google Cloud to transform our storefront, we had a lot of confidence in the underlying technology offerings and the teams that ran them and their ability to meet our unique requirements. But our experience using BigQuery for internal analytics at Wayfair has exceeded our already high expectations.
BigQuery’s fast, dynamic allocation of resources and ability to transform data in place are important to our mission of maintaining consistently high performance for our users while closely managing costs. Moreover, our visibility into query and dashboard performance through BigQuery’s DSP views and other performance metrics have helped us make clearer connections between performance goals and the costs required to meet them — and guide our analysts across the company towards attaining high performance on every project.
An Expert’s Opinion on What Early-stage Startups Must Know

6445
Of your peers have already read this article.
3:00 Minutes
The most insightful time you'll spend today!
As lead for analytics and AI solutions at Google Cloud, my team works with startups building on Google Cloud. This puts us in the fortunate position to learn from founders and engineers about how early-stage startups’ investments can either constrain them or position them for success, even at the seed level. In this post, I want to share a few of the best practices to keep in mind as you’re building.
Understand your value proposition before diving into a technology stack
If you’re launching a startup in the cloud, you’re no doubt thinking about a technology stack, but it’s important to step back a bit and think carefully about the major value proposition that your startup offers to your customers. That value proposition is going to fundamentally drive the kind of technology that you should pick.
For example, does your system need processing in real time, or can it be done in a batch mode? Can you rely on once-a-day insights or do the insights have to come in as events happen?
Additionally, what kind of latency will your customers face? That latency makes your value proposition either usable or unusable. Early on in Google’s development, leaders realized that no one was going to wait more than a few hundred milliseconds for a web page to show them their results, and that realization drove the technology decisions that have allowed Google to scale from being a startup in a garage to being a trillion dollar company. Your startup needs to define its value to customers with this level of specificity before it can build a technology stack suited to its needs.
Focus on customer interactions
A few companies have gracefully pulled off big IT pivots that reshaped their value proposition. Netflix, for example, moved from mostly sending DVDs through the mail to becoming a streaming service and major content producer. That’s a huge shift in the user experience and the technology stack necessary to support it, even if the underlying value proposition (i.e., get content to customers) was broadly the same. But it’s also an outlier. If you’re planning for potential changes of this magnitude, rather than focused on getting your value proposition to users, you probably need to sharpen what that value proposition is.
Specifically, you need a clear vision of how customers will access and interact with your business. Typically, they’ll do so over a website or a mobile app, but there are still so many variables.
Are customers going to transmit documents? If so, in what format? Is handwriting supported or is input limited to typing? Can they use images for optical character recognition? Will it mostly be forms? Will the data be structured or unstructured? If all that sounds a little overwhelming, don’t worry, it’ll seem simpler by the end of this article—but also be aware: we’re just getting warmed up.
Imagine that most of your customers will access your business via voice, so you know you’ll want to prioritize conversational workflows. That’s a start—but dig deeper. Even if we suppose you’re usingDialogflow, a Google Cloud conversational AI platform that lets you build and deploy virtual agents, we’re still not really seeing the value proposition. How will all this work, from the beginning of a typical full customer interaction to the resolution? How many interactions will have to be facilitated over low-bandwidth connections, for example? When it comes to user interactions, make sure you can see an end-to-end use case.
Another example: you’re building a retail website, and one of your end-to-end use cases involves the customer asking if a certain amount of a given product is in stock, whether it’s one unit of the product, ten or hundreds. If the product is not sufficiently stocked, you want your app to offer similar items that are. Will your technology stack support this end-to-end use case?
These considerations are not an argument for premature optimization. There’s value in moving fast, getting minimum viable products to users, and then iterating. But in the early stages, you only get one chance to start on the right foot—and how you navigate that chance will influence a lot of dollars and effort down the road. You need to make sure you have business use cases, not just an idea, before you can start designing a technology stack.
Here’s how to get in the right frame of mind. Pick three use cases: two that are “bread and butter” and one that is technologically complex. Make sure your proposed technology stack can support all three, end to end.
Default toward higher levels of abstraction
Now that we’re in the right frame of mind, we’re ready to think about the technology stack more directly.
As a startup, you’ll need to conserve resources, and to do that, you’ll want to build at the highest level of abstraction possible for your value proposition. For example, you probably don’t want your people setting up clusters. You don’t want them configuring things if they can use a fully managed service. You want them focused on building your prototype, not managing infrastructure.
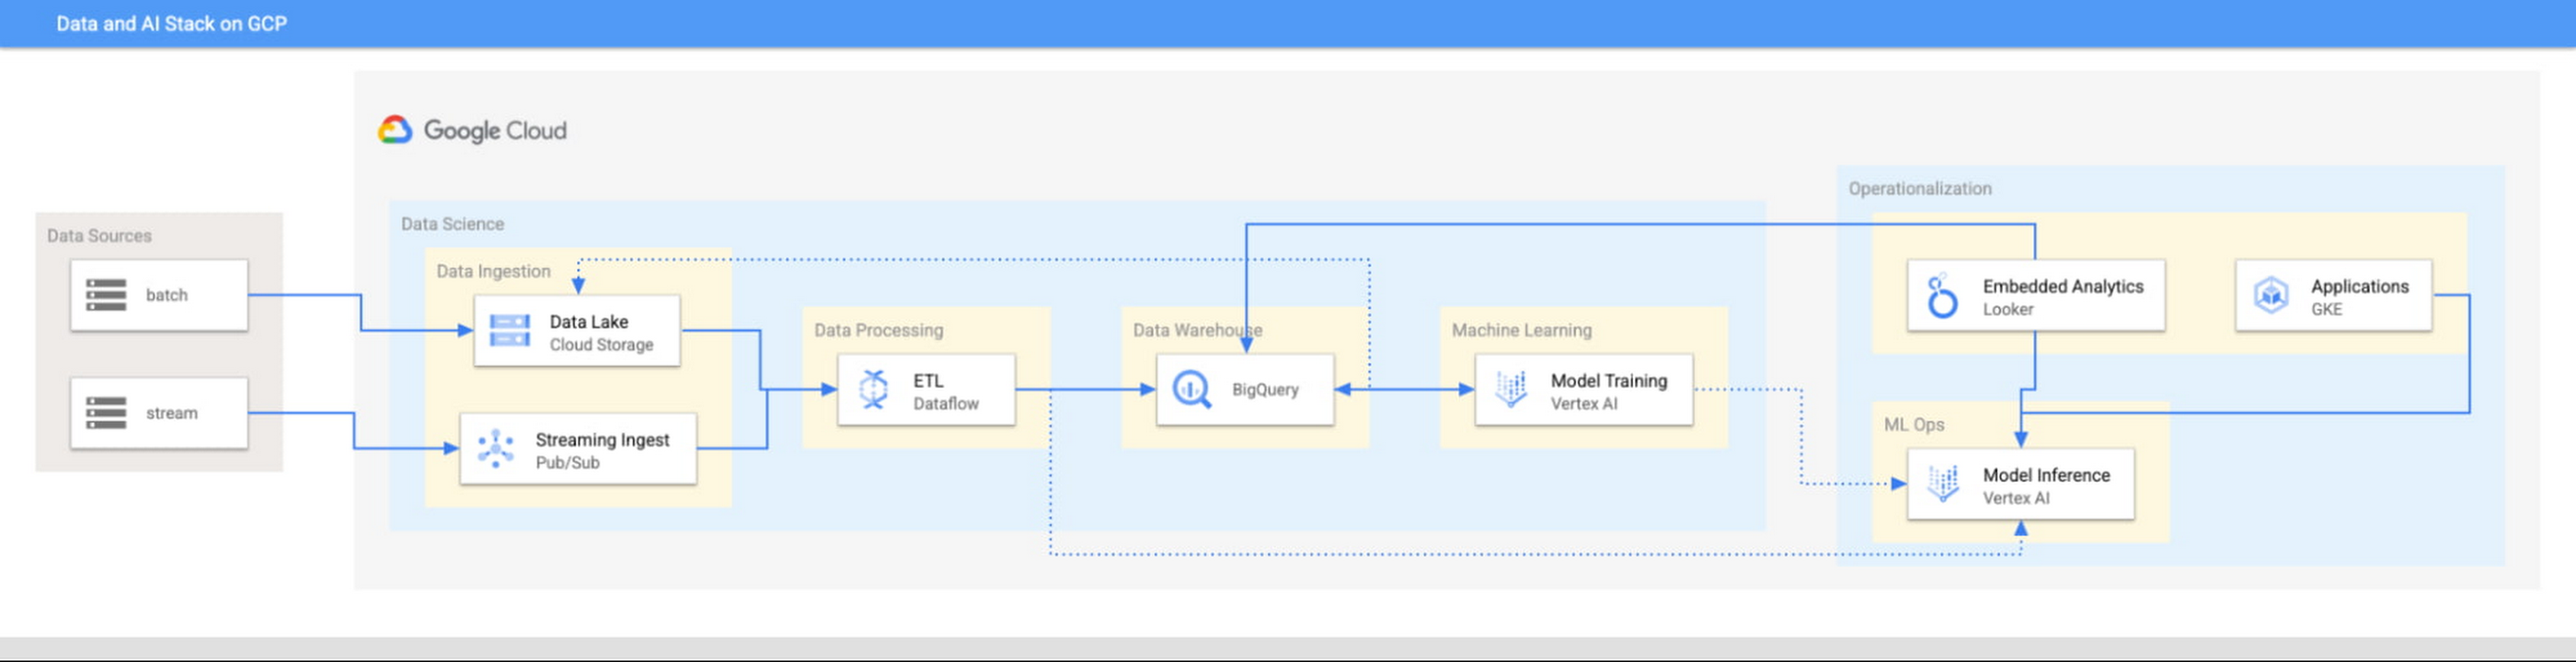
This focus has definitely informed how we create products at Google Cloud, as our canonical data stack—Pub/Sub, Dataflow, BigQuery, and Vertex AI—consists of auto-scaling and serverless products.
But management of infrastructure is not the only place where you should err toward a less-is-more philosophy.
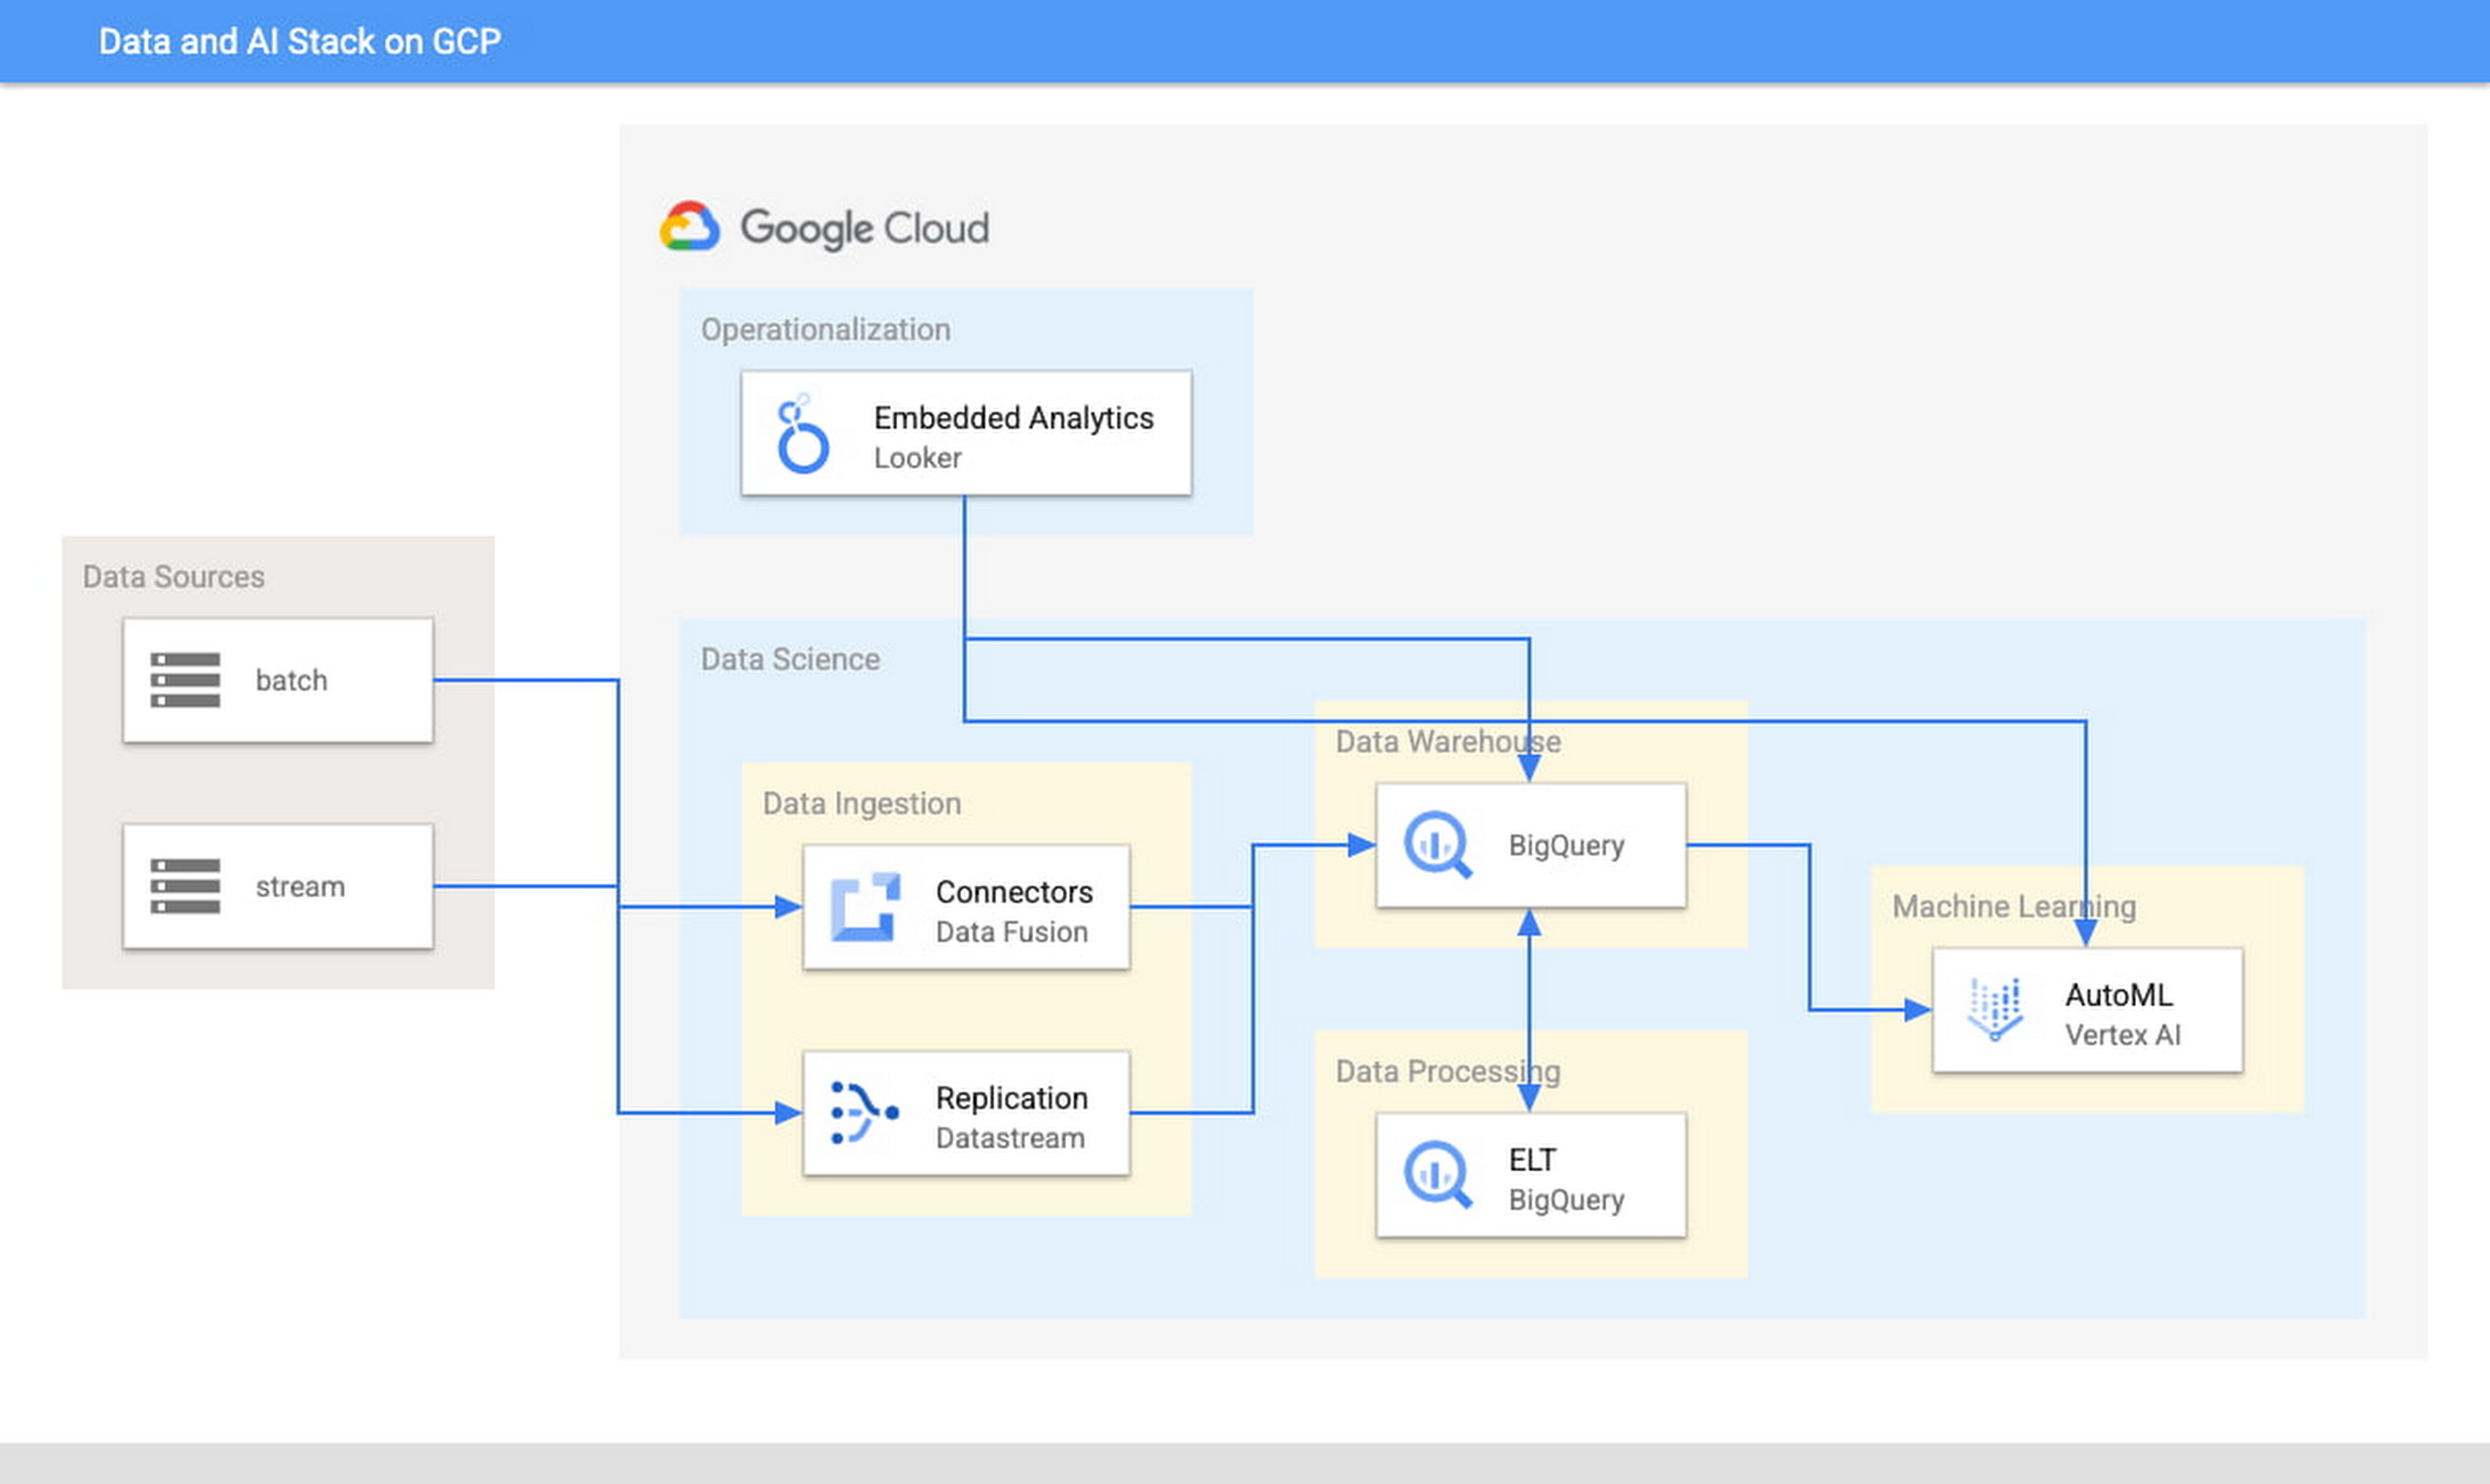
When it comes to architecture, choose no-code over low-code and low-code over writing custom code. For example, rather than writing ETL pipelines to transform the data you need before you land it into BigQuery, you could use pre-built connectors to directly land the raw data into BigQuery. That’s no code right there. Then, transform the data into the form you need using SQL views directly in the data warehouse. This is called ELT, and it is low code. You will be a lot more agile if you choose an ELT approach over an ETL approach.
Another place is when you choose your ML modeling framework. Don’t start with custom TensorFlow models. Start with AutoML. That’s no-code. You can invoke AutoML directly from BigQuery, avoiding the need to build complex data and ML pipelines. If necessary, move on to pre-built models from TensorFlow Hub, HuggingFace, etc. That’s low-code. Build your own custom ML models only as a last resort.
Focus on getting your vision to market, not chasing technology hype
The goal is to pick the right technology stack for bringing your vision to market, generating value for customers, conserving resources, and maintaining flexibility for growth. Early IT investments should usually gravitate toward things that preserve flexibility, such as managed services built on standard protocols or open APIs, but they needn’t always rush to the flashiest technologies. The answer isn’t always ML, for example. The answer might be heuristics to start, with a path to ML once you have collected enough data. You want to make sure that your intelligence layer has enough abstraction so you can mark it up with simple rules at first, but then replace it with a more robust system as you go along.
Launch and iterate fast with these principles
The preceding discussion is a reminder that your most expensive resource is your people—and that you really want them to be focused on building your prototype, minimum viable product or production app You want to launch fast and iterate fast, and the only way you can do that is by focusing on the things that differentiate you.
But regardless of the technologies you use, the bottom line is the same: follow these four principles.
- Figure out your major value proposition and design your tech stack around it.
- Be very careful about user interactions. User experience is super important; you need to make sure you deliver the kind of experience that your customers have grown to expect.
- When you’re building, pick the highest possible level of abstraction possible—the most fully managed tools and no-code/low-code frameworks that give you the functionality that you need.
- Instead of choosing new or flashy technologies, consider if you can build a “good enough” minimum viable product quickly and come back to a better implementation later.
To learn more about why startups are choosing Google Cloud, click here.
BURGER KING Germany: Serving Up Marketing Insights and Supply Chain Visibility Easily

13929
Of your peers have already read this article.
8:30 Minutes
The most insightful time you'll spend today!
Do hamburgers really come from Hamburg? This may still be a matter of debate, but the popularity of American-style burger joints not just in Hamburg but all over Germany, is clear. Germany’s top two fast food companies are both burger chains. One of them is BURGER KING®, a global brand that welcomes more than 11 million customers worldwide every day. The company arrived in Germany in 1976, when its first restaurant opened in Berlin. It now operates more than 100 restaurants across Germany, with franchisees operating more than 600 restaurants of their own.
“In the fast food industry, being able to move quickly is very important. That means delivering the right promotion to our app or launching a viral campaign within days. To do that across more than 700 restaurants, we need the support of the right technology.”
—Oliver Mielentz, IT Manager, BURGER KING® Deutschland GmbH
Previously a subsidiary of the U.S. business, BURGER KING® Germany became an independent company in 2015. As a result, it needed to develop its own IT infrastructure, and the changeover needed to happen fast. “We had to put in place systems that would work for the entire network of franchisees and enable us to easily roll out campaigns,” explains Oliver Mielentz, IT Manager at BURGER KING® Deutschland GmbH.
With the help of Google Cloud Premier partner Cloudwürdig, BURGER KING® Germany chose Google Cloud and G Suite as the right combination to suit its needs.
“In the fast food industry, being able to move quickly is very important,” says Oliver. “That means delivering the right promotion to our app or launching a viral campaign within days. To do that across more than 700 restaurants, we need the support of the right technology.”
Building a franchisee platform in just three months
When a business has multiple franchisees, it’s important to make sure everyone is on the same page, especially in the fast-paced fast food environment. “We have to collate data from all our franchisees and produce reports quickly in order to react to changes in customer behavior,” explains Oliver. “That means processing every transaction that takes place in our restaurants.” Following the restructure, BURGER KING® Germany also needed to build a secure invoicing system with data storage and optimize its communication channels.
“Using Tableau with BigQuery, we’re able to produce reports very quickly. Previously, it took much longer, as data had to be fetched manually. Our reaction time is now almost a business day faster.”
—Oliver Mielentz, IT Manager, BURGER KING® Deutschland GmbH
With support from Witter-IT, BURGER KING® Germany chose Cloudwürdig to build its BKD Connect internal platform on Google Cloud. Thanks to the ready-to-go tools on Google Cloud, it was able to put its invoicing system and data warehouse in place in just three months.
For the BURGER KING® Germany data warehouse, Cloudwürdig built an ETL pipeline that channels ticket data for every sale into BigQuery. “Data is gathered from the restaurants,” says Oliver, “and using Tableau with BigQuery, we’re able to produce reports very quickly. Previously, it took much longer, as data had to be fetched manually. Our reaction time is now almost a business day faster.”
As the ticket data for every transaction is stored in BigQuery, the marketing team can easily see exactly which products are selling well. That’s crucial for tweaking promotions as well as monitoring the supply chain to make sure enough produce is delivered to restaurants in response to changes in demand.
“Thanks to BigQuery, we have a speedy data pipeline that enables us to react on the same day to changes in the market and eliminate bottlenecks in production,” says Oliver.
Switching to G Suite to improve communication
To enable franchisees to sign in to its BKD Connect Platform, BURGER KING® Germany needed a secure authentication system. To solve that problem, it chose to provide franchisees with G Suite accounts. “It’s really easy to set up a new franchisee on the platform. I just create a new G Suite account and Drive folder for it, and it’s ready to go,” says Oliver. G Suite also helps the franchise network to run efficiently, as daily reports are automatically saved to Drive and shared to the appropriate regional network. “Thanks to that system, it’s much easier for any team at headquarters to access the information it needs,” Oliver explains.
BURGER KING® Germany also recently extended its use of G Suite across the whole company. “Following an evaluation of our previous email and productivity software, I made the decision to switch solely to G Suite,” says Oliver. BURGER KING® Germany employees now use Gmail, Calendar, and Drive for their day-to-day productivity needs. “We only just completed the migration, but already, everyone’s happy,” says Oliver. “It’s so easy to share a file using Drive or set up a meeting on Calendar.”
“We’re big fans of Hangouts Meet, and we have two rooms here at our Hanover headquarters equipped with Hangouts Meet hardware,” Oliver adds. “The speech quality is good, and it’s helpful to be able to see every participant, especially when you’re running a meeting with multiple franchisees.”
Optimizing infrastructure to power innovative campaigns
The BURGER KING® app, available for iOS and Android, helps the company to deliver a great customer experience. Through their MyBK accounts, guests can access coupons and special promotions. “We had a really interesting campaign for Easter: guests used the app to hunt for virtual Easter eggs,” explains Oliver. “We knew it was going to be big, and our previous back end wouldn’t have been able to handle the traffic.”
To enable the marketing campaign to go ahead, BURGER KING® Germany moved the back end of the app, along with its website, to Google Cloud. For developing and running its web and app back ends, it now uses App Engine and virtual machines on Compute Engine, as well as Memorystore and Cloud Functions. For monitoring and logging, it uses Stackdriver, and Cloud CDN and Cloud DNS to easily handle its traffic.
“We ran the campaign without any performance issues, even though we were receiving several million hits a day,” says Oliver. Since migrating the back end to Google Cloud, the marketing team also launched the popular “Escape the Clown” campaign. “That campaign blew our minds!” says Oliver. “It wouldn’t have been possible without Google Cloud, because it required a lot of back end capacity.”
To develop the app infrastructure it needs, BURGER KING® Germany relies on Cloudwürdig. “Working with Cloudwürdig is great because the team has the same agile mindset as us,” says Oliver. “When we have a new idea, we just set up a meeting, and in a couple of days the new infrastructure is in place. For Escape the Clown, it only took a few weeks to get everything ready to launch.”
Leveraging integrated tools to grow the business
Using Google Cloud together with G Suite enables BURGER KING® Germany to run its franchise network efficiently, while keeping its IT team lean. “Google Cloud and G Suite are the perfect fit for the way of working at BURGER KING® Germany,” says Oliver. “Many of the company’s operatives are often on the road, visiting restaurants and franchisees. With these tools, they can work flexibly and react quickly to the situation on the ground.”
“In order to grow the business, we need to use the data we receive every day to understand exactly what is happening in our restaurants. With the tools provided by Google Cloud, we can get more guests through the door and offer them a better experience.”
—Oliver Mielentz, IT Manager, BURGER KING® Deutschland GmbH
It also helps to keep infrastructure costs under control. “With Google Cloud, we only pay for what we use, which is really important for us,” Oliver explains. “It means we can scale up quickly if we see an opportunity to react to a trend in customer behavior and launch a new marketing campaign that resonates with the moment. When it’s finished, we can then scale down again, and that definitely saves us money.”
BURGER KING® is now working with Cloudwürdig to add more functionality to the BURGER KING® app using Google Kubernetes Engine. “We like to work with customers long-term to support their digital transformation. BURGER KING® Germany is a great example of how one project can develop into a great collaboration,” says Benny Woletz, Managing Director of Cloudwürdig.
BURGER KING® also plans to expand its presence in Germany and gain a greater market share by further tailoring both its marketing and the way it runs its restaurants to answer its guests’ needs. “In order to grow the business, we need to use the data we receive every day to understand exactly what is happening in our restaurants,” says Oliver. “With the tools provided by Google Cloud, we can get more guests through the door and offer them a better experience.”
More Relevant Stories for Your Company

Transform ‘Dark Data’ from Documents with Document AI, Cloud Functions and Workflows
At enterprises across industries, documents are at the center of core business processes. Documents store a treasure trove of valuable information whether it's a company's invoices, HR documents, tax forms and much more. However, the unstructured nature of documents make them difficult to work with as a data source. We




Baking Gets Sweeter: Build ML Models that Help Predict the Best Recipe!
Baking recipes and ML models have one thing in common—they follow a pattern. Machine Learning is all about finding pattern in data sets, you can predict what you are baking based on the core ingredients and their respective amounts! Bread, cake or cookies, watch the video to make you make

A Look Back on Google Cloud’s Data Analytics Development Efforts from June
June is the month that holds the summer solstice, and some of us in the northern hemisphere get to enjoy the longest days of sunshine out of the entire year. We used all the hours we could in June to deliver a flurry of new features across BigQuery, Dataflow, Data
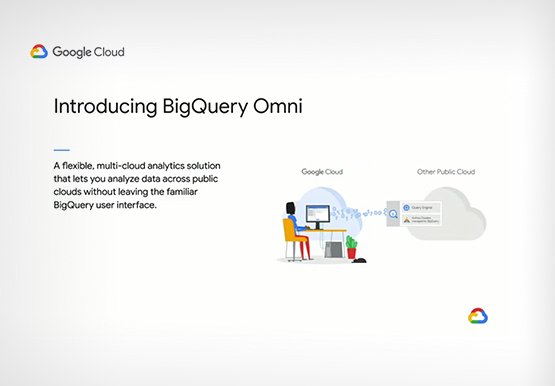
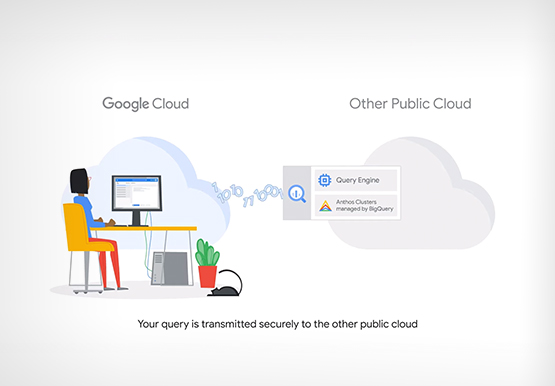
Analytics in a Multi-Cloud World with BigQuery Omni
Enterprises have more data at hand than they have ever had in the past. But are unable to leverage it fully. “We have all of this data at our fingertips. But we just can't quite get to it because we're living in this world of data silos,” says Emily Rapp,
