





What Drives Your Organization to be Data-driven?

4898
Of your peers have already read this article.
4:00 Minutes
The most insightful time you'll spend today!
Every organization has its own unique data culture and capabilities. Yet each is expected to use technology trends and solutions in the same way as everyone else. Your organization may be built on years of legacy applications, you may have developed a considerable amount of expertise and knowledge, yet you may be asked to adopt a new approach based on a technology trend. On the other hand, you may be on the other side of the spectrum, a digitally native organization built with engineering principles from scratch without legacy systems but expected to follow the same principles as process driven, established organizations. The question is, should we treat these organizations in the same way when it comes to data processing? In this series of blogs and papers this is what we are exploring: how to set up an organization from the first principles from data analyst, data engineering and data science point of view. In reality, there is no such organization that is solely driven by one of these but it is likely to be a combination of multiple types. What type of organization you become is then driven by how much you are influenced by each of these principles.
When you are considering what data processing technology encompasses, take a step back and make a strategic decision based on your key goals. This can be whether you optimize for performance, cost, reduction in operational overhead, increase in operational excellence, integration of new analytical and machine learning approaches. Or perhaps you’re looking to leverage existing employees’ skills while meeting all your data governance and regulatory requirements. We will be exploring these different themes and will focus on how they guide your decision-making process. You may be coming from technologies which are solving some of the past problems and some of the terminologies may be more familiar, however they don’t scale your capabilities. There is also the opportunity cost of prioritizing legacy and new issues that arise from a transformation effort, and as a result your new initiative can set you further behind on your core business while you play catch up to an ever changing technology landscape.
Data value chain
The key for any ingestion and transformation tool is to extract data from a source and start acting on it. The ultimate goal is to reduce the complexity and increase the timeliness of the data. Without data, it is impossible to create a data driven organization and act on the insights. As a result, data needs to be transformed, enriched, joined with other data sources, and aggregated to make better decisions. In other words, insights on good timely data mean good decisions.
While deciding on the data ingestion pipeline, one of the best approaches is to look into the volume of data, the velocity of the data, and type of data that is arriving. Other considerations include the number of different data sources you are managing, whether you need to scale to thousands of sources using generic pipelines, whether you want to create one generic pipeline but then apply data quality rules and governance. ETL tools are ideal for this use case as generic pipelines can be written and then parameterized.
On the other hand, consider the data source. Can the data be directly ingested without transforming and formatting the data? If the data does not need to be transformed and can be ingested directly into the data warehouse as a managed solution. This not only reduces the operational costs but also allows for more timely data delivery. If the data is coming in through an unstructured format such as XML or in a format such as EBCDIC and needs to be transformed and formatted, then a tool with ETL Capabilities can be used depending on the speed of the data arrival.
It is also important to understand the speed and time of arrival of the data. Think about your SLAs and time durations/windows that are relevant for your data ingestion plans. This would not only drive the ingestion profiles but would also dictate which framework to use. As discussed above, velocity requirements would drive the decision-making process.
Type of Organization
Different organizations can be successful by employing different strategies based on the talent that they have. Just like in sports, each team plays with a different strategy with the ultimate goal of winning.
Organizations often need to decide on what’s the best strategy to take in respect to data ingestion and processing – whether you need to hire an expensive group of data engineers, or exploit your data wizards and analysts to enrich and transform data that can be acted on, or whether it would be more realistic to train the current workforce to do more functional/high value work rather than to focus on building generally understood and available foundational pieces.
On the other hand, the transformation part of ETL pipelines as we know it, dictates where the load will be. All of these are made a reality in the cloud native world where data can be enriched, aggregated, and joined. Loading data into a powerful and modern data warehouse means that you can already join and enrich the data using ELT. Consequently, ETL isn’t really needed in its strict terms anymore if the data can be loaded directly into the data warehouse.
All of the above was not possible in the traditional, siloed, and static data warehouses and data ecosystems whereby systems would not talk to each other or there were capacity constraints in respect to both storing and processing the data in the expensive Data Warehouse. This is no longer the case in the BigQuery world as storage is now cheap and transformations are now much more capable without constraints of virtual appliances.
If your organization is already heavily invested into an ETL tool, one option is to use them to load BigQuery and transform the data initially within the ETL tool. Once the as-is and to-be are verified to be matching, then with the improved knowledge and expertise one can start moving workloads into BigQuery SQL, and effectively do ELT.
Furthermore, if your organization is coming from a more traditional data warehouse that extensively relies on stored procedures and scripting, then the question that one may ask is, do I continue leveraging these skills and expertise and use these capabilities that are also provided in BigQuery? ELT with BigQuery is more natural, similar to what’s already in Teradata BTEQ, Oracle PL/SQL but migrating from ETL to ELT requires changes. This change then enables exploiting streaming use cases, such as real-time use cases in retail. This is because there is no preceding step before data is loaded and made available.
Organizations can be broadly classified under 3 types as Data Analyst Driven, Data Engineering driven, and Blended organization. We will be covering a Data Science driven organization within the Blended category.
Data Analyst Driven
Analysts understand the business and are used to using SQL/spreadsheets. Allowing them to do advanced analytics through interfaces that they are accustomed to enables scaling. As a result, easy to use ETL tooling to bring data quickly into the target system becomes a key driver. Ingesting data directly from a source or staging area then also becomes critical as it allows analysts to exploit their key skills using ELT and increases timeliness of the data. This is commonplace with traditional EDWs and realized by extended capabilities of using Stored Procedures and Scripting. Data is enriched, transformed, and cleansed using SQL and ETL tools act as the orchestration tools.
The capabilities brought by cloud computing on separation of data and computation changes the face of the EDW as well. Rather than creating complex ingestion pipelines, the role of the ingestion becomes, bringing data close to the cloud, staging on a storage bucket or on a messaging system before being ingested into the cloud EDW. This then releases data analysts to focus on looking into data insights using tools and interfaces that they are accustomed to.
Data Engineering / Data Science Driven
Building complex data engineering pipelines is expensive but enables increased capabilities. This allows creating repeatable processes and scaling the number of sources. Once complemented with cloud it enables agile data processing methodologies. On the other hand, data science organizations allow carrying out experiments and producing applications that work for specific use cases but are not often productionised or generalized.
Real-time analytics enables immediate responses and there are specific use cases where low latency anomaly detection applications are required to run. In other words, business requirements would be such that it has to be acted upon as the data arrives on the fly. Processing this type of data or application requires transformation done outside of the target.
All the above usually requires custom applications or state-of-the-art tooling which is achieved by organizations that excel with their engineering capabilities. In reality, there are very few organizations that can be truly engineering organizations. Many fall into what we call here as the blended organization.
Blended org
The above classification can be used on tool selection for each project. For example, rather than choosing a single tool, choose the right tool for the right workload, because this would reduce operational cost, license cost and use the best of the tools available. Let the deciding factor be driven by business requirements: each business unit or team would know the applications they need to connect with to get valuable business insights. This coupled with the data maturity of the organization would be the key to making sure the right data processing tool would be the right fit.
In reality, you are likely to be somewhere on a spectrum. Digital native organizations are likely to be closer to being engineering driven, due to their culture and business that they are in. However, brick and mortar organizations would be closer to being analyst driven due to the significant number of legacy systems and processes they possess. These organizations are either considering or working toward digital transformation with an aspiration of having a data engineering / software engineering culture like Google.
The blended organization with strong skills around data engineering, would have built the platform and built frameworks, to increase reusable patterns would increase productivity and then reduce costs. Data engineers focus on running Spark on Kubernetes whereas infrastructure engineers focus on container work. This in turn provides unparalleled capabilities as application developers focus on the data pipelines and even the underlying technologies or platforms changes code stays the same. As a result, security issues, latency requirements, cost demands and portability are addressed at multiple layers.
Conclusion – What type of organization are you?
Often an organization’s infrastructure is not flexible enough to react to a fast changing technological landscape. Whether you are part of an organization which is engineering driven or analyst driven, organizations frequently look at technical requirements that inform which architecture to implement. But a key, and frequently overlooked, component needed to truly become a data-driven organization is the impact of the architecture on your data users. When you take into account the responsibilities, skill sets, and trust of your data users, you can create the right data platform to meet the needs of your IT department as well as your business.
To become a truly data-driven organization, the first step is to design and implement an analytics data platform that meets your technical and business needs. The reality is that each organization is different and has a different culture, different skills, and capabilities. Key is to leverage its strengths to stay competitive while adopting new technologies when it is needed and as it fits to your organization.
To learn more about the elements of how to build an analytics data platform depending on the organization you are, read our paper here.
Cloud Spanner & Bigtable Helps Sabre Build Consistency & Scalability to Serve 1 Billion Travellers

3638
Of your peers have already read this article.
1:30 Minutes
The most insightful time you'll spend today!
Sabre is an innovative software and technology company that leverages highly scalable databases and artificial intelligence (AI) to power travel industry partners around the globe. Our company processes more than 12 billion shopping requests and serves over 1 billion travelers every year.
The companies that partner with us include airlines, travel websites, agencies, and hotels. We are distinguished by a long history of integrating cutting edge technology into our operations. Our earliest innovations include building one of the first transaction processing systems in existence and a travel distribution network that predates the Internet! Through our next generation of AI-powered solutions, we are focused on optimizing the retailing, distribution, and fulfillment experience of the travel industry.
In my role as chief architect for Sabre Labs, I spearhead the long-term technology choices we are making to enhance the development, deployment, and operation of our software. We’ve embarked on a multi-year strategy to transform our technology and solutions. Rearchitecting our infrastructure to become fully cloud native is a central tenet of this transformation. In these early iterations of our plan, we have seen the significant impact of machine learning and its potential in bringing truly personalized travel experiences to customers. As part of this effort, we’ve established a 10-year partnership with Google to help accelerate our transformation and bring innovation to the travel industry.
Database choices require tradeoffs
The complexity and scale of the travel industry places high demands on the cloud services we utilize. We tend to place more emphasis on how a particular cloud service will impact an application’s reliability, performance, or development time, rather than choosing a service purely for its functionality. When it comes to databases, this can often mean making a tradeoff between latency and consistency.
The tradeoff exists for any database that serves multiple copies of its data in different availability zones or geographic regions for reliability. A database designed to ensure that everyone sees a consistent view of the latest data might update those copies synchronously using a consensus algorithm, which affects how quickly the data can be served. On the other hand, a database that’s optimized for faster data serving might update each copy asynchronously and not guarantee consistent reads across records.
Cloud Spanner and Bigtable–two of Google Cloud’s managed databases–are both highly effective services, and each one could support many of our travel applications. But as you will see, the latency vs. consistency tradeoff made it clear which one was best suited for two of our most critical cases.
Google Cloud Spanner facilitates strong, global consistency for Sabre
An airline’s reservation database stores a passenger’s booking information, seat selection, tickets, special requests, and other critical information about their trip. As a result, this data sits at the consistency end of that consistency/latency spectrum. Sabre typically processes thousands of reservation updates per second on behalf of our carrier customers. An airline’s reservation database must be served from many availability zones (and data is replicated across these availability zones) so that it remains available in the event of an outage. It also requires ACID properties for transactional updates across records since airlines often make changes to multiple passengers and multiple flights at the same time.
We needed a system that can handle bursts of concurrent updates, as would occur during a snowstorm when hundreds of thousands of passengers might be automatically moved to alternate flights. Spanner is a great fit for the reservations case because of its unique consistency guarantees. It processes over 1 billion requests per second at peak and provides five 9s SLA (99.999 percent) to support our applications. Spanner also helps us maintain compliance, business continuity, redundancy, and reliability using the same secure-by-design infrastructure, built-in data protection and replication, and multi-layered security that are essential to our Google Cloud workloads.
Spanner’s client libraries also provide built-in mechanisms to handle retrying in the event of write conflicts with another transaction and allow developers to choose stale reads in read-only transactions for improved performance. Of course, consistency across multiple zones or regions doesn’t come for free. It means higher write latencies than if we wrote to a comparable database running in a single availability zone, but for an application that manages flight reservations, it’s a tradeoff that makes sense.
Bigtable provides predictable, low latency at scale
Our flight shopping systems sit at the other end of the latency/consistency spectrum. Sabre’s shopping engine generates millions of itineraries per second on behalf of travelers using mobile apps, third-party travel websites, and airline call centers. Each itinerary requires significant compute resources to calculate: We need to find which combinations of flights make sense and evaluate complex rules about their availability and pricing. Users are typically less patient while searching for a flight than they are when booking it, so we needed a low latency solution. But we can cache many of these shopping results to reduce our compute usage. For instance we can decide how long to cache results based on factors like how far the flight results are from the departure.
Bigtable makes an excellent choice for this shopping cache. It’s a NoSQL database service built to handle high-throughput, low-latency applications, with more than 10 exabytes of data under management. Bigtable’s unique latency properties—such as predictability and single-digit millisecond response time even for multi-petabyte tables—enable us to serve large volumes of shopping results cost effectively, while providing low response times to travelers.
Google Cloud supports a focus on innovation
Managed databases like Bigtable and Spanner are a significant part of Sabre’s cloud strategy. The combination of unique tools like Key Visualizer for Bigtable and Spanner as well as integration with other Google Cloud services like Cloud IAM, Cloud Monitoring, and now Datastream, make the experience of operating managed databases with Google Cloud much easier than it is with several of their self-hosted counterparts. As a result of their granular pricing models and ability to be deployed and automated by SREs, the managed databases we use also end up with a lower total cost of ownership.
We’re particularly excited about a few recent database-related announcements from Google Cloud. Bigtable’s SLA update gives us more concrete expectations in terms of multi-cluster, multi-region uptime. Spanner’s change to provisioning in Processing Units increases its cost efficiency when deploying in non-production environments where we may need many isolated instances, but won’t come close to the limits of a single node. In those cases, Spanner instances may now be configured in one-tenth of a node increments.
Our cloud transformation depends on having a choice of databases for different use cases, trade offs, and migration schedules. In addition to managed databases, we expect to use self-hosted databases, database solutions available in Cloud Marketplace, and transitional services like Cloud SQL for a few more years. In an industry as demanding as travel, accelerating our most critical applications using technology unique to Google Cloud means less time spent optimizing latency and consistency, and more time spent innovating.
Learn more about how your organization can use Bigtable and Spanner.
4233
Of your peers have already watched this video.
54:00 Minutes
The most insightful time you'll spend today!
Behind the Scenes: How eBay Provides its Customers New Shopping Experiences
“If it exists in the world, you are likely to find it on eBay.” So they say. With 180 million buyers and a global presence in over 190 markets, it’s probably true. A company that emerged out of the ashes of the dot-com bubble, eBay today is one of the most renowned organizations in the world.
eBay catalog has over 1 billion listings available worldwide at any given point in time and over 15 million listings are added on a daily basis. That essentially means many datasets from different sources. And that was a challenge.
The company needed a scalable and flexible platform to efficiently enable new shopping experiences globally, showcasing unique eBay inventory. It needed to iterate quickly and integrate data-heavy AI technologies.
eBay turned to Cloud Bigtable from Google. Today, Cloud Bigtable handles eBay’s global catalog with billions of listings, scaling to hundreds of terabytes with many millions of reads and writes, and gigabytes of data transferred in and out every second.
This helped eBay synchronize its entire catalog over GCP in near real-time with low latency and high consistency. It also enabled the company to serve catalog data to other services on GCP with high read volume and low latency and keep and serve all listing images in GCP along with AI vision signatures.
Find out how.

AirAsia Turns to Google Cloud to refine Pricing, Increase Revenue, and Improve Customer Experience
DOWNLOAD CASE STUDY7133
Of your peers have already downloaded this article
1:30 Minutes
The most insightful time you'll spend today!
AirAsia needed a platform incorporating products that could capture, process, analyze, and report on data, while delivering value for money and meeting its speed and availability requirements. The airline also wanted to minimise infrastructure management and system administration demands on its technology team members.
The airline conducted a proof of concept and found Google Cloud Platform—including the Google BigQuery analytics data warehouse—was the best fit.
AirAsia was impressed by the ease and flexibility with which it could extract, transform, and load customer data from its systems, websites, and mobile applications into Google BigQuery for analysis. Reporting and dashboards were quickly and effectively delivered through Google Data Studio.
“With a minimal number of people involved, we can very quickly transform an idea or thought process into a deliverable. Prior to Google Cloud Platform, bringing those ideas to fruition would have been impossible,” says Nikunj Shanti, Chief Data and Digital Officer, AirAsia.
Recommendations for Modelling SAP Data inside BigQuery

8442
Of your peers have already read this article.
4:00 Minutes
The most insightful time you'll spend today!
Over the past few years, many organizations have experienced the benefits of migrating their SAP solutions to Google Cloud. But this migration can do more than reduce IT maintenance costs and make data more secure. By leveraging BigQuery, SAP customers can complement their SAP investments and gain fresh insights by consolidating enterprise data and easily extending it with powerful datasets and machine learning from Google.
BigQuery is a leading cloud data warehouse, fully managed and serverless, and allows for massive scale, supporting petabyte-scale queries at super-fast speeds. It can easily combine SAP data with additional data sources, such as Google Analytics or Salesforce, and its built-in machine learning lets users operationalize machine learning models using standard SQL — all at a comparatively low cost.
If your SAP-powered organization is looking to supercharge its analytics with the strength of BigQuery, read on for considerations and recommendations for modeling with SAP data. These guidelines are based on our real-world implementation experience with customers and can serve as a roadmap to the analytics capabilities your business needs.
Considerations for data replication
Like most technology journeys, this one should start with a business objective. Keeping your intended business value and goals in mind is critical to making the right decisions in the early steps of the design process.
When it comes to replicating the data from an SAP system into BigQuery, there are multiple ways to do it successfully. Decide which method will work best for your organization by answering these questions:
- Does your business need real-time data? Will you need to time travel into past data?
- Which external datasets will you need to join with the replicated data?
- Are the source structures or business logic likely to change? Will you be migrating the SAP source systems any time soon? For instance, will you be moving from SAP ECC to SAP S/4HANA?
You’ll also need to determine whether replication should be done on a table-by-table basis or whether your team can source from pre-built logic. This decision, along with other considerations such as licensing, will influence which replication tool you should use.
Replicating on a table-by-table basis
Replicating tables, especially standard tables in their raw form, allows sources to be reused and ensures more stability of the source structure and functional output. For example, the SAP table for sales order headers (VBAK) is very unlikely to change its structure across different versions of SAP, and the logic that writes to it is also unlikely to change in a way that affects a replicated table.
Something else to consider: Reconciliation between the source system and the landing table in BigQuery is linear when comparing raw tables, which helps avoid issues in consolidation exercises during critical business processes, such as period-end closing. Since replicated tables aren’t aggregated or subject to process-specific data transformation, the same replicated columns can be reused in different BigQuery views. You can, for instance, replicate the MARA table (the material master) once and use it in as many models as needed.
Replicating pre-built logic
If you replicate pre-built models, such as those from SAP extractors or CDS views, you don’t need to build the logic in BigQuery, since you’re using existing logic. Some of these extraction objects have embedded delta mechanisms, which may complement a replication tool that can’t handle deltas. This will save initial development time, but it can also lead to challenges if you create new columns, or if customizations or upgrades change the logic behind the extraction.
It’s also important to note that different extraction processes may transform and load the same source columns multiple times, which creates redundancy in BigQuery and can lead to higher maintenance needs and costs. However, replicating pre-built models may still be a good choice, since doing so can be especially useful for logic that tends to be immutable, such as flattening a hierarchy, or logic that is highly complex.
How you approach replication will also depend on your long-term plans and other key factors — for example, the availability (and curiosity) of your developers, and the time or effort they can put into applying their SQL knowledge to a new data warehouse.
With either replication approach, bear in mind when designing your replication process that BigQuery is meant to be an append-always database — so post-processing of data and changes will be required in both cases.
Processing data changes
The replication tool you choose will also determine how data changes are captured (known as CDC – change data capture). If the replication tool allows for it (for example as SAP SLT does) the same patterns described in the CDC with BigQuery documentation also apply to SAP data.
Because some data, like transactions, are known to be less static than others (e.g., master data), you need to decide what should be scanned in real time, what will require immediate consistency, and what can be processed in batches to manage costs. This decision will be based on the reporting needs from the business.
Consider the SAP table BUT000, containing our example master data for business partners, where we have replicated changes from an SAP ERP system:
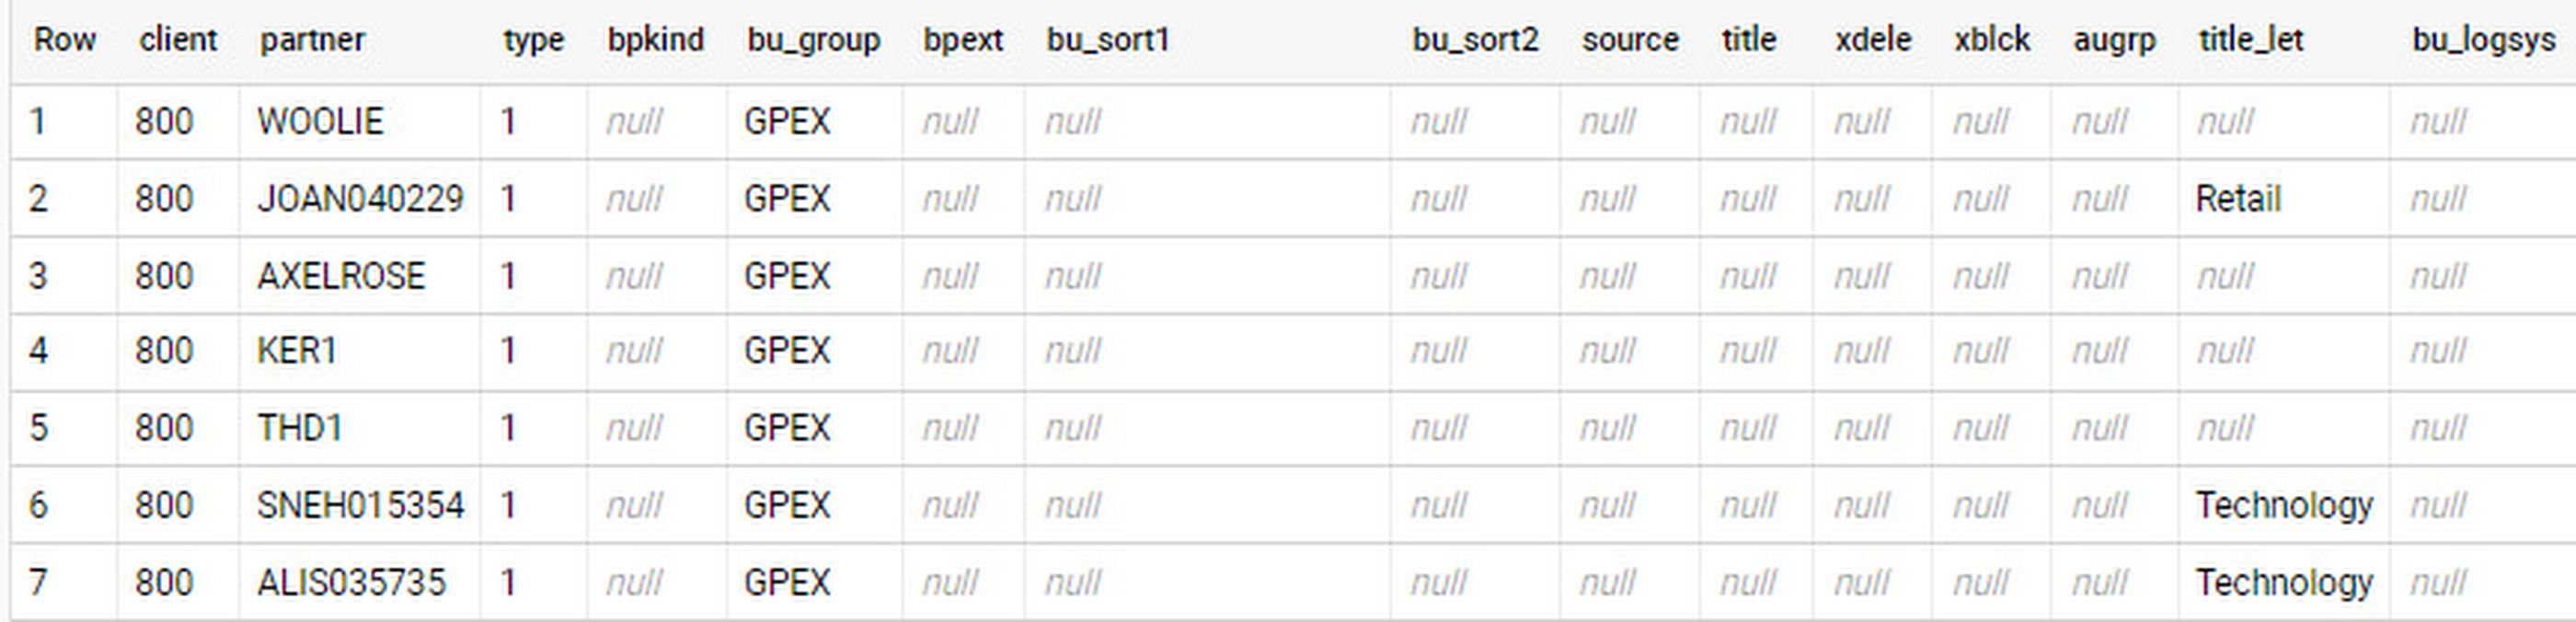
In an append-always replication in BigQuery, all updates are received as new records. For example, deleting a record in the source will be represented as a new record in BigQuery with a deletion flag. This applies to whether the records are coming from raw tables like BUT000 itself or pre-aggregated data, as from a BW extractor or a CDS view.
Let’s take a closer look at data coming particularly from the partners “LUCIA” and “RIZ”. The operation flag tells us whether the new record in BigQuery is an insert (I), update (U) or deletion (D), while the timestamps help us identify the latest version of our business partner.
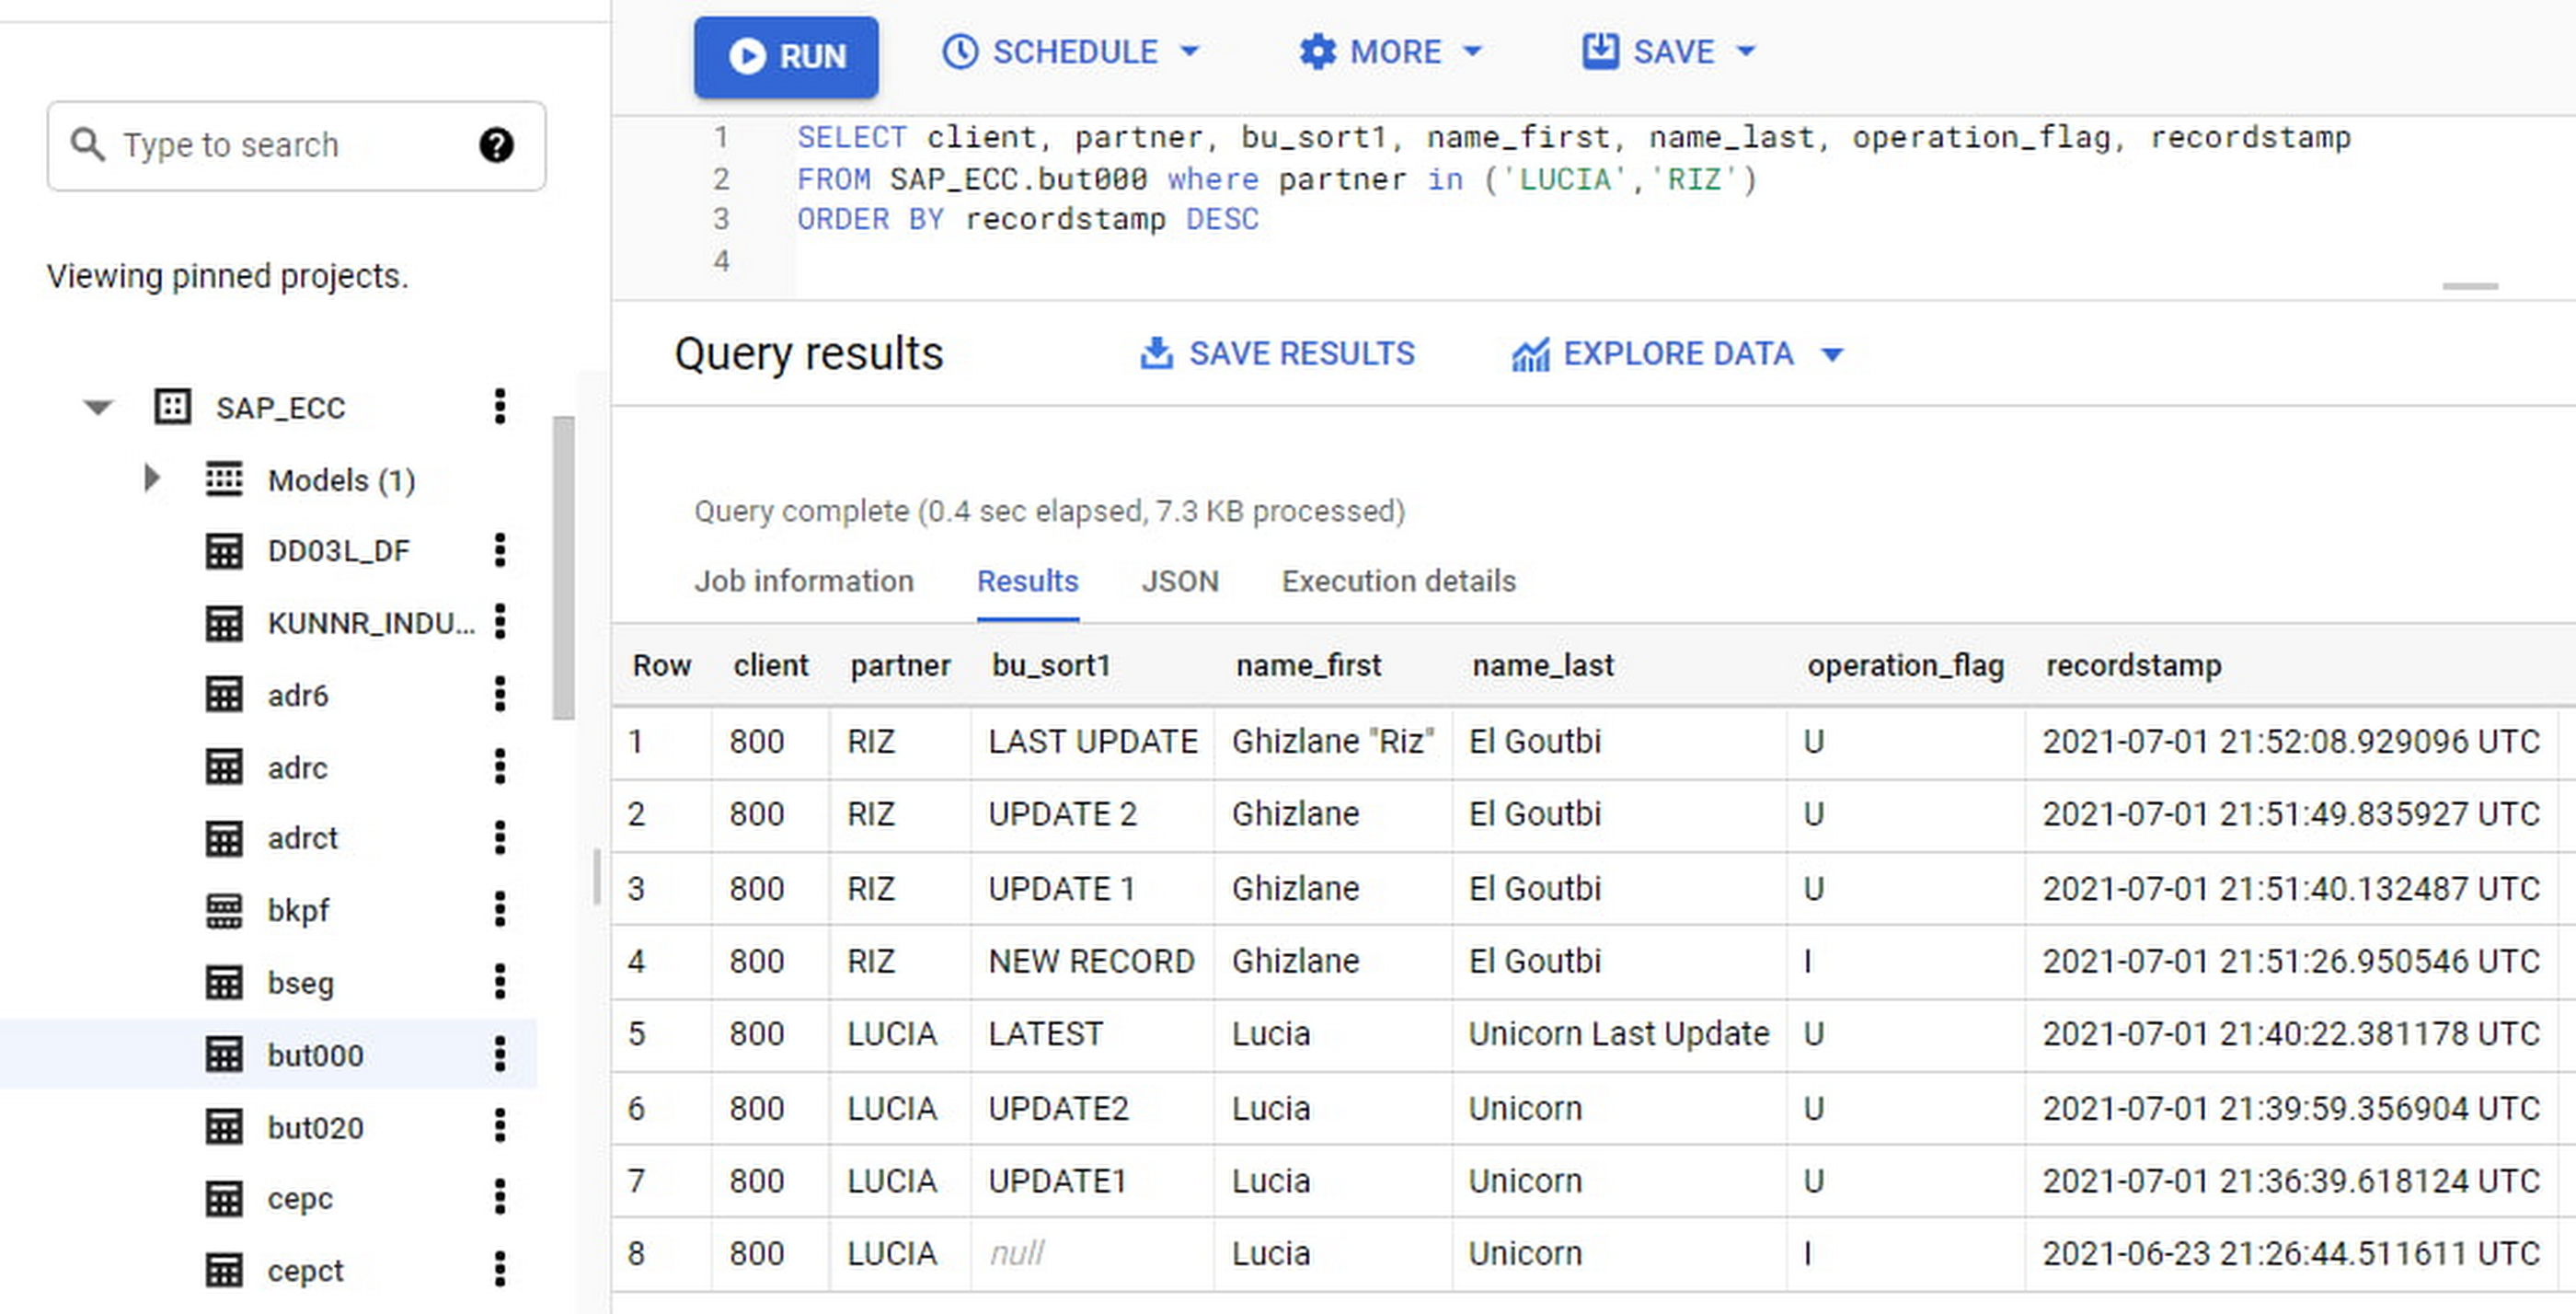
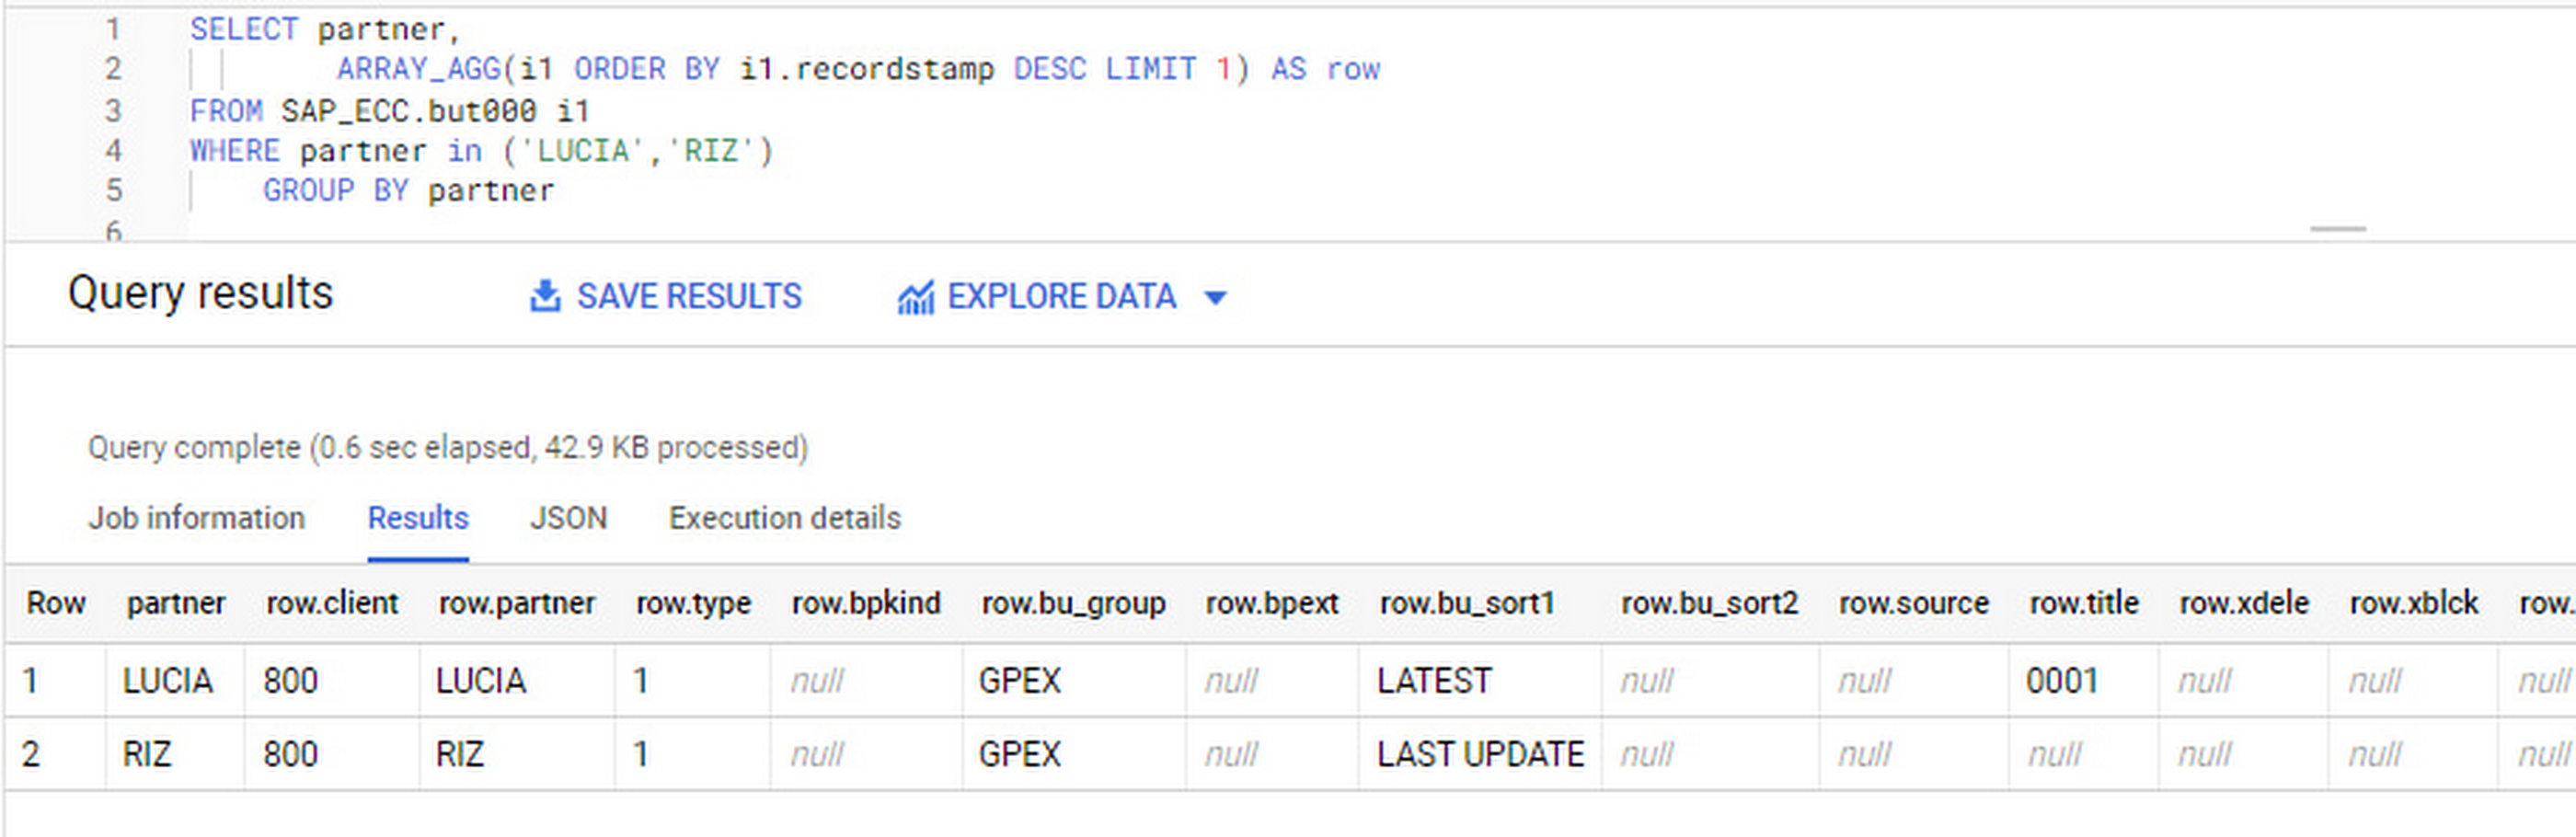
If we want to find the latest updated record for the partners LUCIA and RIZ, this is what the query would look like:
SELECT partner,ARRAY_AGG(i1 ORDER BY i1.recordstamp DESC LIMIT 1) AS rowFROM SAP_ECC.but000 i1WHERE partner in ('LUCIA','RIZ')GROUP BY partner
With the following result:
After identifying stale records for “LUCIA” and “RIZ” business partners, we can proceed to deleting all stale records for “LUCIA” if we do not want to retain the history. In this example, we are using a different table to which the same replication has been done, for the purpose of comparison and to check that all stale records have been deleted for the selection made and that we only kept last updated records. For example:
DELETE SAP_HANA.but000 i1WHEREi1.recordstamp < TIMESTAMP_SUB(CURRENT_TIMESTAMP(), INTERVAL 3 HOUR) ANDi1.recordstamp < (SELECT MAX(recordstamp) FROM SAP_HANA.but000 i2WHEREi1.partner = i2.partnerand partner="LUCIA")
You can also use the following query to retrieve stale records for “LUCIA” partner before moving forward with deletion
SELECT partner, operation_flag, recordstamp FROM SAP_HANA.but000 i1WHEREi1.recordstamp < TIMESTAMP_SUB(CURRENT_TIMESTAMP(), INTERVAL 3 HOUR)ANDi1.recordstamp < (SELECT MAX(recordstamp) FROM SAP_HANA.but000 i2WHEREi1.partner = i2.partnerand partner="LUCIA")
Which produces all of the records, except the latest update:

Partitioning and clustering
To limit the number of records scanned in a query, save on cost and achieve the best performance possible, you’ll need to take two important steps: determine partitions and create clusters.
Partitioning
A partitioned table is one that’s divided into segments, called partitions, which make it easier to manage and query your data. Dividing a large table into smaller partitions improves query performance and controls costs because it reduces the number of bytes read by a query.
You can partition BigQuery tables by:
- Time-unit column: Tables are partitioned based on a “timestamp,” “date,” or “datetime” column in the table.
- Ingestion time: Tables are partitioned based on the timestamp recorded when BigQuery ingested the data.
- Integer range: Tables are partitioned based on an integer column.
Partitions are enabled when the table is created, as in the example below. A great tip is to always include the partition filter as shown on the left-hand side of the query.

Clustering
Clustering can be created on top of partitioned tables by applying the fields that are likely to be used for filtering. When you create a clustered table in BigQuery, the table data is automatically organized based on the contents of one or more of the columns in the table’s schema. The columns you specify are then used to colocate related data.
Clustering can improve the performance of certain query types — for example, queries that use filter clauses or that aggregate data. It makes a lot of sense to use them for large tables such as ACDOCA, the table for accounting documents in SAP S/4HANA. In this case, the timestamp could be used for partitioning, and common filtering fields such as the ledger, company code, and fiscal year could be used to define the clusters.
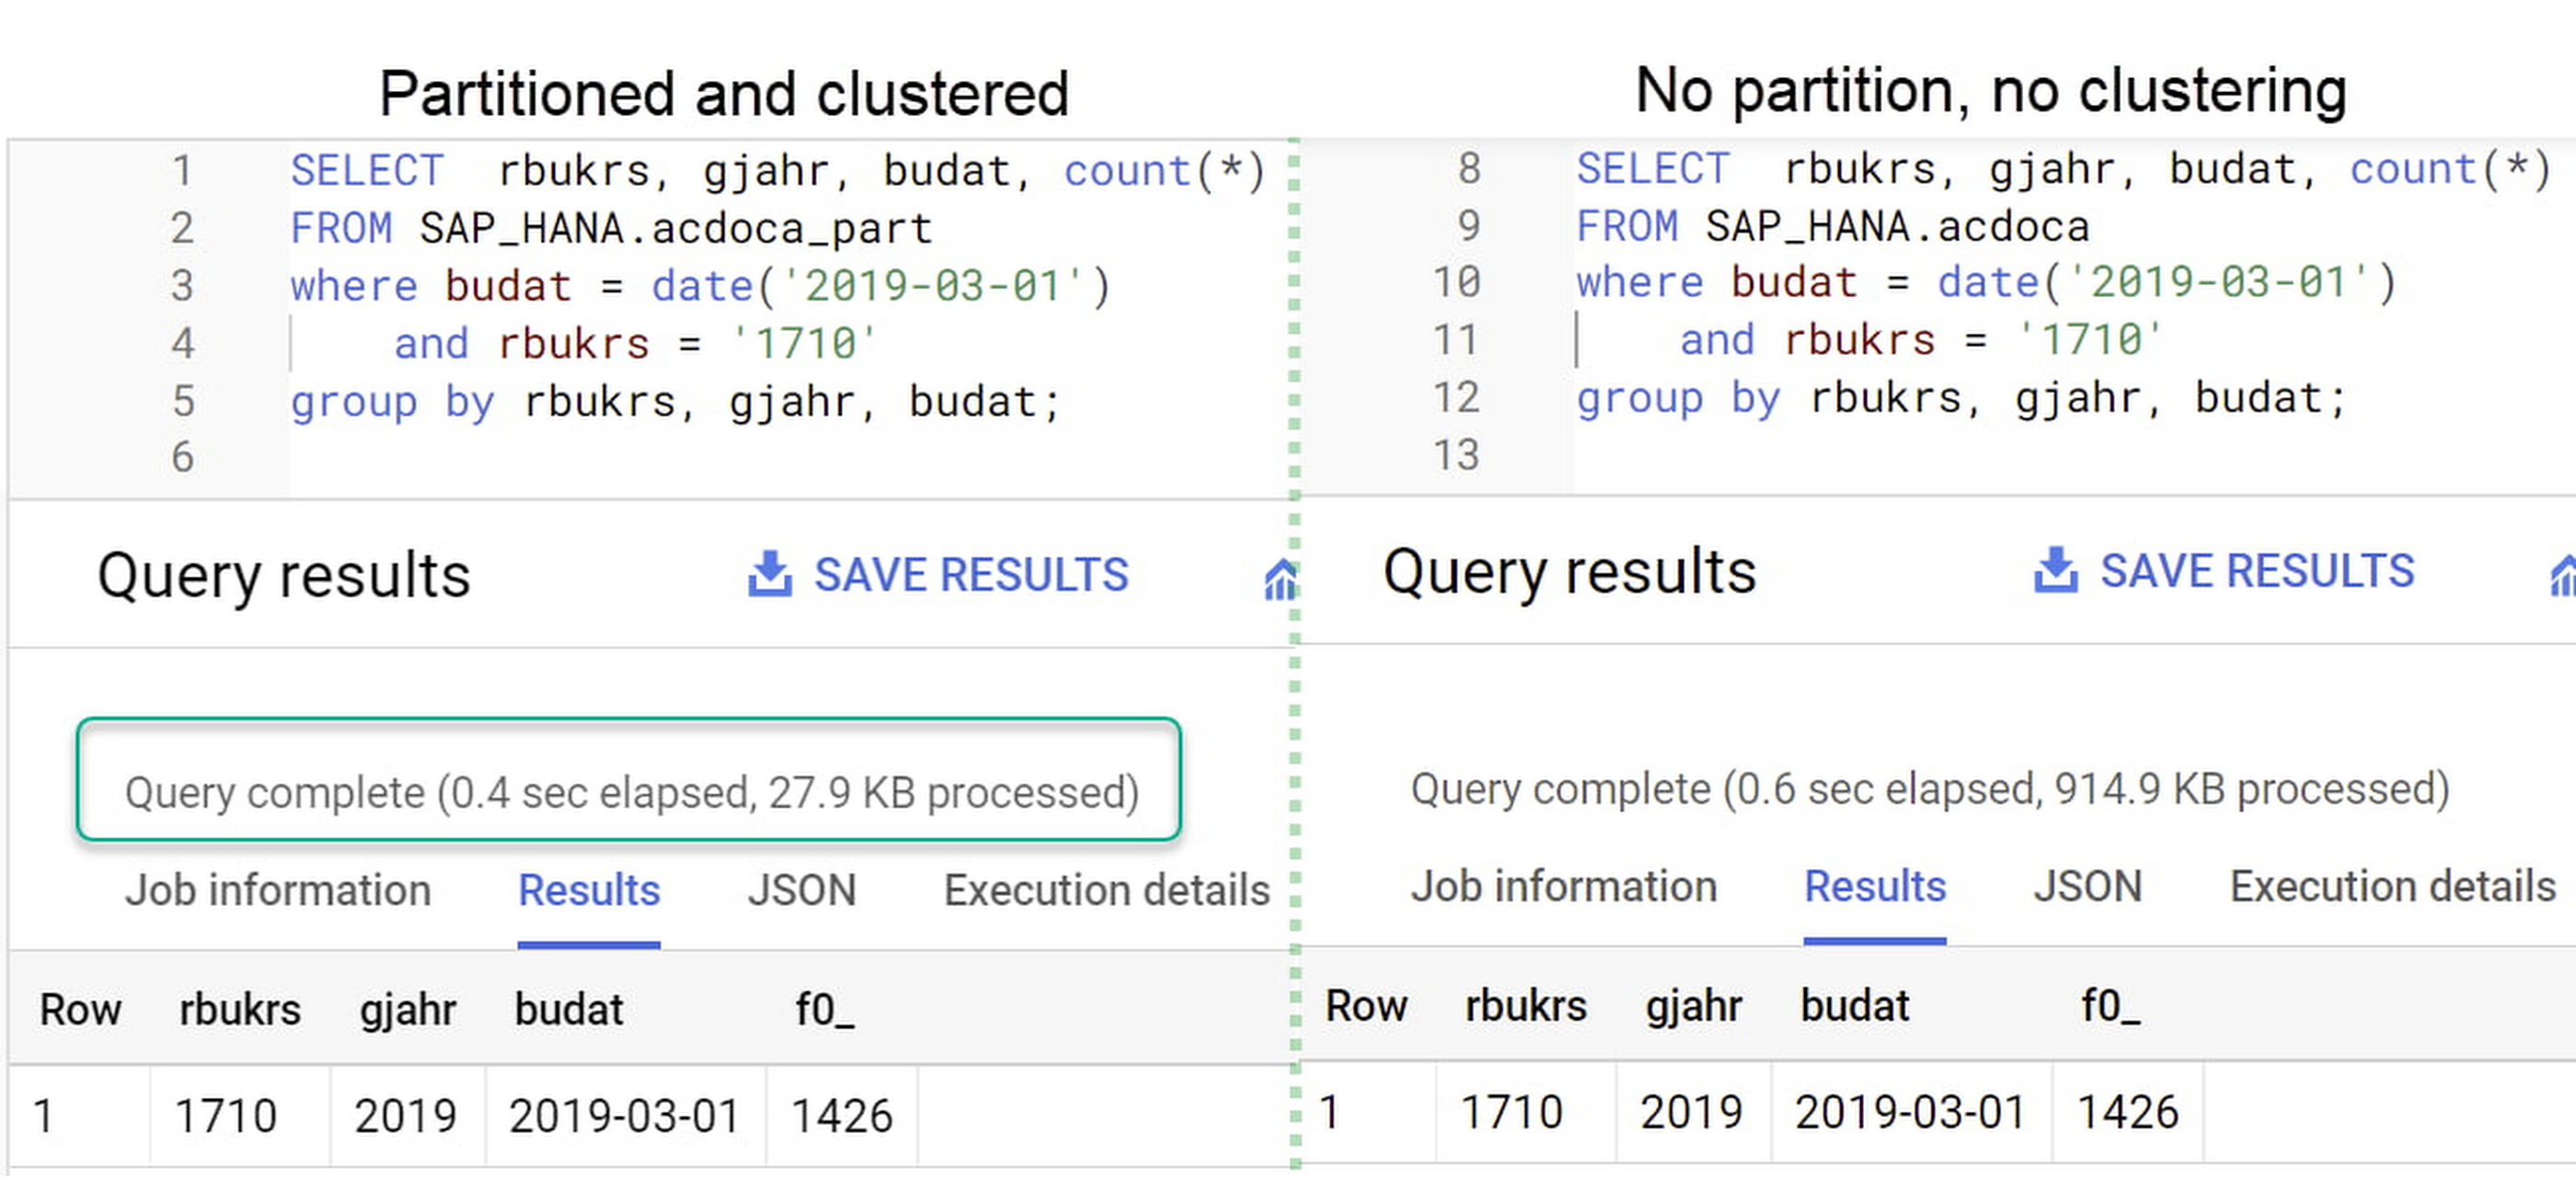
A great feature is that BigQuery will also periodically recluster the data automatically.
Materialized views
In BigQuery, materialized views are precomputed views that periodically cache the results of a query for better performance and efficiency. BigQuery uses precomputed results from materialized views and, whenever possible, reads only the delta changes from the base table to compute up-to-date results quickly. Materialized views can be queried directly or can be used by the BigQuery optimizer to process queries to the base table.
Queries that use materialized views are generally completed faster and consume fewer resources than queries that retrieve the same data only from the base table. If workload performance is an issue, materialized views can significantly improve the performance of workloads that have common and repeated queries. While materialized views currently only support single tables, they are very useful common and frequent aggregations like stock levels or order fulfillment.
Further tips on performance optimization while creating select statements can be found in the documentation for optimizing query computation.
Deployment pipeline and security
For most of the work you’ll do in BigQuery, you’ll normally have at least two delivery pipelines running — one for the actual objects in BigQuery and the other to keep the data staging, transforming, and updated as intended within the change-data-capture flows. Note that you can use most existing tools for your Continuous Integration / Continuous Deployment (CI/CD) pipeline — one of the benefits of using an open system like BigQuery. But, if your organization is new to CI/CD pipelines, this is a great opportunity to gradually gain experience. A good place to start is to read our guide for setting up a CI/CD pipeline for your data-processing workflow.
When it comes to access and security, most end-users will only have access to the final version of the BigQuery views. While row and column-level security can be applied, as in the SAP source system, separation of concerns can be taken to the next level by splitting your data across different Google Cloud projects and BigQuery datasets. While it’s easy to replicate data and structures across your datasets, it’s a good idea to define the requirements and naming conventions early in the design process so you set it up properly from the start.
Start driving faster and more insightful analytics
The best piece of advice we can give you is this: Try it yourself. Anyone with SQL knowledge can get started using the free BigQuery tier. New customers get $300 in free credits to spend on Google Cloud during the first 90 days. All customers get 10 GB storage and up to 1 TB queries/month, completely free of charge. In addition to discovering the massive processing capabilities, embedded machine learning, multiple integration tools, and cost benefits, you’ll soon discover how BigQuery can simplify your analytics tasks.
If you need additional assistance, our Google Cloud Professional Services Organization (PSO) and Customer Engineers will be happy to help show you the best path forward for your organization. For anything else, contact us at cloud.google.com/contact.
AgroStar: Small farms in India getting big help from the cloud

13260
Of your peers have already read this article.
3:30 Minutes
The most insightful time you'll spend today!
AgroStar has launched a cloud-based mobile app that is helping to boost crop yields and encourage best practices for small farmers in India. Launched as an on-premises ecommerce platform selling farm tools in 2008, the firm turned to Google Cloud Platform (GCP) to expand its offering. It now uses cloud-based analytics and is deploying ML models to provide timely advice in five languages on everything from seed optimization, crop rotation, and soil nutrition to pest control.
A 2018 survey underscored the demand for agricultural planning for Indian farmers. While farming remains a dominant sector in India, employing half of its labor force, 70 percent of small farmers – those cultivating fewer than three acres – said their crops are damaged by unforeseen weather and pests. An even higher number – 74 percent – say they lack access to farming-related information.
Widening that gap is the relative lack of access to new, higher yield seeds and improved soil analyses for small farmers, who must otherwise rely on traditional methods. “It could take a few years for innovative information to trickle down from universities to small, grassroots farmers,” says Pritesh Gudge, AgroStar Software Engineer. “Today, just by clicking through our Android application, farmers learn about new, effective farming practices and receive advice customized to their crop and soil.”
Connecting a million farmers in the cloud
Operating in the Indian states of Gujarat, Maharashtra, Rajasthan, Orissa, Bihar, and Karnataka, AgroStar is closing the knowledge gap with a full-service, cloud-based SaaS solution – the only one of its kind in India. It combines agronomy, data science, and analytics to help farmers by providing a variety of resources.
AgroStar has reached over a million farmers through its Android app, the AgroStar Agri-Doctor. The mobile client is available as a web-based or full-featured native app. Both provide access to the firm’s knowledge base hosted on GCP, a Q&A forum that connects farmers to each other to help understand and better solve problems and to learn about innovative practices and products. Farmers can also click through to follow local and national market trends that help forecast crop prices.
In addition to the self-service knowledge base, AgroStar provides access to agronomy experts who use cloud-based analytics tools and historical data to provide season-and locale-specific advice to each farmer. “We are now tracking thousands of calls in 5 languages each day,” says Pritesh.
The AgroStar app also provides links to purchase and then track the delivery of farm tools and supplies such as cultivators and fertilizers. An in-house platform manages fulfillment centers and a doorstep delivery network simplifies the supply chain while giving farmers what they need, when they need it. By procuring directly from the manufacturers and primary distributors of farm supplies, Agrostar is achieving cost savings, which it passes on to farmers.
Build fast, pivot faster
From the start, the human and environmental variables of farming in India, not to mention the volume of AgroStar’s few hundred thousand monthly active users, made a highly scalable cloud-based solution inevitable. Farmers rely on the firm’s Agri-Doctor app to provide advice in multiple languages on topics that range widely throughout three growing seasons, each with distinct crop nutrition and rotation cycles and farm implementation requirements.
“For farmers, the focus keeps changing every month, and every season,” says Pritesh. “To serve our growing community, we needed a platform that could process images at high volume, fulfill tools and seed orders across thousands of miles, and respond to multilingual queries. We quickly moved away from spreadsheets and server-based solutions – we needed to build fast and pivot faster.”
Ending late-night deployments
The firm’s first cloud experience was with an AWS solution. At the time, AWS was the only cloud provider in India, but AgroStar wanted to find a solution that was easier to use and offered better integration with Android devices. “Deployment and processing costs were very high, and the developer tools and documentation were not as intuitive as we needed,” says Pritesh.
When GCP service arrived in India in October 2017, AgroStar embarked on a platform re-implementation that made possible dramatic changes in the way it developed and deployed its solution. Using Google Kubernetes Engine (GKE) for crop advice management and Compute Engine for its production application services, the firm built the backend for the Agri-Doctor discussion forum in only three weeks. The platform’s microservice architecture is implemented in Python and Golang and deployed on GCP.
AgroStar began to realize significant efficiencies in its build, deploy, and test cycles. “We previously needed to work overnight to deploy to production,” says Pritesh. “Now using Google for Kubernetes containers and a rolling update strategy, we can deploy during the day without any problems or interruptions to service.”
The move to GCP streamlined AgroStar’s stack. “We were running 12 independent instances on AWS,” says Pritesh. “With Google Kubernetes Engine, we are deployed on a single cluster at a cost savings of $1,300 per month and growing.”
Improving customer response times by 85 percent
With a managed deployment capability, AgroStar can devote more time and resources to executing on its platform and Agri-Doctor app development plan. A strategic goal was managing customer response times as the firm grew its base. GCP has helped the firm meet that goal, achieving an 85 percent improvement in customer response times even as traffic grew significantly.
“With our on-premises solution, we could handle around 100 customers daily, which took 30 to 50 minutes for each customer,” says Pritesh. “We now handle thousands of customers daily, taking only 4 to 5 minutes for each one.”
AgroStar used Firebase to implement its Agri-Doctor app. A real-time cloud database, Firebase provides an API that enables the Agri-Doctor advice forum to be synchronized across all its far-flung mobile clients, effectively sharing knowledge base updates with one million users in near real time.
Using cloud tools to manage and monitor
Cloud Pub/Sub, Kafka, and Cloud Dataflow manage data ingestion and queueing of event and transaction data to the analytics layer. BigQuery fetches and persists data to Cloud Storage. Cloud SQL and dashboards powered by Tableau deliver farmer crop and soil profiles within minutes.
Cloud IAM helps AgroStar control access to all its cloud resources. And Stackdriver, the integrated logging aggregation capability for GCP, helps monitor and speed debugging on every tier of the AgroStar solution.
Machine learning to enhance yields
AgroStar is developing a variety of ML components to improve responsiveness and extend its platform offerings.
To speed up the diagnosis of and treatment for crop blight, AgroStar is building a deep learning pipeline using TensorFlow. The pipeline relies on GoogLeNet models that use multi-layered convolutional visual pattern recognition. It will assess uploaded images to support a disease-detection capability on the mobile app. Based on the commercially successful AI algorithms that automated postal code processing, GoogLeNet offers improved performance and computational efficiencies by using a creative layering technique that distinguishes them from older, sequential recognition engines.
To improve its customer search experience, AgroStar is developing an ML pipeline that shrinks fetch times by suggesting tags mapped to stored data. Processed using TPUs, Cloud Natural Language and Video AI, the tags provide a metadata layer that supports queries in any of the ten natural languages that AgroStar farmers can use.
The AgroStar search pipeline consists of Long Short-Term Memory (LSTM) models of Recurrent Neural Networks. Recurrent networks exhibit “memory” through iterative processing and are distinguished from feedforward networks by a feedback loop connected to their past decisions, ingesting their own outputs moment after moment as input.
Implementing a recommendation engine
The firm is also adapting the Random Forests TensorFlow AI model to develop a crop and product recommendation engine. The model is trained by consuming numerical (rainfall, humidity, water availability per acre) and categorical (soil type, water sources) parameters to suggest appropriate products by season, region, and locale.
To simplify the product suggestion experience, AgroStar developers are testing Cloud Dialogflow, the Google Cloud conversational interface, to build a chatbot capability into its mobile app. The bot will track a farmer’s crop schedules and answer simple questions by linking to the recommendation engine.
AgroStar is also extending its analytics platform with AI-powered sales planning and forecasting. Using linear regression models implemented in TensorFlow and powered by Cloud ML Engine, the capability will enhance supply chain logistics as the company scales its operations across India.
To provide a credit on-demand offering for a range of seed-to-harvest cycle products, AgroStar is attempting to use Vision API to create an AI model that will convert uploaded photos of customer application records into standard data formats. The firm’s credit policy features a grace period in which farmers begin paying back loans after harvested crops go to market.
A versatile and friendly development ecosystem
AgroStar credits the convivial tools and documentation that GCP offers and its incremental, pay-as-you-go pricing model for both the firm’s success and its ability to manage growth.
“What Google Cloud offers is extremely good documentation and extremely simple-to-use tools and interfaces across all services,” says Pritesh. “It helped us initially deploy our platform and at every scale that we have required since then, and its cost effectiveness enabled us to staff up to meet new feature milestones.”
More Relevant Stories for Your Company

BigQuery Helps Insurance Firms Leverage Previous Storm Data for Better Pricing Insights
It may be surprising to know that U.S. natural catastrophe economic losses totaled $119 billion in 2020, and 75% (or $89.4B) of those economic losses were caused by severe storms and cyclones. In the insurance industry, data is everything. Insurers use data to influence underwriting, rating, pricing, forms, marketing, and

Bitly’s Big Move: A Story of Massive Data Migration to Google’s Cloud Bigtable
Editor’s note: Bitly, the link & QR Code management platform, migrated 80 billion rows of link data to Cloud Bigtable. Here’s how and why they moved this data from a MySQL database, all in just six days. Our goal at Bitly is simple: Make your life easier with connections. Whether you're sharing
Google Cloud Leads the Landscape for Unstructured Data Security Platform: Forrester
As organizations expand their use of cloud computing services, more of their sensitive data inevitably moves to and lives in the cloud. Much of this sensitive data is unstructured and can be challenging to secure. Despite this potential challenge, the usefulness of cloud for data storage and processing is too

Updating Twitter’s Ad Engagement Analytics Platform for the Modern Age
As part of the daily business operations on its advertising platform, Twitter serves billions of ad engagement events, each of which potentially affects hundreds of downstream aggregate metrics. To enable its advertisers to measure user engagement and track ad campaign efficiency, Twitter offers a variety of analytics tools, APIs, and
