





Unlocking Economic Potential: Cloud FinOps

3254
Of your peers have already read this article.
4:00 Minutes
The most insightful time you'll spend today!
Built for a CapEx world, most organizations’ finance systems aren’t set up to take advantage of cloud’s dynamic, OpEx-driven consumption patterns.

GETTY
It may not be a household name yet, but chances are you’ve crossed paths with OpenX today. OpenX, a leader in programmatic advertising, operates one of the world’s largest ad exchanges, serving over 250 billion ad requests per day, connecting more than 30,000 brands and reaching nearly one billion consumers. To make it happen, in 2019, OpenX migrated entirely out of its data centers and became the first major ad-exchange platform to move completely to the cloud.
The OpenX CTO, Paul Ryan, knew that this cloud transformation initiative had the potential to increase costs faster than its revenues. To be successful, he needed his engineering, finance, and business teams to forge a new “cost-aware” culture, complete with effective cost visibility and controls. In other words, he needed Cloud FinOps — an operational framework and cultural shift that brings technology, finance, and business together to drive financial accountability and realize business benefits through cloud transformation.
Ryan laid out a cloud migration roadmap that included cost governance and controls around project ownership, established cost responsibility with engineering teams to accurately forecast cloud consumption, and challenged developers to lower per-unit costs — while at the same time improving performance, scalability, speed and global reach.
It worked! In just 9 months, OpenX reduced their per-unit cost by over 60%. The framework allowed OpenX to launch new regions in a matter of days, reduce their time to market for new features by over 50%, and complete their migration in record time — seven months! “We are now able to stop worrying about legacy infrastructure and focus more on our growth categories,” said Ryan. “Our tech stack is getting smarter and more sophisticated by the day, and we have the flexibility to scale our infrastructure in real-time as the business scales and evolves.”
Unblocking Cloud’s Potential
Cloud holds the key to a successful digital transformation. In fact, McKinsey forecasts that by 2030, the Fortune 500 alone may realize over $1 trillion of EBITDA value drivers associated with public cloud enablement. But unlike OpenX, many companies struggle to achieve near-term value objectives from their cloud investments. Surveys reflect that more than 30% of cloud spend in 2021 was wasted or inefficient, while upwards of 80% of CIOs have yet to achieve the business benefits of migrating to the cloud.
Traditional IT finance processes are ill-suited for cloud infrastructure: Traditional planning and budgeting processes are challenged to address dynamic consumption patterns and complex migrations. Centralized IT budgets using traditional allocations fail to provide the necessary visibility into sources of cost overruns. CapEx-focused cost controls have little ability to manage largely OpEx-driven spend. Trend-based forecasting often inaccurately predicts cloud costs. And developer teams lack access to cost-aware architecture patterns to deploy the applications more efficiently.
Enter Cloud FinOps
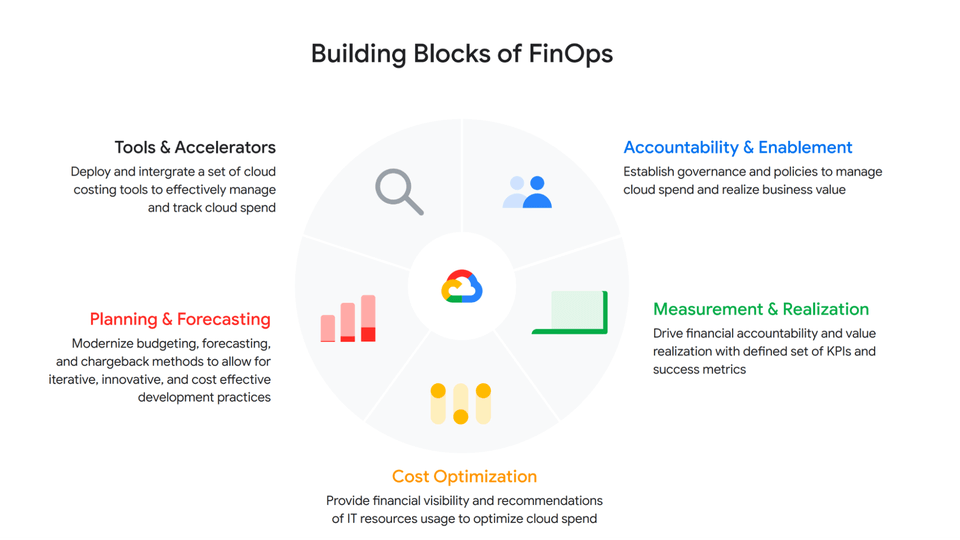
At Google we’ve worked with many companies, like OpenX, to help organizations realize the transformational benefits of the cloud by cultivating a culture of transparency and embedding agile processes to manage costs. We’ve distilled these learnings into a Cloud FinOps operational framework that gives organizations the financial governance and accountability they need to grow their business sustainably.
GOOGLE CLOUD
At a high level, a Cloud FinOps approach depends on five key areas:
- Accountability and Enablement
Accountability and enablement aim at instilling a cost-conscious culture across the organization. Oftentimes, this means standing up a cross-functional and dedicated team with members from technology, finance and engineering to establish cloud financial best practices and governance. In various organizations, we’ve seen this through an extension of a Cloud Center of Excellence, a Cloud Business Office or simply a Cloud FinOps team. Enablement focuses on empowering IT, finance and business leaders through training to help them better understand the economics of cloud services and the strategies to efficiently deploy and manage them. Cloud financial training guides teams on how to design cost-effective cloud environments, for example, embracing ”cloud-native” design principles such as auto-scaling/elasticity and Infrastructure as a Code.
- Measurement and Business Value Realization
Effective measurements not only create awareness and enable agile processes, but also support a culture that celebrates success and rewards teams for achieving business objectives. As such, measurement in the service of business value realization is about developing a comprehensive set of long-term benefits and cost KPIs to quantify the total net value of the return on digital transformation. Organizations often start with cost-related KPIs and eventually evolve those KPIs into business value metrics that are mapped to targeted business outcomes.
- Cloud Cost Optimization
Cloud cost optimization is an iterative and continuous process that provides a consistent methodology to manage cloud consumption cost-effectively. There are three key areas of optimization:
Resource optimization – Model cost-effective cloud usage based on utilization and consumption patterns.
Pricing optimization – Manage cloud spend through a continuous analysis of various pricing models. In a Google Cloud context, that might mean Committed Use Discounts, BigQuery flat rate reservations, etc.
Architecture optimization – Build applications with a cost-aware architecture by leveraging newer generation compute instances (like Tau VMs, which offer an industry-leading 42% better price-performance versus comparable offerings), or using managed services and serverless technology to offload operational overhead.
For example, video hosting, sharing and services platform provider Vimeo built transcoding pipelines by using Google Cloud Spot VMs to optimize their infrastructure spend. To do so, they created fault-tolerant workloads that could withstand preemptions, and in exchange, got up to a 91% discount compared to using regular on-demand instances.
- Planning and Forecasting
In the cloud, accurately forecasting your finances requires rethinking of traditional approaches to depreciation and trend-based forecasting of maintenance and licensing costs. One way to improve the accuracy of your dynamic cloud needs is to use workload-specific forecasting models that leverage a combination of trend-based models for steady-state workloads, driver-based models for scaling applications, as well as monthly variance analysis. In other words, you can define cloud budgets and forecasts by monitoring cloud consumption trends, allocating cloud cost pools with a proper tagging strategy that’s mapped to a chart of accounts in a general ledger, and conducting a cost-benefit analysis based on cloud infrastructure, implementation, and support costs.
- Tools and Accelerators
Without the proper tools and processes in place, understanding and managing cloud costs can be complex — and this especially true as organizations scale their business in the cloud. By deploying proper cloud cost management tools and accelerators such as Looker Cloud Cost Management and automation scripts to set guardrails and enforce cost control policies, organizations can effectively manage and track cloud spend with access to near-real-time billing and cost data to make better informed business decisions.
The key objectives of Google Cloud Cost Management tools are to make it as simple as possible for organizations to get visibility into their current and forecasted costs with built-in reporting and customizable dashboards; help drive greater accountability for cloud spending across the organization by providing flexible ways to organize cloud resources and allocate costs; provide strong financial governance controls to reduce the risk of overspending; and offer intelligent recommendations for optimizing cloud costs and usage.
Start Saving with Cloud
Businesses are continuously seeking to better operate and manage their cloud environments and the need is ever increasing to transparently manage cloud spend, optimize costs, and obtain their desired business agility. By enhancing your Cloud FinOps capabilities and adopting principles of continuous cost optimization, you too can accelerate the business value of cloud computing.
Special thanks to Bruce Warner, Daniel Petibone, Nihar Jhawar and FinOps Foundation community for their contributions and sharing their domain expertise to this important Cloud FinOps topic.
How a Mid-Sized Firm is Shrinking Inventory Carryovers 50% with AI

7440
Of your peers have already read this article.
5:30 Minutes
The most insightful time you'll spend today!
For more than 10 years, NMK Textile Mills has manufactured bed linens for major retailers in the United States and Canada. As e-commerce exploded, the company’s co-founder saw an opportunity to grow the business. So, in addition to manufacturing bed linens wholesale for retail customers, NMK Textile Mills reworked its complete supply chain to manufacture products for California Design Den, which became an e-commerce retailer selling its own fashion-forward products directly to consumers online.
With California Design Den’s push into e-commerce, it became apparent the SMB company (with about 250 global employees) faced the same tough supply chain questions as large retail customers, including maintaining enough inventory to meet customer demand in a timely, efficient way.
California Design Den depended upon a myriad of systems to track its complex forecasting and reordering processes. Team members typically planned inventory manually using desktop spreadsheet software, which could lead to excess inventory. Accurately forecasting demand and supply was essential to the company’s financial success—but it was also a challenge.
A couple years ago, California Design Den partnered with Pluto7, a technology solutions provider that offers a software as a service (SaaS) called Planning In A Box. Leveraging Google Cloud Platform machine learning and artificial intelligence, Planning In A Box intelligently helps predict demand and balances it with supply.
But that was just the beginning. “Along the way, we realized that to compete with larger retailers, make quicker decisions, and move faster, we needed to go further,” says Deepak Mehrotra, Co-founder and Chief Adventurer at California Design Den.
With guidance from Pluto7, California Design Den began migrating its database to Google Cloud Platform. Using Google BigQuery, Google Compute Engine, Google Cloud SQL, and Google Cloud Storage, and experimenting with Google Cloud Vision and Google Cloud AutoML, the company is reducing inventory carryovers by more than 50%, improving the accuracy of demand planning quarter over quarter, and gaining granular insights into how individual SKUs are performing.
“We would need an army of data scientists to make faster decisions on pricing and inventory levels. With Google Cloud Platform machine learning and artificial intelligence, we don’t need that. We can make much faster pricing decisions to optimize profitability and move inventory.”
—Deepak Mehrotra, Co-founder and Chief Adventurer, California Design Den
No need for army of data scientists
“Using Google Cloud Platform machine learning and AI was essential for California Design Den if it was to compete successfully with larger retailers,” Deepak says.
For example, tastes and fashions in bed linens can change quickly and consumer prices fluctuate. With more than 2,500 SKUs, it wasn’t possible for California Design Den’s team to continuously monitor product demand and experiment with competitive pricing in real time.
“We would need an army of data scientists to make faster decisions on pricing and inventory levels,” says Deepak. “With Google Cloud Platform machine learning and artificial intelligence, we don’t need that. We can make much faster pricing decisions to optimize profitability and move inventory.”
By integrating all its data onto Google Cloud Platform, California Design Den’s team gains deeper insights into product sales over time, which in turn helps the company improve demand planning by better determining which styles to manufacture and sell in the future.
“When experienced employees leave, their knowledge leaves with them. By having all data in one place, and with machine learning and AI, California Design Den can go back in its history, look at products made or sold years ago, and analyze product performance.”
—Deepak Mehrotra, Co-founder and Chief Adventurer, California Design Den
Merging visuals with data
Before Google Cloud Platform, team members had to dig through spreadsheets and run scenarios to get a sense of how particular products had sold. The next step was to perform keyword searches across the company’s photo library in the cloud to find each product’s image. From there, a team member would insert the product images into a presentation, along with relevant data points, to provide a report for stakeholders on how particular styles performed.
Today, California Design Den, with the help of Pluto7, is integrating its entire product image library with its database on Google Cloud Platform. Experimenting with Google Cloud Vision and Google Cloud AutoML, California Design Den is moving towards a day when team members can run sales scenarios and get deep background data on individual product performance while viewing images of the relevant products.
Merging product visuals with data will help designers and team members better understand sales patterns over time and in context. In the past, making correlations between things like which sheet colors sold well in California, compared to how the same sheet colors performed on the East Coast, was something that California Design Den employees primarily did in their heads.
“When experienced employees leave, their knowledge goes with them,” says Manjunath Devadas, Founder and CEO at Pluto7. “By having all data in one place, and with machine learning and AI, California Design Den can go back in its history, look at products made or sold years ago, and analyze product performance.”
“We are literally growing the complexity of our business on all levels, including designing, manufacturing, selling, reordering, inventory holding—everything.”
—Deepak Mehrotra, Co-founder and Chief Adventurer, California Design Den
Reimagining supply-demand balancing
Pluto7’s mission statement is to democratize supply demand balancing with machine learning and AI. California Design Den is a case in point, as the combination of Planning In A Box and Google Cloud Platform gives the company greater control over its destiny.
“Big retailers used to tell us what to manufacture and how much they would pay for it,” says Deepak. “That was our primary business, and if we didn’t accept the terms, a competitor would.” Today, in addition to continuing to make products for retailers, California Design Den can design, make, and sell a variety of designs for itself, including custom and limited-edition products, thanks to Google Cloud Platform and Pluto7 software offerings. The payoff is not only in having a more diversified business. California Design Den also receives more favorable profit margins by selling its own products.
“We are literally growing the complexity of our business on all levels, including designing, manufacturing, selling, reordering, inventory holding—everything,” Deepak says. “We can make smaller batches. We can connect directly with consumers. We can identify the missing pieces—what should we produce next, when, and how much? We otherwise couldn’t afford the level of talent it would take to do this.”
Cutting through the noise
Google and Pluto7 software helped California Design Den reduce inventory carryovers by more than 50%. Inventory tracking and distribution, along with insights and visibility into product sales, are faster, more efficient, and accurate. Google Cloud Platform flexible pricing, speed, reliability, security, and scalability enable California Design Den to stay relevant and be more competitive.
In addition to benefiting from Google Cloud Platform, California Design Den relies on G Suite—also part of Google Cloud—to enhance collaboration among its global teams. Previously, the company’s email server would sometimes crash, due to the heavy load of sharing product photos and other data. “Gmail and Google Drive handle the everyday demands on the business effortlessly and reliably,” Deepak says.
“Google machine learning and AI enable us to cut through all the noise from raw data, so we can see what’s important. We can focus on analytics to guide us to success today and in the future.”
—Deepak Mehrotra, Co-founder and Chief Adventurer, California Design Den
The company is exploring additional ways to leverage Google Cloud Platform in the near future. For example, one possibility is to import customer reviews from sites where products are sold into Google BigQuery, and to use that data to perform sentiment analysis via Google Cloud Natural Language. It could provide another valuable data source to help California Design Den’s team decide where to focus future designs.
“Google machine learning and AI enable us to cut through all the noise from raw data, so we can see what’s important,” Deepak says. “We can focus on analytics to guide us to success today and in the future.”
Recommendations for Modelling SAP Data inside BigQuery

8418
Of your peers have already read this article.
4:00 Minutes
The most insightful time you'll spend today!
Over the past few years, many organizations have experienced the benefits of migrating their SAP solutions to Google Cloud. But this migration can do more than reduce IT maintenance costs and make data more secure. By leveraging BigQuery, SAP customers can complement their SAP investments and gain fresh insights by consolidating enterprise data and easily extending it with powerful datasets and machine learning from Google.
BigQuery is a leading cloud data warehouse, fully managed and serverless, and allows for massive scale, supporting petabyte-scale queries at super-fast speeds. It can easily combine SAP data with additional data sources, such as Google Analytics or Salesforce, and its built-in machine learning lets users operationalize machine learning models using standard SQL — all at a comparatively low cost.
If your SAP-powered organization is looking to supercharge its analytics with the strength of BigQuery, read on for considerations and recommendations for modeling with SAP data. These guidelines are based on our real-world implementation experience with customers and can serve as a roadmap to the analytics capabilities your business needs.
Considerations for data replication
Like most technology journeys, this one should start with a business objective. Keeping your intended business value and goals in mind is critical to making the right decisions in the early steps of the design process.
When it comes to replicating the data from an SAP system into BigQuery, there are multiple ways to do it successfully. Decide which method will work best for your organization by answering these questions:
- Does your business need real-time data? Will you need to time travel into past data?
- Which external datasets will you need to join with the replicated data?
- Are the source structures or business logic likely to change? Will you be migrating the SAP source systems any time soon? For instance, will you be moving from SAP ECC to SAP S/4HANA?
You’ll also need to determine whether replication should be done on a table-by-table basis or whether your team can source from pre-built logic. This decision, along with other considerations such as licensing, will influence which replication tool you should use.
Replicating on a table-by-table basis
Replicating tables, especially standard tables in their raw form, allows sources to be reused and ensures more stability of the source structure and functional output. For example, the SAP table for sales order headers (VBAK) is very unlikely to change its structure across different versions of SAP, and the logic that writes to it is also unlikely to change in a way that affects a replicated table.
Something else to consider: Reconciliation between the source system and the landing table in BigQuery is linear when comparing raw tables, which helps avoid issues in consolidation exercises during critical business processes, such as period-end closing. Since replicated tables aren’t aggregated or subject to process-specific data transformation, the same replicated columns can be reused in different BigQuery views. You can, for instance, replicate the MARA table (the material master) once and use it in as many models as needed.
Replicating pre-built logic
If you replicate pre-built models, such as those from SAP extractors or CDS views, you don’t need to build the logic in BigQuery, since you’re using existing logic. Some of these extraction objects have embedded delta mechanisms, which may complement a replication tool that can’t handle deltas. This will save initial development time, but it can also lead to challenges if you create new columns, or if customizations or upgrades change the logic behind the extraction.
It’s also important to note that different extraction processes may transform and load the same source columns multiple times, which creates redundancy in BigQuery and can lead to higher maintenance needs and costs. However, replicating pre-built models may still be a good choice, since doing so can be especially useful for logic that tends to be immutable, such as flattening a hierarchy, or logic that is highly complex.
How you approach replication will also depend on your long-term plans and other key factors — for example, the availability (and curiosity) of your developers, and the time or effort they can put into applying their SQL knowledge to a new data warehouse.
With either replication approach, bear in mind when designing your replication process that BigQuery is meant to be an append-always database — so post-processing of data and changes will be required in both cases.
Processing data changes
The replication tool you choose will also determine how data changes are captured (known as CDC – change data capture). If the replication tool allows for it (for example as SAP SLT does) the same patterns described in the CDC with BigQuery documentation also apply to SAP data.
Because some data, like transactions, are known to be less static than others (e.g., master data), you need to decide what should be scanned in real time, what will require immediate consistency, and what can be processed in batches to manage costs. This decision will be based on the reporting needs from the business.
Consider the SAP table BUT000, containing our example master data for business partners, where we have replicated changes from an SAP ERP system:
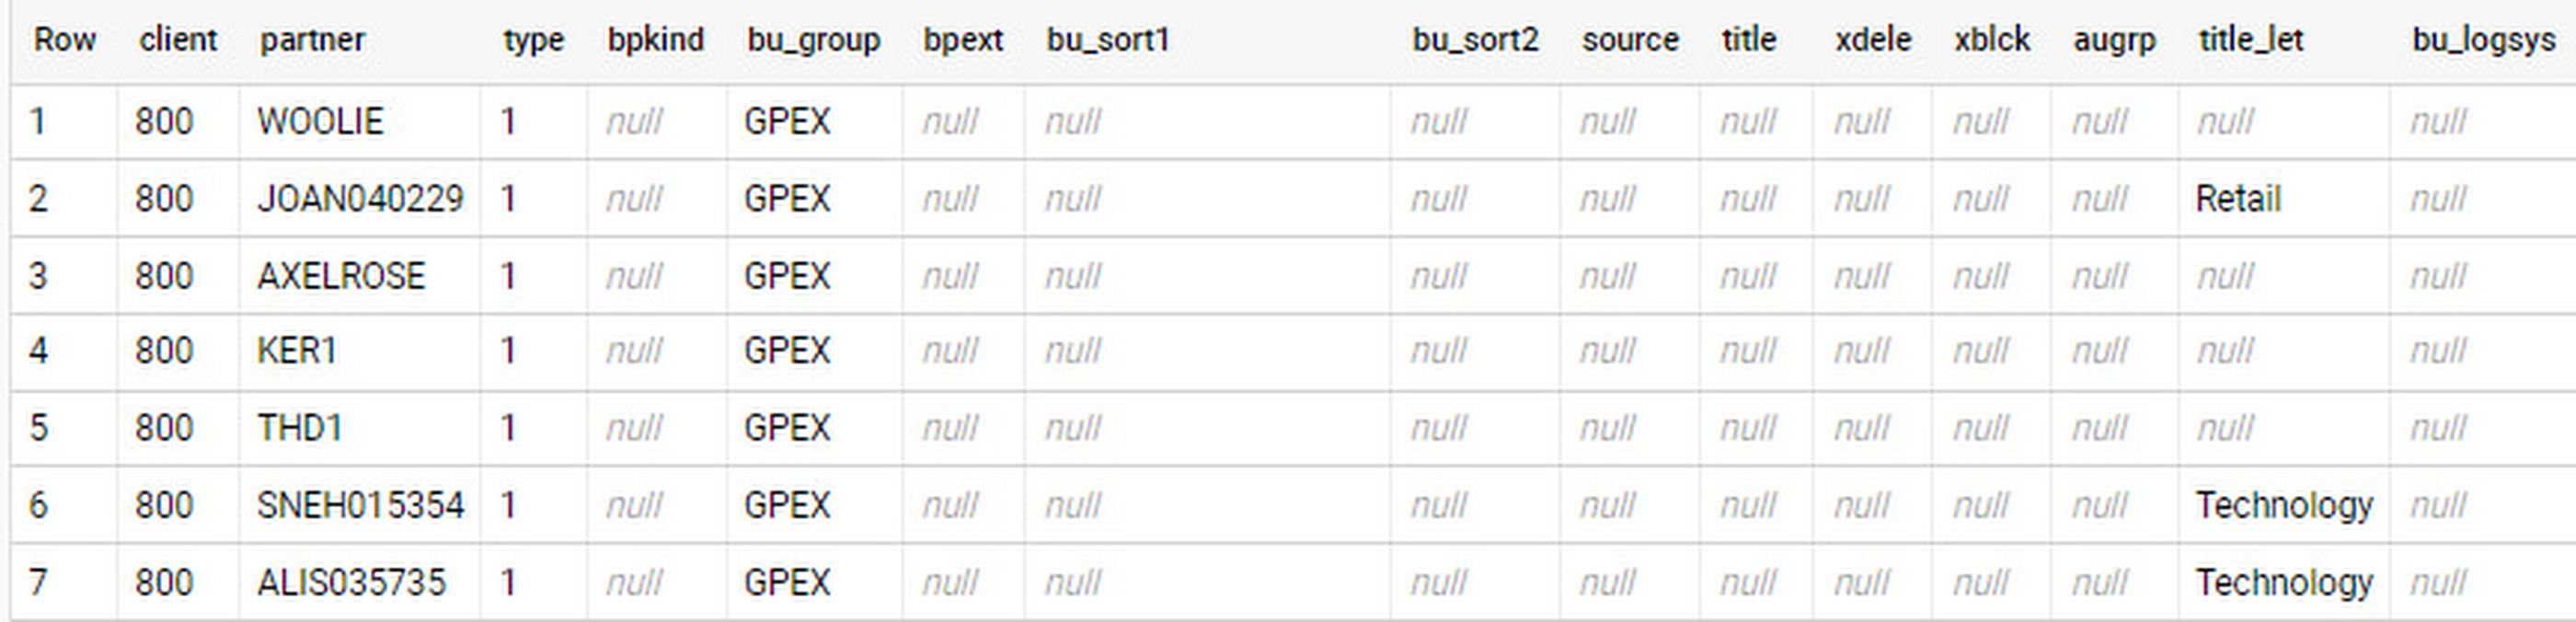
In an append-always replication in BigQuery, all updates are received as new records. For example, deleting a record in the source will be represented as a new record in BigQuery with a deletion flag. This applies to whether the records are coming from raw tables like BUT000 itself or pre-aggregated data, as from a BW extractor or a CDS view.
Let’s take a closer look at data coming particularly from the partners “LUCIA” and “RIZ”. The operation flag tells us whether the new record in BigQuery is an insert (I), update (U) or deletion (D), while the timestamps help us identify the latest version of our business partner.
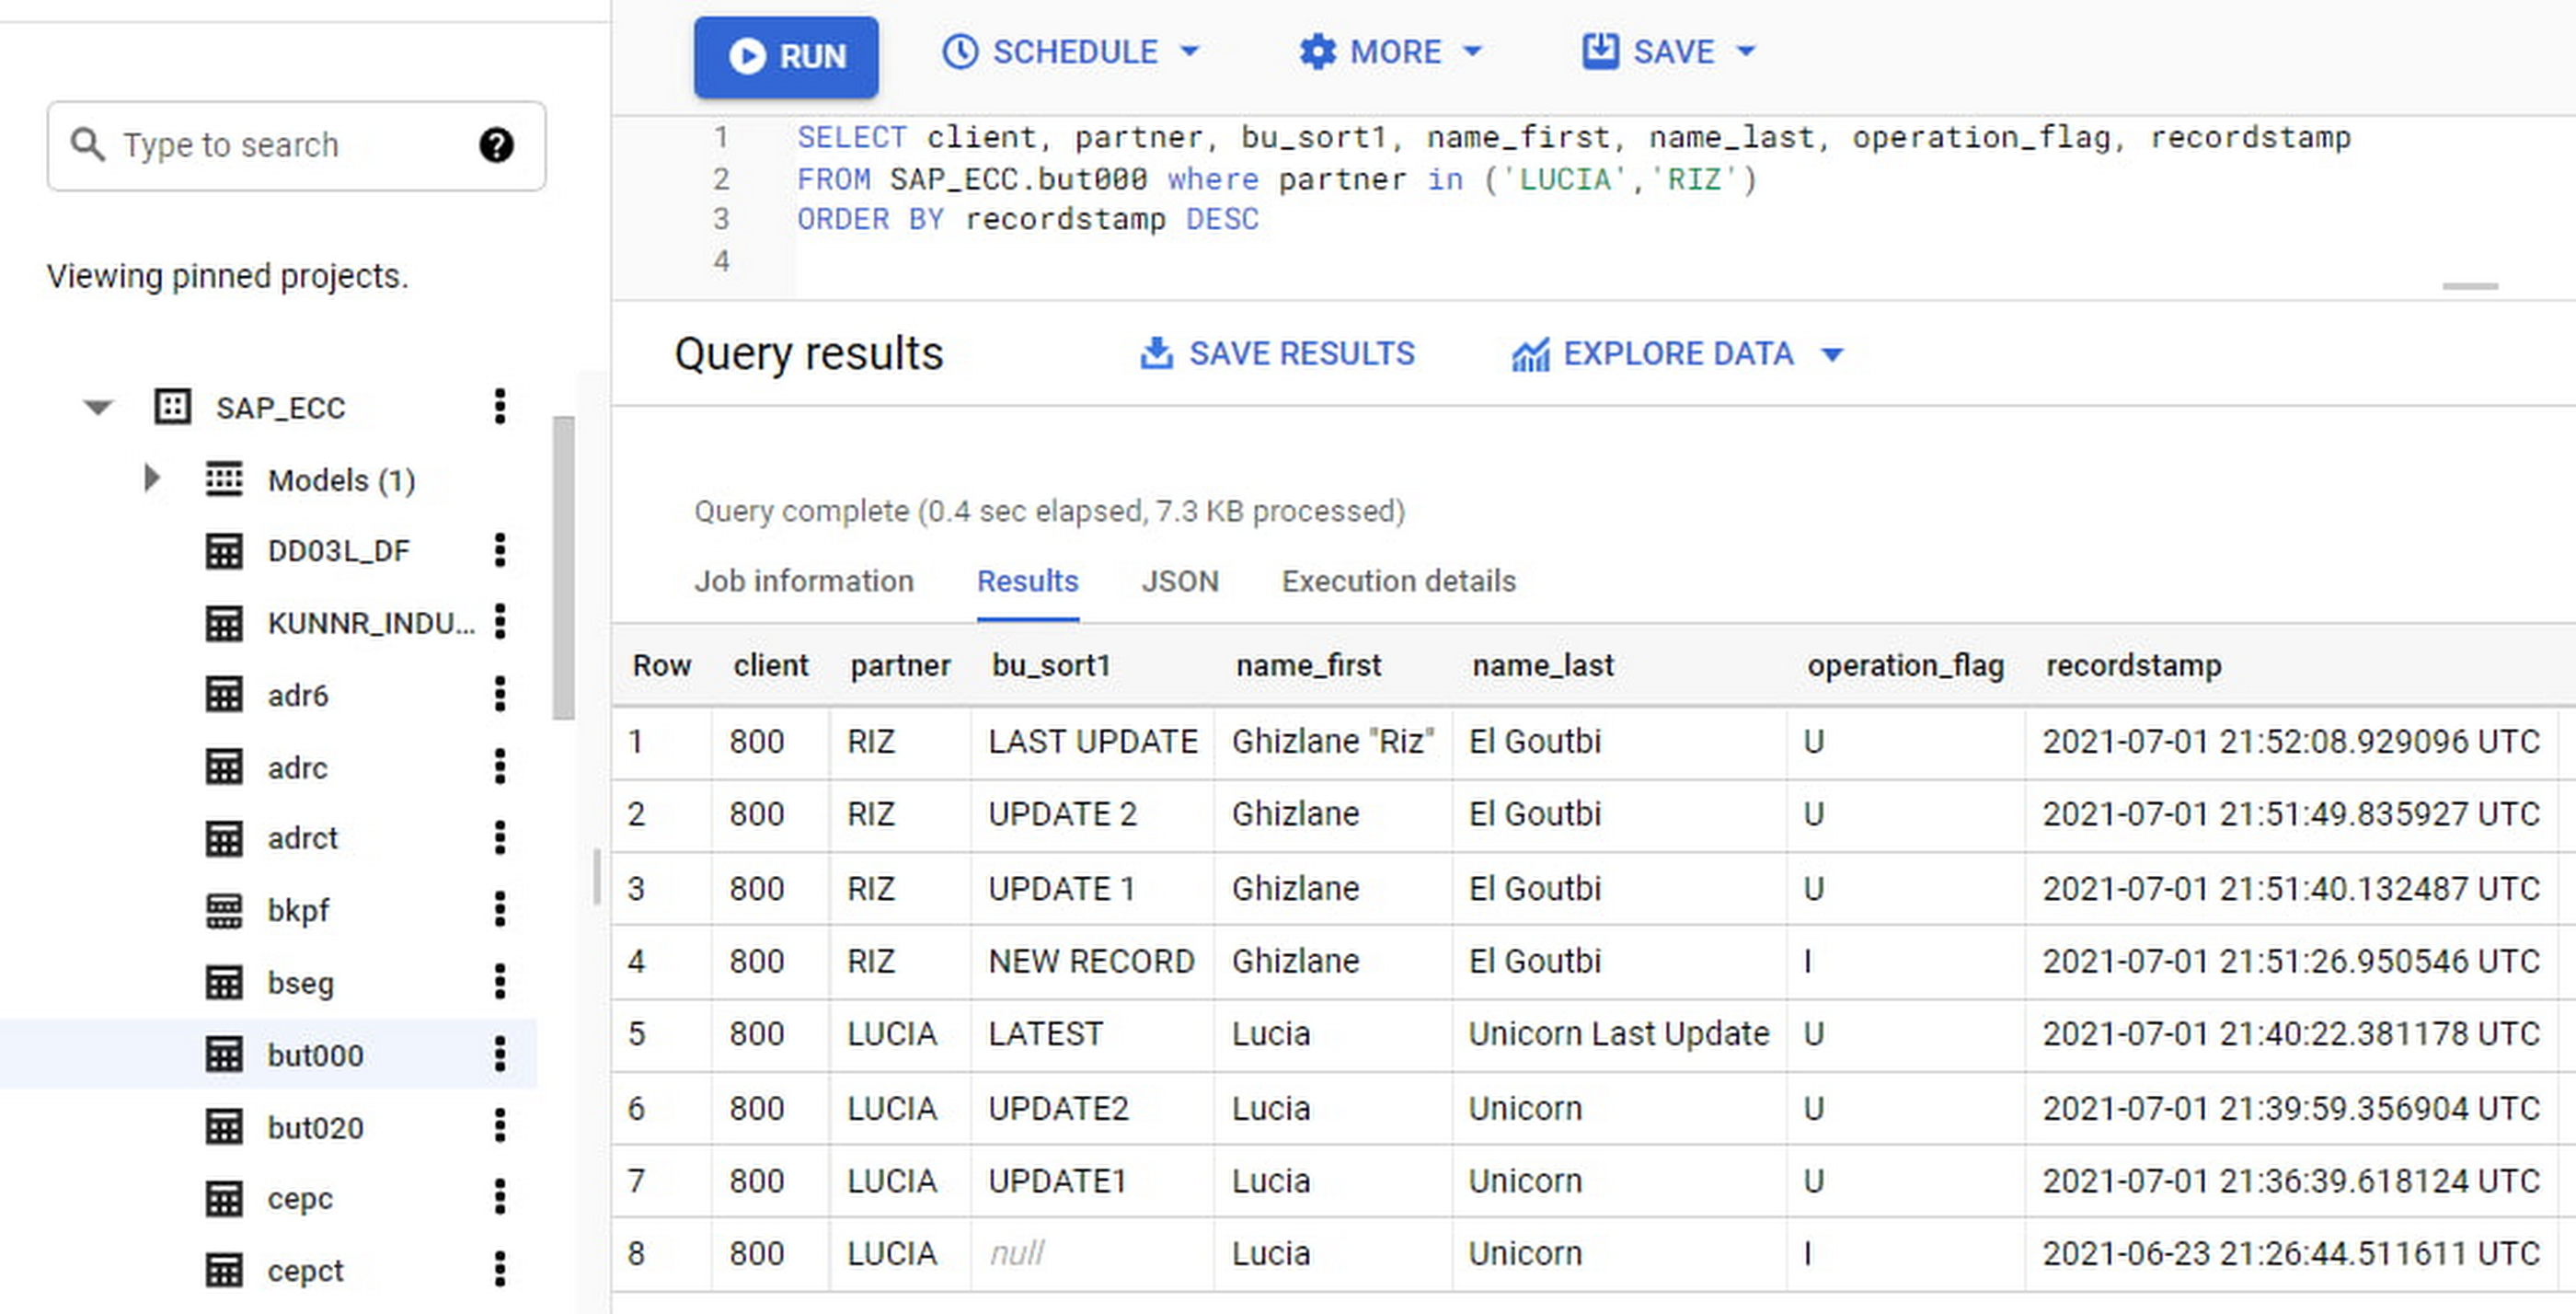
If we want to find the latest updated record for the partners LUCIA and RIZ, this is what the query would look like:
SELECT partner,ARRAY_AGG(i1 ORDER BY i1.recordstamp DESC LIMIT 1) AS rowFROM SAP_ECC.but000 i1WHERE partner in ('LUCIA','RIZ')GROUP BY partner
With the following result:
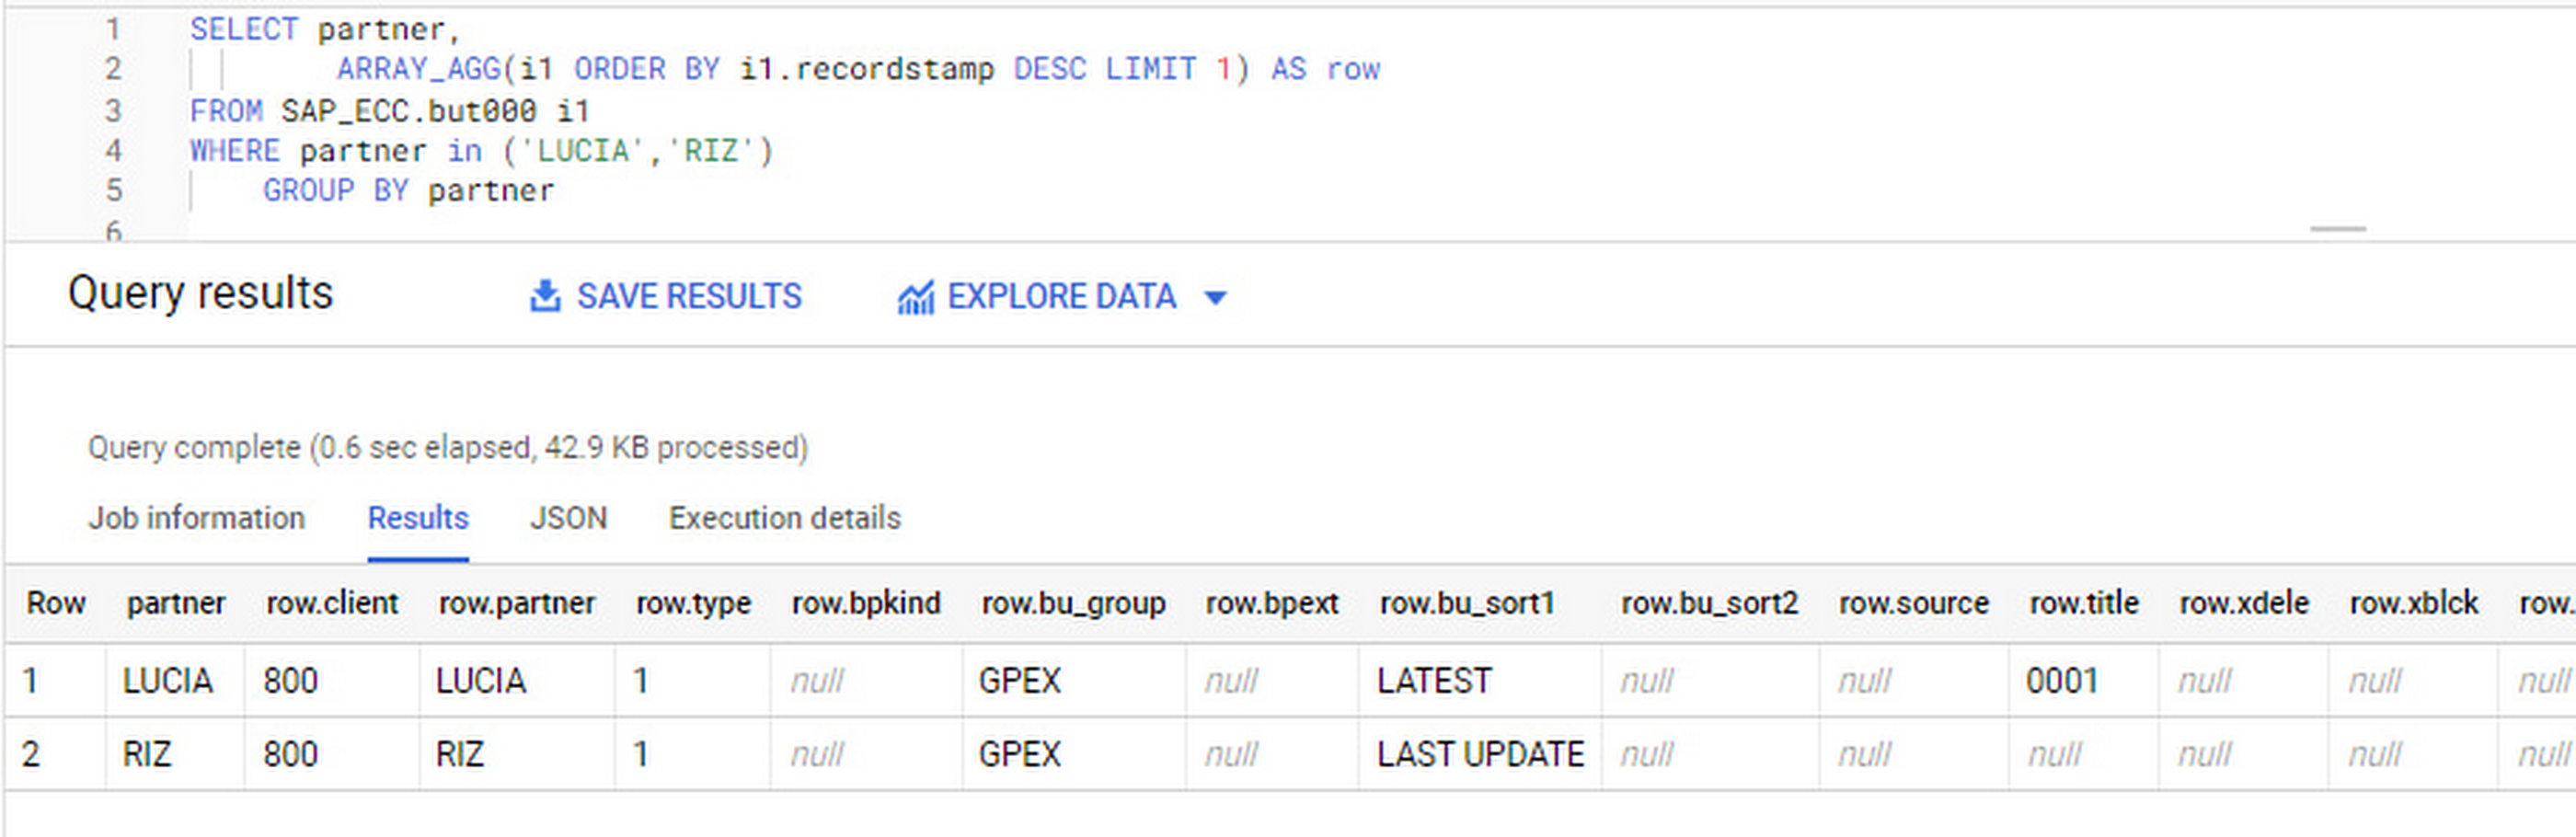
After identifying stale records for “LUCIA” and “RIZ” business partners, we can proceed to deleting all stale records for “LUCIA” if we do not want to retain the history. In this example, we are using a different table to which the same replication has been done, for the purpose of comparison and to check that all stale records have been deleted for the selection made and that we only kept last updated records. For example:
DELETE SAP_HANA.but000 i1WHEREi1.recordstamp < TIMESTAMP_SUB(CURRENT_TIMESTAMP(), INTERVAL 3 HOUR) ANDi1.recordstamp < (SELECT MAX(recordstamp) FROM SAP_HANA.but000 i2WHEREi1.partner = i2.partnerand partner="LUCIA")
You can also use the following query to retrieve stale records for “LUCIA” partner before moving forward with deletion
SELECT partner, operation_flag, recordstamp FROM SAP_HANA.but000 i1WHEREi1.recordstamp < TIMESTAMP_SUB(CURRENT_TIMESTAMP(), INTERVAL 3 HOUR)ANDi1.recordstamp < (SELECT MAX(recordstamp) FROM SAP_HANA.but000 i2WHEREi1.partner = i2.partnerand partner="LUCIA")
Which produces all of the records, except the latest update:

Partitioning and clustering
To limit the number of records scanned in a query, save on cost and achieve the best performance possible, you’ll need to take two important steps: determine partitions and create clusters.
Partitioning
A partitioned table is one that’s divided into segments, called partitions, which make it easier to manage and query your data. Dividing a large table into smaller partitions improves query performance and controls costs because it reduces the number of bytes read by a query.
You can partition BigQuery tables by:
- Time-unit column: Tables are partitioned based on a “timestamp,” “date,” or “datetime” column in the table.
- Ingestion time: Tables are partitioned based on the timestamp recorded when BigQuery ingested the data.
- Integer range: Tables are partitioned based on an integer column.
Partitions are enabled when the table is created, as in the example below. A great tip is to always include the partition filter as shown on the left-hand side of the query.

Clustering
Clustering can be created on top of partitioned tables by applying the fields that are likely to be used for filtering. When you create a clustered table in BigQuery, the table data is automatically organized based on the contents of one or more of the columns in the table’s schema. The columns you specify are then used to colocate related data.
Clustering can improve the performance of certain query types — for example, queries that use filter clauses or that aggregate data. It makes a lot of sense to use them for large tables such as ACDOCA, the table for accounting documents in SAP S/4HANA. In this case, the timestamp could be used for partitioning, and common filtering fields such as the ledger, company code, and fiscal year could be used to define the clusters.
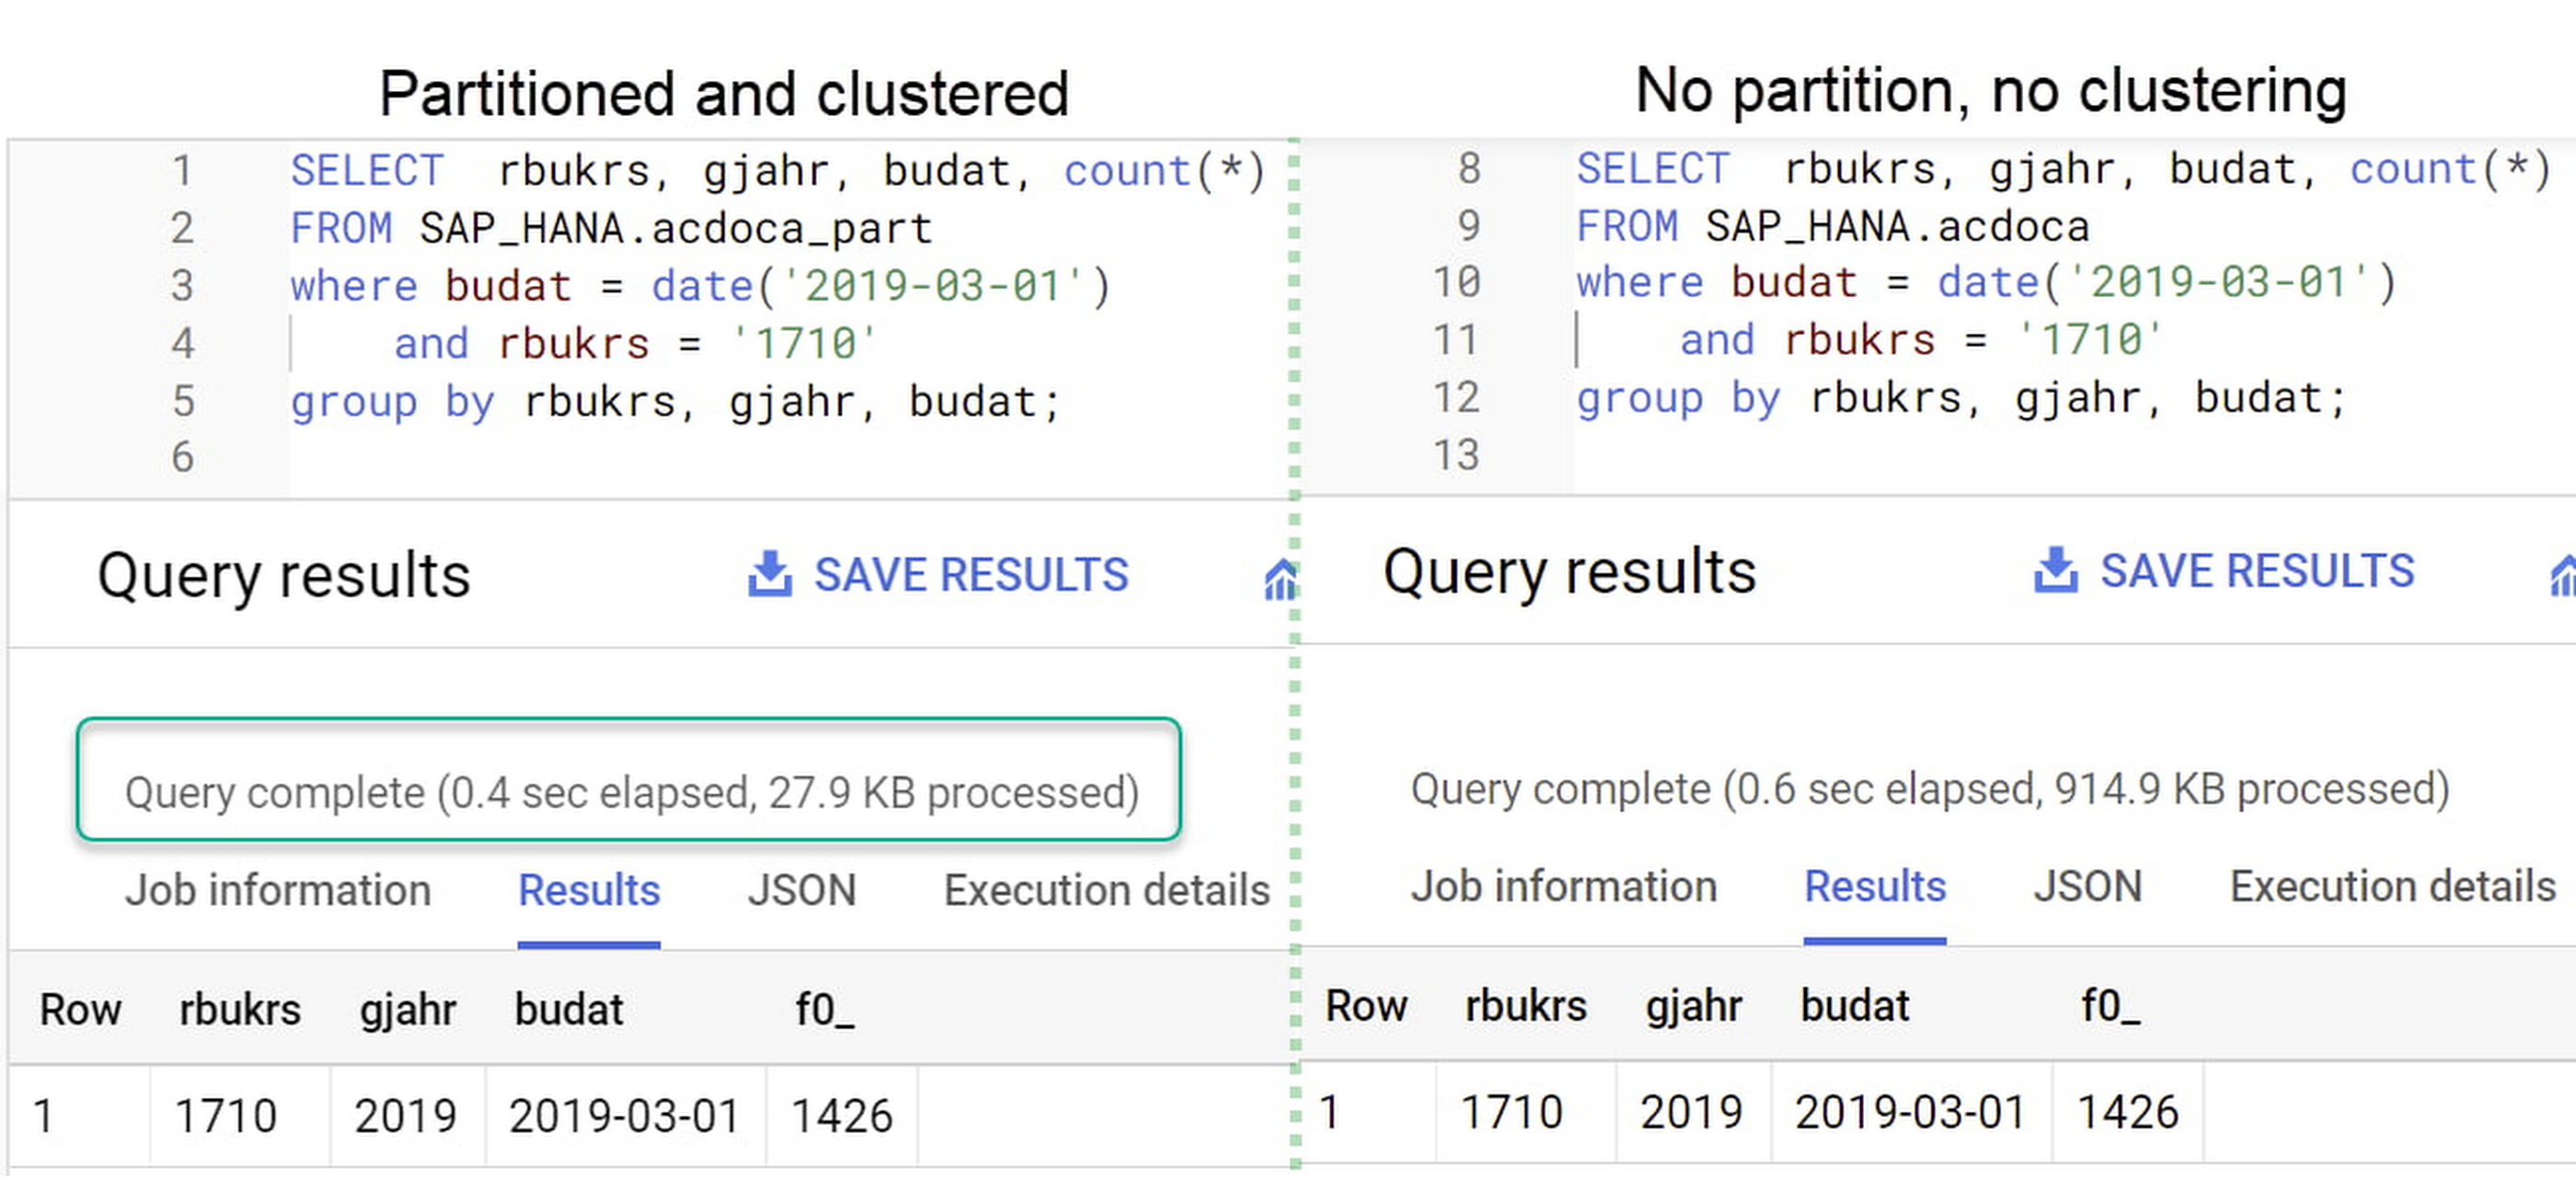
A great feature is that BigQuery will also periodically recluster the data automatically.
Materialized views
In BigQuery, materialized views are precomputed views that periodically cache the results of a query for better performance and efficiency. BigQuery uses precomputed results from materialized views and, whenever possible, reads only the delta changes from the base table to compute up-to-date results quickly. Materialized views can be queried directly or can be used by the BigQuery optimizer to process queries to the base table.
Queries that use materialized views are generally completed faster and consume fewer resources than queries that retrieve the same data only from the base table. If workload performance is an issue, materialized views can significantly improve the performance of workloads that have common and repeated queries. While materialized views currently only support single tables, they are very useful common and frequent aggregations like stock levels or order fulfillment.
Further tips on performance optimization while creating select statements can be found in the documentation for optimizing query computation.
Deployment pipeline and security
For most of the work you’ll do in BigQuery, you’ll normally have at least two delivery pipelines running — one for the actual objects in BigQuery and the other to keep the data staging, transforming, and updated as intended within the change-data-capture flows. Note that you can use most existing tools for your Continuous Integration / Continuous Deployment (CI/CD) pipeline — one of the benefits of using an open system like BigQuery. But, if your organization is new to CI/CD pipelines, this is a great opportunity to gradually gain experience. A good place to start is to read our guide for setting up a CI/CD pipeline for your data-processing workflow.
When it comes to access and security, most end-users will only have access to the final version of the BigQuery views. While row and column-level security can be applied, as in the SAP source system, separation of concerns can be taken to the next level by splitting your data across different Google Cloud projects and BigQuery datasets. While it’s easy to replicate data and structures across your datasets, it’s a good idea to define the requirements and naming conventions early in the design process so you set it up properly from the start.
Start driving faster and more insightful analytics
The best piece of advice we can give you is this: Try it yourself. Anyone with SQL knowledge can get started using the free BigQuery tier. New customers get $300 in free credits to spend on Google Cloud during the first 90 days. All customers get 10 GB storage and up to 1 TB queries/month, completely free of charge. In addition to discovering the massive processing capabilities, embedded machine learning, multiple integration tools, and cost benefits, you’ll soon discover how BigQuery can simplify your analytics tasks.
If you need additional assistance, our Google Cloud Professional Services Organization (PSO) and Customer Engineers will be happy to help show you the best path forward for your organization. For anything else, contact us at cloud.google.com/contact.
Google Cloud Migration Speeds Up The New York Times’ Journey to New Normal

5794
Of your peers have already read this article.
2:30 Minutes
The most insightful time you'll spend today!
Like virtually every business across the globe, The New York Times had to quickly adapt to the challenges of the coronavirus pandemic last year. Fortunately, our data system with Google Cloud positioned us to perform quickly and efficiently in the new normal.
How we use data
We have an end-to-end type of data platform; on one side we work very closely with our product teams to collect the right level of data that they’re interested in, such as which articles people are reading, and how long they’re staying onsite. We frequently measure our audience to understand our user segments, and how they come onsite or use our apps. We then provide that data to analysts for end-to-end analytics.
On the other side, the newsroom is also focused on audience, and we build tools to help them understand how Google Search or different social promotions play a role in a person’s decision to read The New York Times, and also to get a better sense of their behavior on our pages. With this data, the newsroom can make decisions about information that should be displayed on our homepage or in push notifications.
Ultimately, we’re interested in behavioral analytics—how people engage with our site and our apps. We want to understand different behavioral patterns, and which factors or features will encourage users to register and subscribe with us.
We also use data to create or curate preferences around personalization, to ensure we’re delivering to our users fresh content, or content that they may not have normally read. Likewise, our data also gets used in our targeting system, so that we can send out the right messaging about our various subscription packages to the right users.
Choosing to migrate to Google Cloud
When I came to The New York Times over five years ago, our data architecture was not working for us. Our infrastructure was gathering data that proved harder for analysts to crunch on a daily basis. We were also hitting hang ups with how that data was streaming into our system and environment. Back then we’d run a query and then go grab some coffee, hoping that the query would finish or give us the right data by the time we came back to our desks. Sometimes it would, sometimes it wouldn’t.
We realized that Hadoop was definitely not going to be the on-premises solution for us, and that’s when we started talking with the Google Cloud team. We began our digital transformation with a migration to BigQuery, their fully managed, serverless database warehouse. We were under a pretty aggressive migration timeline, focusing first on moving over analytics. We made sure our analysts got a top-of-the-line system that treated them the way that they themselves would want to treat the data.
One significant prominent requirement in our data architecture choice was to enable analysts to be able to work as quickly as they needed to provide high-quality deliverables for their business partners. For our analysts, the transition to BigQuery was night and day. I still remember when my manager ran his very first query on BigQuery and was ready to go grab his coffee, but the query finished by the time he got up from his chair. Our analysts talk about that to this day.
While we were doing the BigQuery transition, we did have concerns about our other systems not scaling correctly. Two years ago, we weren’t sure we’d be able to scale up to the audience we expected on that election day. We were able to band-aid a solution back then, but we knew we only had two more years to figure out a real, dependable solution.
During that time, we moved our streaming pipeline over to Google Cloud, primarily using App Engine, which has been a flexible environment that enabled quick scaling changes and requirements as needed. Dataflow and Pub/Sub also played significant roles in managing the data. In Q4 of 2020 we had our most significant traffic ever recorded, at 273 million global readers, and four straight days of the highest traffic we’ve had compared to other election weeks. We were proud to see that there was no data loss.
A couple of years ago, on our legacy system, I was up until three in the morning one night trying to keep data running for their needs. This year, for election night, I relaxed and ate a pint of ice cream because I was able to more easily manage our data environment, allowing us to set and meet higher expectations for data ingestion, analysis and insight among our partners in the newsroom.
How COVID-19 changed our 2020 roadmap
The coronavirus pandemic definitely wasn’t on my team’s roadmap for 2020, and it’s important to mention here that The New York Times is not fundamentally a data company. Our job is to get the news out to our users every single day in paper, on apps, and onsite. Our newsroom didn’t expect the need to build out a giant coronavirus database that would enrich the news they share every day.
Our newsroom moves quickly, and our engineers have built one of the most comprehensive datasets on COVID-19 in the U.S. With Google, The New York Times decided to make our data publicly available on BigQuery Google’s COVID-19 public dataset. Check out this webinar for more details on our evolution architecture:https://www.youtube.com/embed/mtNlrFpschU?enablejsapi=1&
Flexible approach
We have many different teams that work within Google Cloud, and they’ve been able to pick from the range of available services and tailor project requirements keeping those tools available in mind.
One challenge we think about with the data platform at The New York Times is determining the priorities of what we build. Our ability to engage with product teams at Google though the Data Analytics Customer Council allows us to see into the BigQuery roadmap, or the data analytics roadmap, and plays a significant role in determining where we focus our own development. For example, we’ve built tools like our Data Reporting API, which reads data directly from BigQuery, in order to take advantage of tools like BigQuery BI Engine. This approach encourages our analysts to be better managers of their domains around dimensions and metrics, but not have to focus on building caching mechanisms of their data. Getting that kind of clarity helps us plan how to build The New York Times in the new normal and beyond.
If you are interested to learn more about the data teams at the New York Times, take a look at our open tech roles here and you’ll find many interesting articles at NYT data blog.
What You Can Learn from ‘Up or Out’ Framework for Cloud Adoption
3226
Of your peers have already read this article.
1:30 Minutes
The most insightful time you'll spend today!
In times of significant disruption, organizations are faced with three choices: Retrench within legacy solutions, pause and do nothing while waiting for more data or different circumstances, or press ahead, potentially even accelerating to realize the desired outcome. In such an environment, it is critical to ensure you’re delivering the greatest possible impact to the business.
In Google Cloud’s Office of the CTO, or OCTO, we have the privilege of co-innovating with customers to explore what’s possible and how we can re-imagine and solve their most strategic challenges. These collaborative innovation engagements are often core to critical transformational projects, which often include the rehosting, evolution, and at times re-architecture of existing business solutions.
We are happy to offer this brand new white paper, where we have distilled the conversations we’ve had with CIOs, CTOs, and their technical staff into several frameworks that can help cut through the hype and the technical complexity, to help devise the strategy that empowers both the business and IT. We called one such framework “up or out.” (And we don’t mean some consulting firm’s hard-nosed career philosophy.)
One model that we found can help enterprises chart their cloud adoption journey delineates cloud migration along two axes—up and out, and we’ll cover this in much greater detail in the white paper itself.
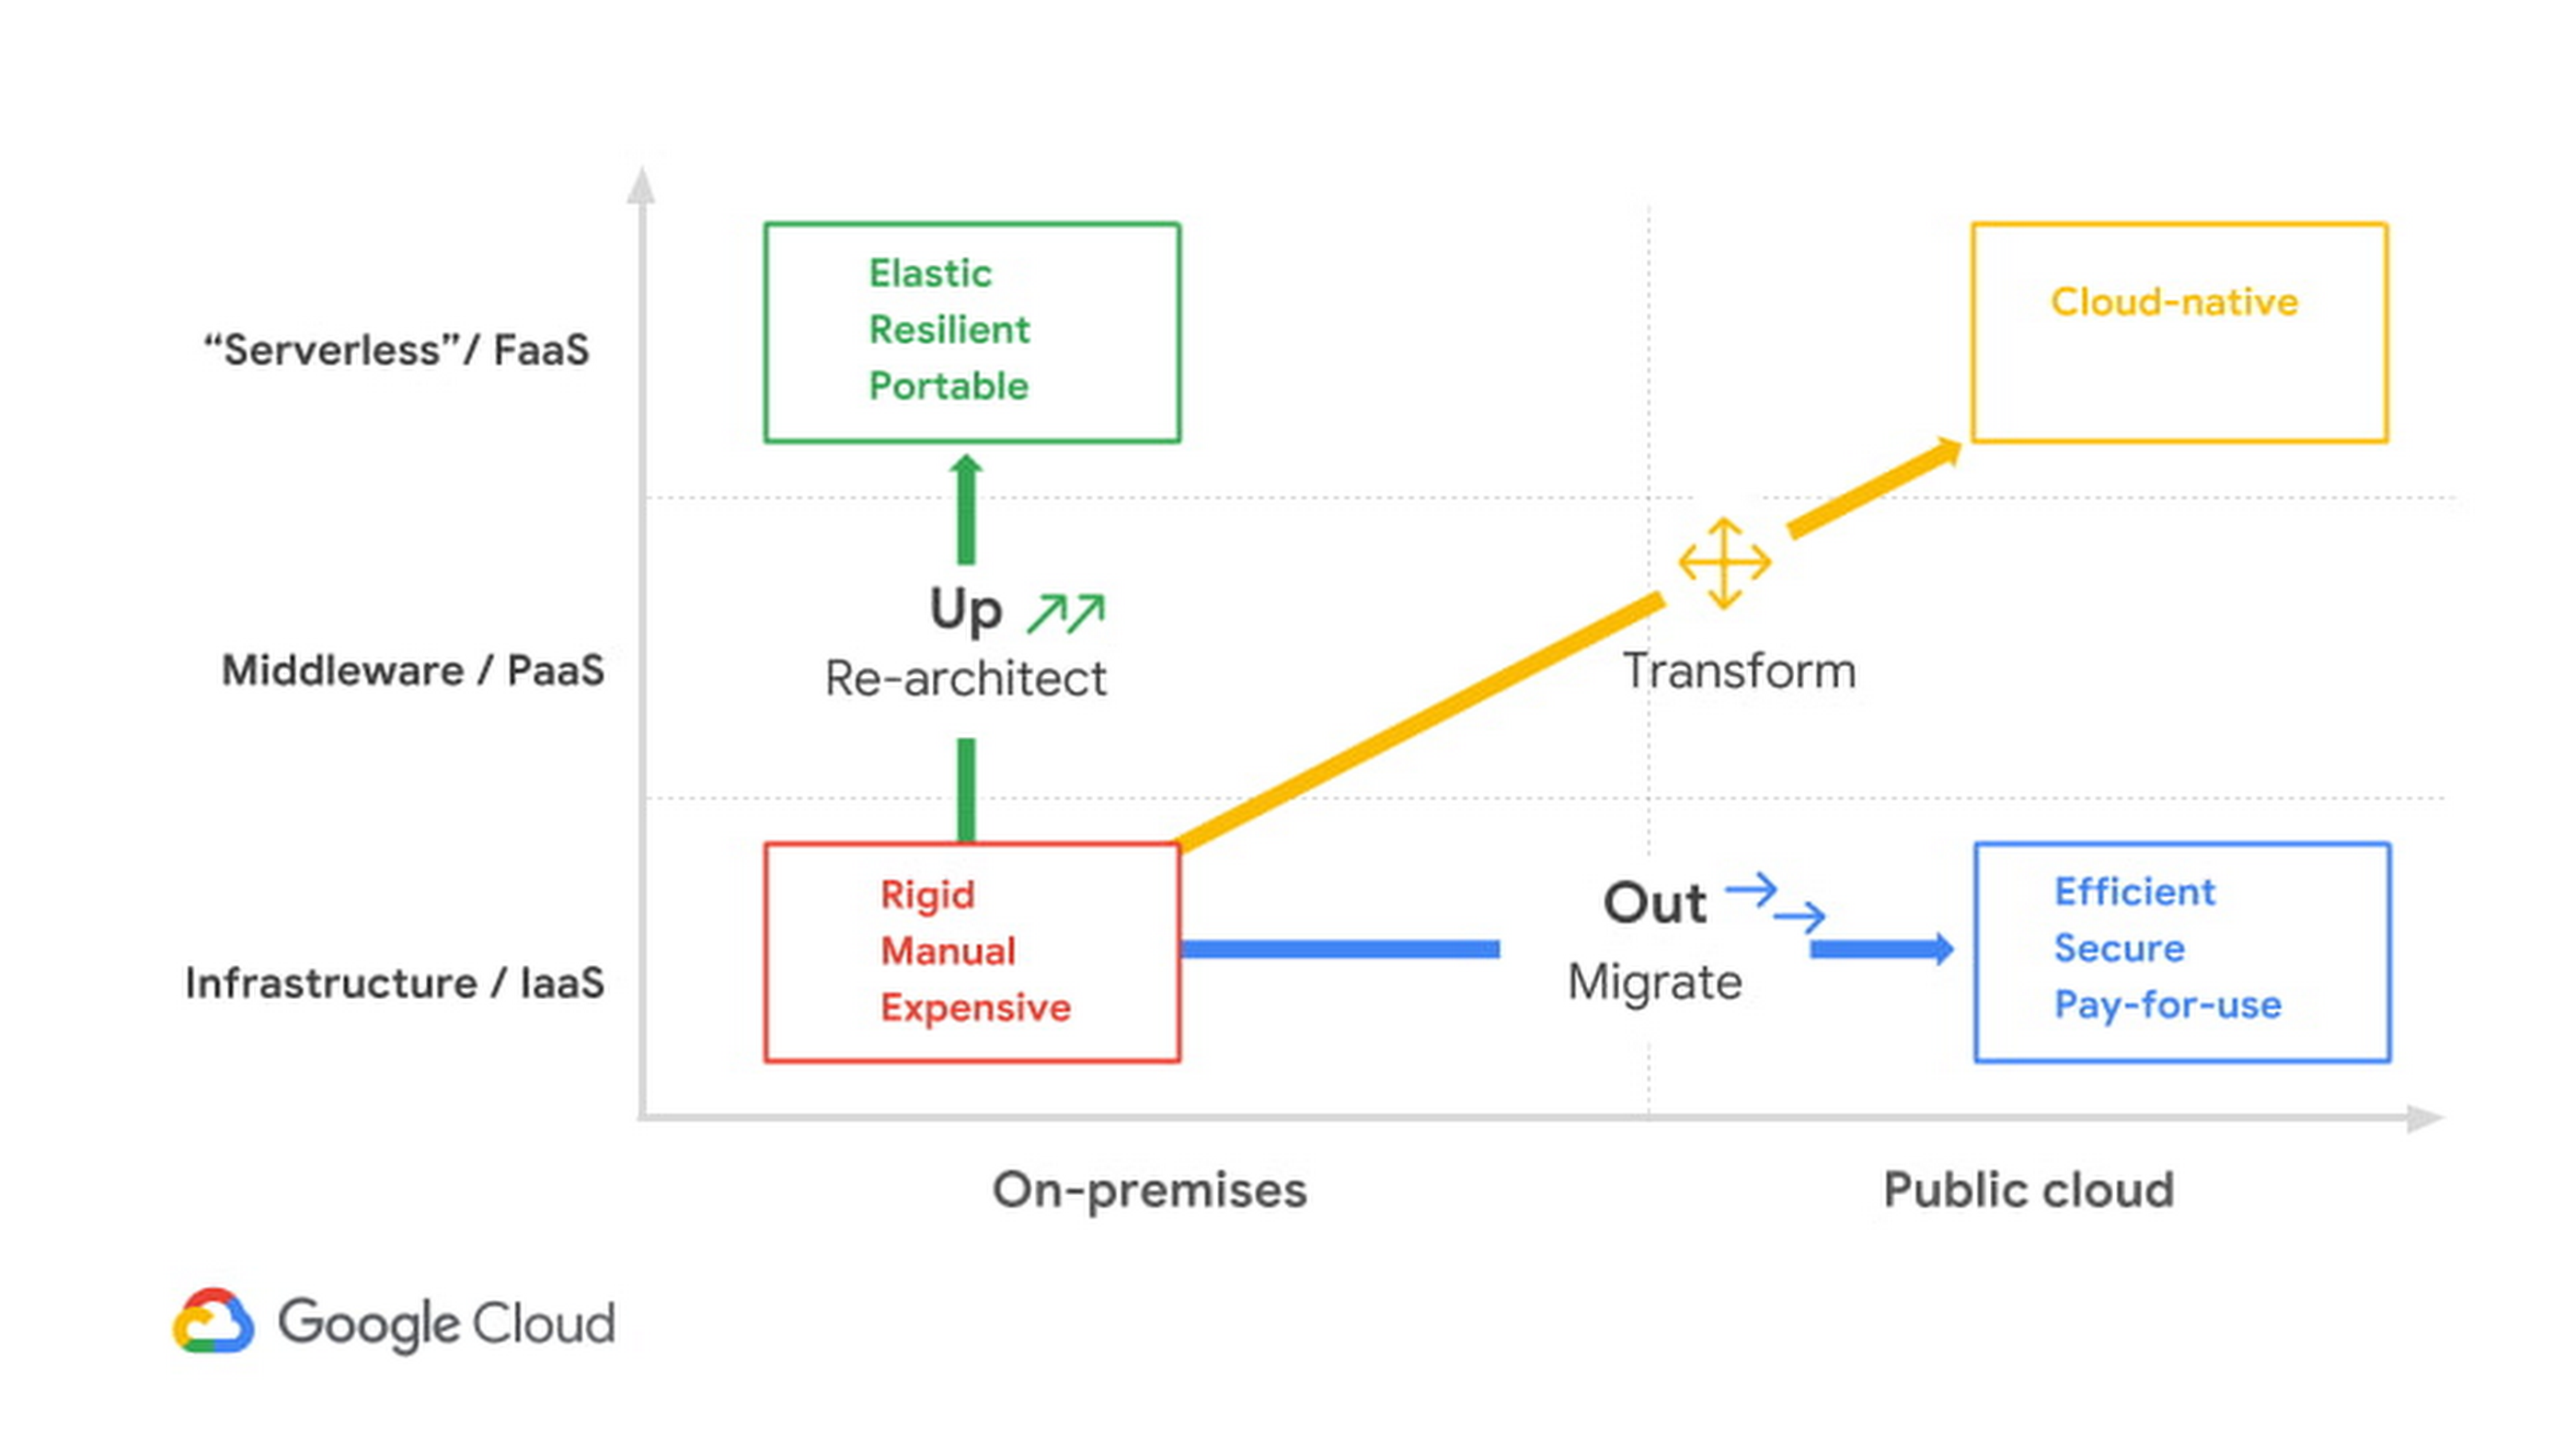
As you can see, there isn’t a single path to the cloud—not for individual enterprises and not even for individual applications. The up or out framework can help an IT organization and its leadership characterize how they can best benefit from migrating their services or workloads. The framework acts as a general pattern that highlights the continuum of approaches to explore, and you can learn all about it by downloading this detailed white paper.
Or, if you’re really ready to jump start your migration today, you can take advantage of our current offer by signing up for a free discovery and assessment.
End Security Risks with the Unattended Projects Recommender Feature

6116
Of your peers have already read this article.
3:00 Minutes
The most insightful time you'll spend today!
In fast-moving organizations, it’s not uncommon for cloud resources, including entire projects, to occasionally be forgotten about. Not only such unattended resources can be difficult to identify, but they also tend to create a lot of headaches for product teams down the road, including unnecessary waste and security risks.
To help you prune your idle cloud resources, we’re excited to introduce Unattended Project Recommender. It’s a new feature of Active Assist that provides you with a one-stop shop for discovering, reclaiming, and shutting down unattended projects. With actionable and automatic recommendations, you no longer have to worry about wasting money or mitigating security risks presented by your idle resources. Unattended Project Recommender uses machine learning to identify, with a high degree of confidence, projects that are likely abandoned based on API and networking activity, billing, usage of cloud services, and other signals. This feature is available via the Recommender API today, making it easy for you to integrate with your company’s existing workflow management and communication tools, or export results to a BigQuery table for custom analysis.
Thousands of projects can be unattended in large organizations, presenting major security risks
Your cloud projects can go abandoned or unattended for a number of reasons — ranging from a test environment that’s no longer needed, to project cancellation, to project owner switching jobs, and more. Not only can such projects contribute to your cloud bill (waste) but they may contain security issues such as open firewalls or privileged service account keys that attackers can exploit to get a hold of your cloud resources for cryptocurrency mining or, worse, compromise your company’s sensitive data. These security risks tend to grow over time because the latest best practices and patches are usually not applied to unattended projects.
We experience this issue here at Google, too… In fact, it has been on Google’s internal security team’s radar for some time now, so we joined forces and looked into this problem together, starting with our very own “google.com” organization cloud projects. We quickly found some projects that were unattended, but remediating this issue was easier said than done due to challenges in several areas:
- Detection: With lots of signals available to you via sources like Cloud Monitoring, what are the right ones you should look at (e.g. API, networking, user activity)? How can you tell the difference between an unattended project and a project that has a low level of activity by design (e.g. a “shell” project that holds an auth token)?
- Remediation: Once you have identified a project that seems abandoned, how do you go about ensuring that it’s indeed an unattended project? How do you reduce the risk of deleting something that might be essential to a production workload, causing irreversible data loss? How do you solve this at the scale of your entire organization, beyond a one-time cleanup?
Over the course of 2021 we built and tested a Google-internal prototype first, cleaning up many of our internal unattended projects, and then worked with a number of Google Cloud customers to build and tune this feature based on real-life data (thank you to all of our early adopters for working with us and your generous feedback that helped us shape this feature!) It was not uncommon for us to come across organizations with thousands of unattended projects, and we’re very excited to bring Unattended Project Recommender to all customers, in public preview.
Discovering and acting on unattended project recommendations
Unattended Project Recommender analyzes usage activity across all projects under your organization, including the following data:
- API activity (e.g. service accounts with authentication activity, API calls consumed)
- Networking activity (ingress and egress)
- Billing activity (e.g. services with billable usage)
- User activity (e.g. active project owners)
- Cloud services usage (e.g. number of active VMs, BigQuery jobs, storage requests)
Based on these signals, it can generate recommendations to clean up projects that have low usage activity (where “low usage” is defined using a machine learning model that ranks projects in your organization by level of usage), or recommendations to reclaim projects that have high usage activity but no active project owners. Here’s what an example post-processed summary list of recommendations can look like for the “foobar” organization that has 3 projects:
Project ID: demo-project-307815Recommendation: CLEANUP_PROJECTProject ID: new-projectRecommendation: N/AProject ID: bobs-playground-projectRecommendation: RECLAIM_PROJECT
In addition to the recommendations, you can also examine the underlying project activity insights that the recommendations are based upon. The insights provide additional information that can be useful for integration with your organization’s existing workflows and automation (e.g. send an auto-generated email or chat message to project owners based on the list provided by the owners field). Here’s an example insight payload:
content:activeAppengineInstanceDailyCount: 0activeCloudsqlInstanceDailyCount: 0activeGceInstanceDailyCount: 3activeServiceAccountDailyCount: 1apiClientDailyCount: 18922 // Daily average API calls producedbigqueryInflightJobDailyCount: 0bigqueryInflightQueryDailyCount: 0bigqueryStorageDailyBytes: 0bigqueryTableDailyCount: 0consumedApiDailyCount: 0 // Daily average API calls consumeddatastoreApiDailyCount: 0gcsObjectDailyCount: 11gcsRequestDailyCount: 0gcsStorageDailyBytes: 2663548hasActiveOauthTokens: false // OAuth tokens used in the last 180 dayshasBillingAccount: truenumActiveUserOwners: 1owners: // List of project owners- activeOnProject: falsemember: user:user1@example.com- activeOnProject: truemember: user:user2@example.comserviceWithBillableUsage:– Cloud Storage- Compute EnginevpcEgressDailyBytes: 264456938 // Daily average VPC egress bytesvpcIngressDailyBytes: 392435047 // Daily average VPC ingress bytesusagePercentile: 20 // Level of usage relative to other projects
GCP projects are used in many different ways and for many different purposes. In case you get a recommendation to delete a project that’s being used in a way that’s out of the scope for this feature, you can dismiss the recommendation and it will stop showing up for the given project.
Restoring deleted projects
When you choose to shut down a project using the projects.delete() method, it gets marked for deletion. After a project is marked for deletion, it becomes unusable, all resources within that project are shut down, and a 30-day wait period for the project and all of its data to get fully deleted begins.
In case a useful project is accidentally shut down, you have the option to restore the project within that 30-day wait period. Since restoring allows you to recover most but not necessarily all of your project data and resources, we recommend carefully examining the utilization insights associated with a project and considering any additional utilization signals that may not be captured by the Unattended Project Recommender before taking the cleanup action.
Early customer success stories
A number of enterprise customers are already using Unattended Project Recommender to keep their organizations clean of unattended projects and resources.
Decathlon, a French sporting goods retailer, is excited for the insight Unattended Project Recommender will bring to their environment, and are already deploying it as a part of their latest cloud security initiatives.
“After a thorough test of this feature and the validation of our CISO, we ended up deleting our first 775 projects, and no one complained! A great help to improve our security. The next step for us will be to operationalize it at scale, and implement a company wide policy for unattended resource management.” —Adeline Villette, Cloud Security Officer
For Veolia, one of the world’s largest water, waste and energy management companies, not only does this feature reduce security risks and waste, but also helps drive cultural shift and alignment with its ecological transformation strategy.
“This feature allows us to reduce our costs and security debt on assets that are no longer in use, and is also fully in line with Veolia’s philosophy of limiting its carbon footprint. After having tested Unattended Project Recommender on more than 3,000 projects throughout our organization, we are looking to bring it as proactive alerts to our project owners at scale.”—Thomas Meriadec, Product Manager
Box, a secure cloud content management provider, views it as a foundation for building a repeatable process to remediate unused resources.
“Unattended Project Recommender is a great fit for us. It gives us a unified view of project usage across our entire organization and enables us to address security risks of legacy projects in a systematic and organized manner, ensuring an even safer environment.” —Matt Bowes, Staff Security Engineer
Getting started with the Unattended Project Recommender
To help you get started, we’ve prepared a Cloud Shell tutorial (source code) that you can use to find unattended project recommendations within your own Projects/Folders/Organization. Click this button to clone the tutorial from GitHub and run in your Cloud Shell environment:

As you can see, listing recommendations for your projects only takes a few clicks with the tutorial (special thanks to Lanre Ogunmola, Security & Compliance Specialist, for making this look so easy)! For additional detail on using the gcloud CLI or API to discover unattended project recommendations, please refer to the documentation page.
You can also automatically export all recommendations from your Organization to BigQuery and then investigate the recommendations with DataStudio or Looker, or use Connected Sheets that let you use Google Workspace Sheets to interact with the data stored in BigQuery without having to write SQL queries.
As with any other Recommender, you can choose to opt out of data processing at any time by disabling the appropriate data groups in the Transparency & control tab under Privacy & Security settings.
We hope that you can leverage Unattended Project Recommender to improve your cloud security posture and reduce cost, and can’t wait to hear your feedback and thoughts about this feature! Please feel free to reach us at active-assist-feedback@google.com and we also invite you to sign up for our Active Assist Trusted Tester Group if you would like to get early access to the newest features as they are developed.
More Relevant Stories for Your Company
How We Built a Brand New Bank on Google Cloud and Cloud Spanner: The First Scalable, Enterprise-grade, Database Service
Editor’s note: Technology today lets companies of any size take on entire industries simply with an innovative business model plus digital distribution. Take Shine, a French startup whose platform helps freelancers manage their finances -- and their administrative commitments. Here, Raphael Simon, Shine’s CTO and co-founder, talks about why Shine
A Step-by-Step Guide to Lift-and-Shift a Line of Business Application onto Google Cloud
Want to move an existing business application to the Cloud? Want to make sure that the process is painless, easy, reliable, and provides the necessary cost benefits? Well, it’s not as complex as many technology professionals think. On the contrary, by understanding the various steps involved in the process, identifying

Highnote Build the First Flexible, End-to-end Embedded Finance Platform on Google Cloud
The ability to quickly introduce and evolve payment options for products or services is essential for businesses, as nearly 50% of consumers who can’t use a preferred payment method abandon their purchase. At the same time, gift cards, branded credit cards and rewards programs are critical tools that companies rely
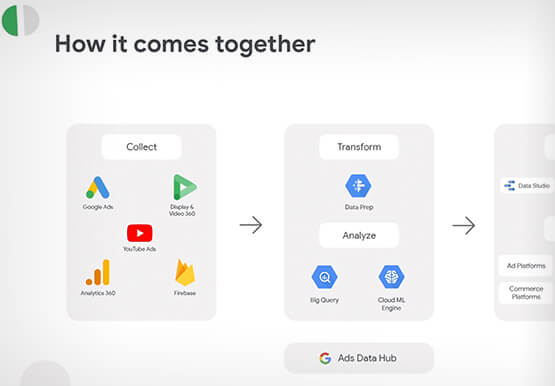
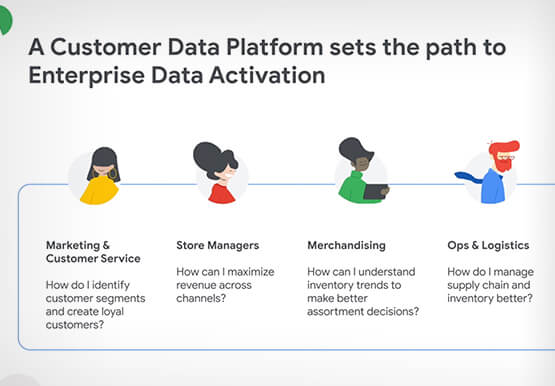


How Google’s Customer Data Platform Helps Retail Brands Offer Data-driven , Personalized CX
Retail companies need customer insights to deliver personalized experiences that impact revenue generation and cost savings. Watch how Google Cloud's customer data platform helps brands integrate and build holistic view of data in silos to drive marketing and customer service success.
