





Transforming Businesses with Google Distributed Cloud Edge Appliance: A Look at Real-World Use Cases

2536
Of your peers have already read this article.
4:30 Minutes
The most insightful time you'll spend today!
While many organizations are driving digital transformation by migrating to the cloud, there are some industries, geographies, and use cases that require a different approach to cloud modernization. Regulated industries such as healthcare, insurance, pharmaceutical, energy, telecommunication, and banking have stringent data residency and sovereignty requirements. Other industries need to meet local data processing requirements, while others require real-time data processing with sub-millisecond latencies, for example to detect defects on manufacturing lines. These use cases demand a combination of edge, on-premises and cloud services for their infrastructure.
With these requirements in mind, Google Cloud launched Google Distributed Cloud powered by Anthos to extend the power of Google Cloud infrastructure and services to the edge (or closer). The underlying infrastructure for this service comes in two variants: a 42U rack filled with compute, storage, and networking devices called Google Distributed Cloud Edge Rack and a 1U appliance called Google Distributed Cloud Edge Appliance.
In this blog post, we discuss the Google Distributed Cloud Edge Appliance and how manufacturing, retail, and automotive industry verticals can use it to address common use cases.
How the appliance works
But first, let’s talk about the Google Distributed Cloud Edge Appliance itself.
Google Distributed Cloud Edge Appliances comprises two components: (1) Distributed Cloud Edge infrastructure and (2) the Distributed Cloud Edge service.
The Google Distributed Cloud Edge service runs on Google Cloud and serves as a control plane for the nodes and clusters running on your appliance. In order to perform remote management of the appliance and to collect metrics, the Distributed Cloud Edge service must be connected to Google Cloud at all times, allowing you to manage your workloads on the edge hardware through the Google Cloud Console. For customers who can’t be connected at all times for data residency or sovereignty reasons, we highly recommend that the appliance be connected to the cloud at least once a month to allow for needed security patches and updates.
Google Distributed Cloud Edge Appliances come with built-in network ports that provide connectivity to the control plane via the internet, Cloud VPN, or Dedicated Interconnect, and to your on-prem network. Each Google Distributed Cloud Edge Appliance is homed to a specific Google Cloud region but it is designed to also use any public Google Cloud endpoint to communicate with the control plane in Google Cloud, allowing you to move these appliances between different geographic locations.
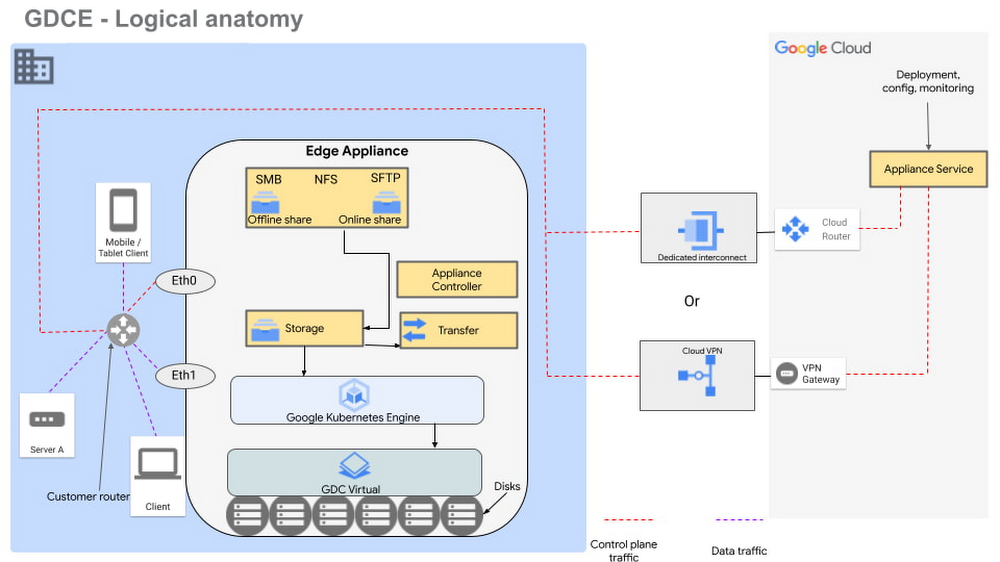
Figure 1 – Logical design of Google Distributed Cloud Edge Appliance
There are two NFS shares on each appliance; one is offline, meaning it does not transfer data to Google Cloud, and the other is online, meaning data saved to that share is synced to Cloud Storage on Google Cloud for further processing. The appliance supports Server Message Block (SMB) and Secure File Transfer Protocols (SFTP) for communication.
Each Google Distributed Cloud Edge Appliance runs Google Distributed Cloud Virtual, enabling you to build a single-node Kubernetes cluster with access to the underlying file system of the appliance. This allows you to build containerized applications on the underlying appliance hardware to address use cases in the following verticals.
Vertical use cases
Now that you understand how Google Cloud Edge Appliance is configured, let’s consider some of the industry use cases where it can provide unique value.
Manufacturing
In the manufacturing industry, quality control and safety is a crucial factor. Businesses need to ensure products are manufactured to the highest standards to remain competitive in their markets, to retain customers, and to keep factory workers safe. To do this, manufacturers need real-time data about the products being manufactured on the production lines, ensuring quality control and gaining a real-time view of where people are on the factory floor.
In manufacturing environments, Google Distributed Cloud Edge Appliance can be used to detect hazards or manufacturing defects in real-time. Figure 1 is a reference architecture for a hazard detection solution running off a Google Distributed Cloud Edge Appliance on a factory floor.
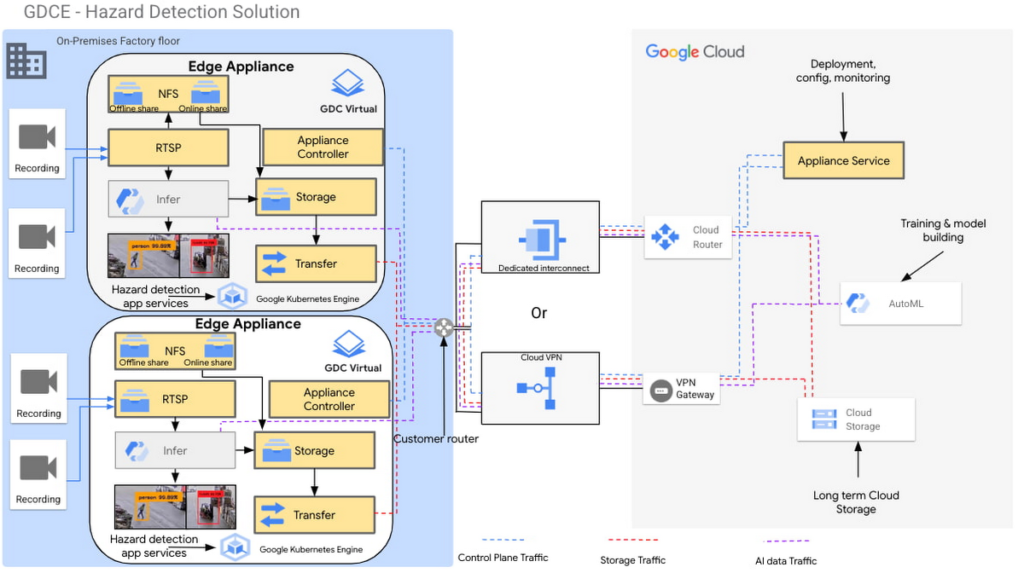
Figure 2 – Hazard detection architecture using Google Distributed Cloud Edge Appliance
In this architecture, cameras on the factory floor stream live video into the Google Distributed Cloud Edge Appliance. Depending on the number of cameras and appliances, cameras could be split or mapped to different appliances. This architecture makes it possible to initially transfer video data to Google Cloud using an online NFS share. Once in Google Cloud, you can use AutoML to train and build models that can be used as part of the hazard detection solution.
With these trained models, the cameras can stream video data into the appliance using the real-time streaming protocol (RTSP). You can then use AutoML inference to analyze the real-time video streaming data.
For example, in this reference architecture, if an individual comes too close to the fork lift, a function is triggered by the microservices running on the edge appliance that pushes a notification either to a messaging service, or to an enterprise resource planning tool. This alerts factory managers to factory floor hazards in real time so they can take corrective action.
You can also review messages and videos later on for preventive planning purposes, or push streamed videos to Cloud Storage for archive, to use the appliance’s storage space more efficiently.
Data transfers to Google Cloud can be done over Google Cloud Dedicated Interconnect, or VPN between the region and your site. This connectivity also allows you to send the appliance’s control-plane network traffic to the region.
You could also use the reference architecture in figure 2 for a product anomaly detection solution running off a Google Distributed Cloud Edge Appliance on a factory floor or manufacturing line. In this instance, machine learning models are trained to detect anomalies on finished products before final packaging.
Retail
In the retail industry, the Google Distributed Cloud Edge Appliance reference architecture in Figure 2 enables a number of transformative capabilities for retail operations, including:
- contactless checkout
- product scans
- mobile-scan-bag
- cashierless checkout
- unattended retail shops
- visual check-out monitoring
It does all this within a retailer’s facilities with the low latency and high throughput you need to process data locally, so you can obtain actionable insights from your data.
Or, you could use Google Distributed Cloud Edge Appliance at the edge to overhaul store management operations, for example, monitoring store occupancy, queue depth and wait times, detecting slips and falls and out-of-stock items, or monitoring inventory compliance.
Automotive
Advanced Driver Assistance Systems (ADAS) are becoming standard in modern automobiles. To successfully build and roll out continued improvements around ADAS, the automotive industry continues to run extensive tests on ADAS systems that are built into the vehicles they manufacture. Automotive companies can use Google Distributed Cloud Edge Appliance to modernize and transform how they collect data for the ADAS systems they’re developing. For example, test vehicles contain several different sensors that generate data, which can be quickly offloaded to an in-vehicle edge appliance.
Then, within the appliance, you can deploy containerized workloads to transform sensor data, infer videos and images and detect events. This alleviates the need for operators to label all events and allows development teams to quickly gather insights from the tests.
If you want to focus on a subset of information, you can transfer specific data or the entire data payload into Transfer Appliances when vehicles return to the development center. All these systems, i.e., transfer appliances and edge appliances, work in tandem to reduce local system administration and operational costs through a cloud-based control plane.
This approach allows you to deploy, track, monitor and configure services that are running in data centers or at edge locations from the cloud. From the factories, the data can be moved offline or online into Google Cloud where you can use different storage classes and processing capabilities to further process or store the data. You can also deploy newly trained models and business rules back to the edge appliances. In all this, data transfers between the cloud and the appliance are performed using end-to-end encryption, to give you control over your data.
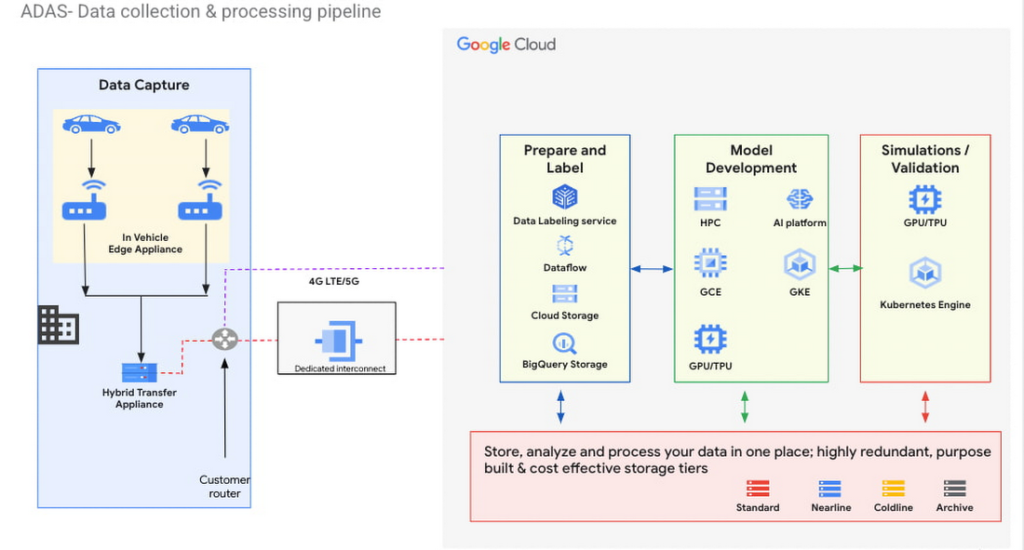
Figure 3 – ADAS implementation with a Google Distributed Cloud Edge Appliance
The reference architecture in Figure 3 shows an ADAS implementation where Google Distributed Cloud Edge Appliance is being used to gather, process and transform data at the edge in the automotive industry. It could also be applied to data capture and processing use cases in manned and unmanned vehicles. Notice how the Distributed Edge Appliance extends to the cloud by sending data there, or using other cloud-based services.
We’re just getting started
These are just a few of the use cases where organizations in the manufacturing, retail and automotive industries are using Google Distributed Cloud Edge Appliance with modern and containerized applications that are powered by Google Cloud. If you’re interested in bringing the power of Google Cloud to the edge using Google Distributed Cloud Edge Appliances to transform your business, reach out to us or any of our accredited partners.
BigQuery Omni: Your Solution for Multi-Cloud Geospatial Analytics

1500
Of your peers have already read this article.
6:30 Minutes
The most insightful time you'll spend today!
As we become increasingly reliant on technology to make decisions, geospatial data is becoming more critical than ever. It is a powerful resource that can be used to solve a variety of problems, from tracking the movement of goods, identifying interest areas and potential areas of disaster.
Geospatial data incorporates data with a geographic component, such as latitude and longitude coordinates, addresses, postal codes, or place names, and can be obtained from a variety of sources, including satellites, sensors, and surveys, making it an incredibly powerful tool with a broad range of applications.
One of the key features of BigQuery, Google Cloud’s serverless enterprise data warehouse, is its ability to analyze geospatial data. However, oftentimes geospatial data sits in a variety of public clouds, not just Google Cloud. To access it effectively, you need a multi-cloud analytics solution that lets you capitalize on the distinct capabilities of each cloud platform, while extracting insights and value from data sitting across multiple cloud platforms.
BigQuery Omni is a multi-cloud analytics solution that enables the analysis of data stored across public cloud environments, including Google Cloud, Amazon Web Services (AWS) and Microsoft Azure, without the need to transfer the data. With BigQuery Omni, users can employ the same SQL queries and tools used to analyze data in Google Cloud to analyze data in other clouds, making it easier to gain insights from all data, regardless of the storage location. For businesses using multiple clouds, BigQuery Omni is an excellent tool to unify analytics and optimize the value of data.
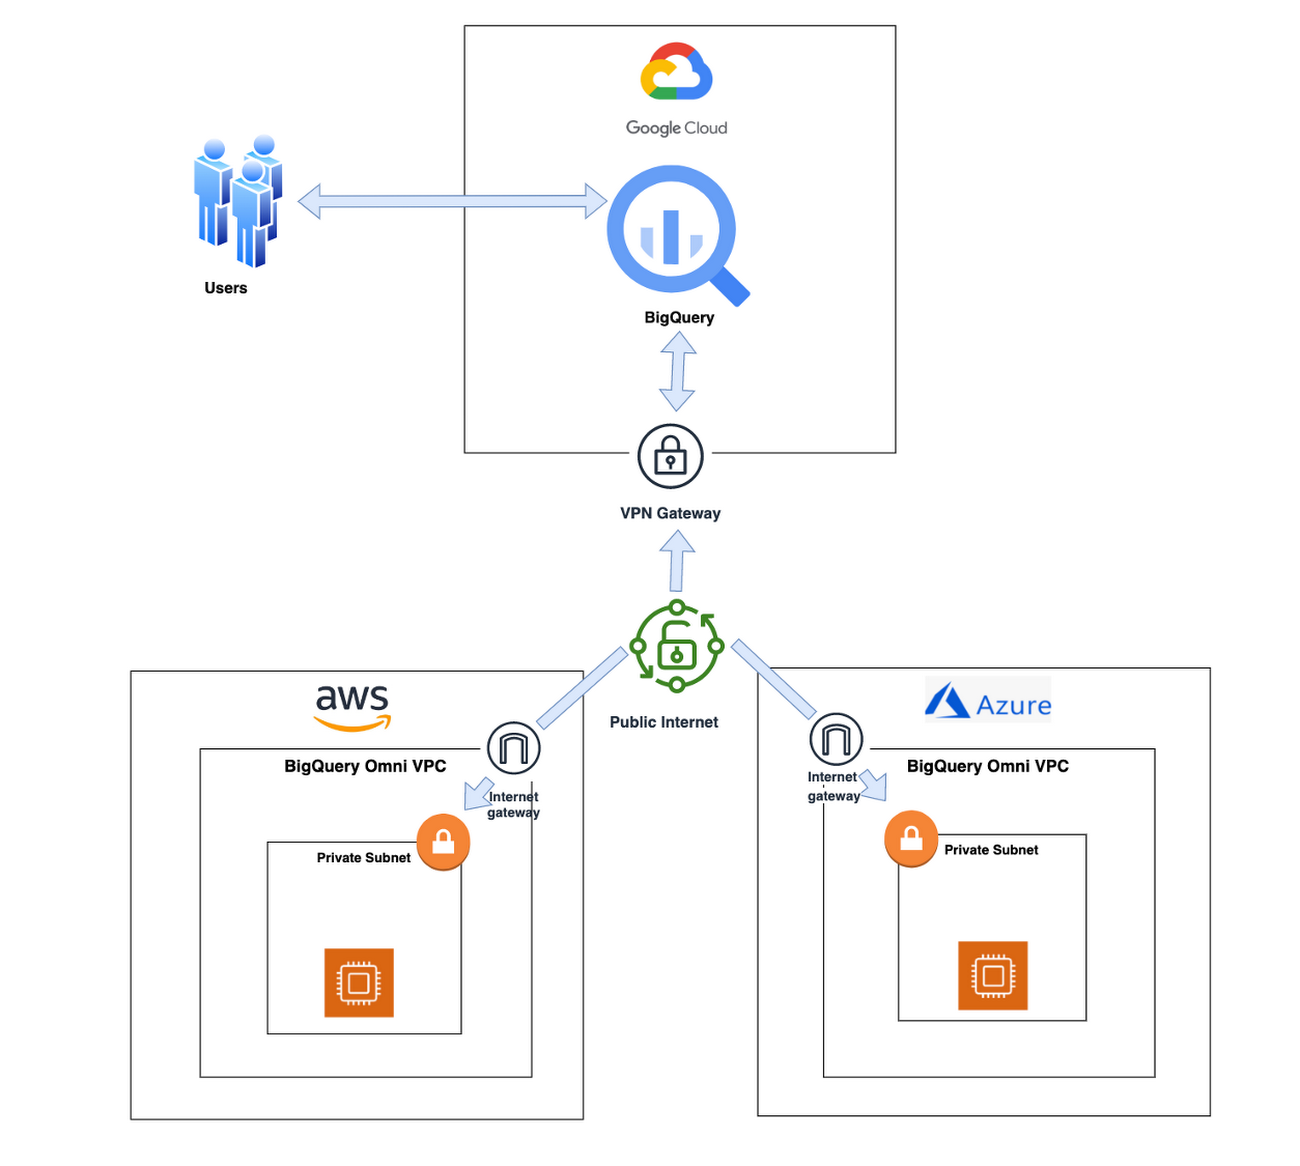
With BigQuery Omni, organizations can analyze location-based information or geographic components, such as latitude and longitude coordinates, addresses, postal codes, or place names without even copying their data to Google Cloud. For example, you could use BigQuery Omni to analyze data from a fleet of delivery vehicles to track their location and identify potential problems.
BigQuery Omni and geospatial data analysis
If you are working with geospatial data, BigQuery Omni is a powerful tool that can help you to get insights from your data. It is scalable, reliable, and secure, making it a great option for unifying your analytics and getting the most out of your data.
Here are a few examples of ways organizations might use BigQuery Omni for geospatial data:
- A transportation company could use BigQuery Omni to analyze data from GPS sensors in its vehicles to track the movement of its fleet and identify potential problems.
- A retail company could use BigQuery Omni to analyze data from its point-of-sale systems to track customer behavior and identify trends.
- A government agency could use BigQuery Omni to analyze data from its weather sensors to track the movement of storms and identify areas at risk of flooding.
BigQuery Omni and geospatial data can be used together to gain insights into a variety of business problems. Specifically, some of the advantages of using BigQuery Omni and geospatial data include:
- Access to quality geospatial data: BigQuery supports loading of newline-delimited GeoJSON files and provides built-in support for loading and querying geospatial data. Data from public data sources like BigQuery public datasets, the Earth Engine catalog, and the United States Geological Survey (USGS) can be easily integrated into your BigQuery environment. Earth Engine has an integrated data catalog with a comprehensive collection of analysis-ready datasets, including satellite imagery and climate data. This data can be combined with proprietary data sources such as SAP, Oracle, Esri ArcGIS Server, Carto, and QGIS.
- Loading and preprocessing of geospatial data: BigQuery has built-in support for loading and querying geospatial data types, and you can use partner solutions such as FME Spatial ETL to load data.
- Working with different geospatial data types and formats: BigQuery supports a variety of file types and formats including WKT, WKB, CSV and GeoJSON.
- Coordinate reference systems: BigQuery’s geography data type is globally consistent. That means that your data is registered to the WGS84 reference system and your analyses can span a city block or multiple continents.
Overall, geospatial analytics with BigQuery Omni provides a wide range of technical capabilities for processing and analyzing geospatial data, making it a powerful tool for businesses that need to work with location-based data.
Analyzing geospatial data with BigQuery Omni
Imagine a retailer who has a large chain of department stores with locations all over the country. They are looking to expand their business and want to identify areas with high sales potential. They want a way to get a better understanding of their sales volume within specific geographic boundaries. To achieve this goal, the retailer turns to the GIS (Geographic Information System) functions built into BigQuery. Here are the steps what the retailer takes to analyze this dataset:
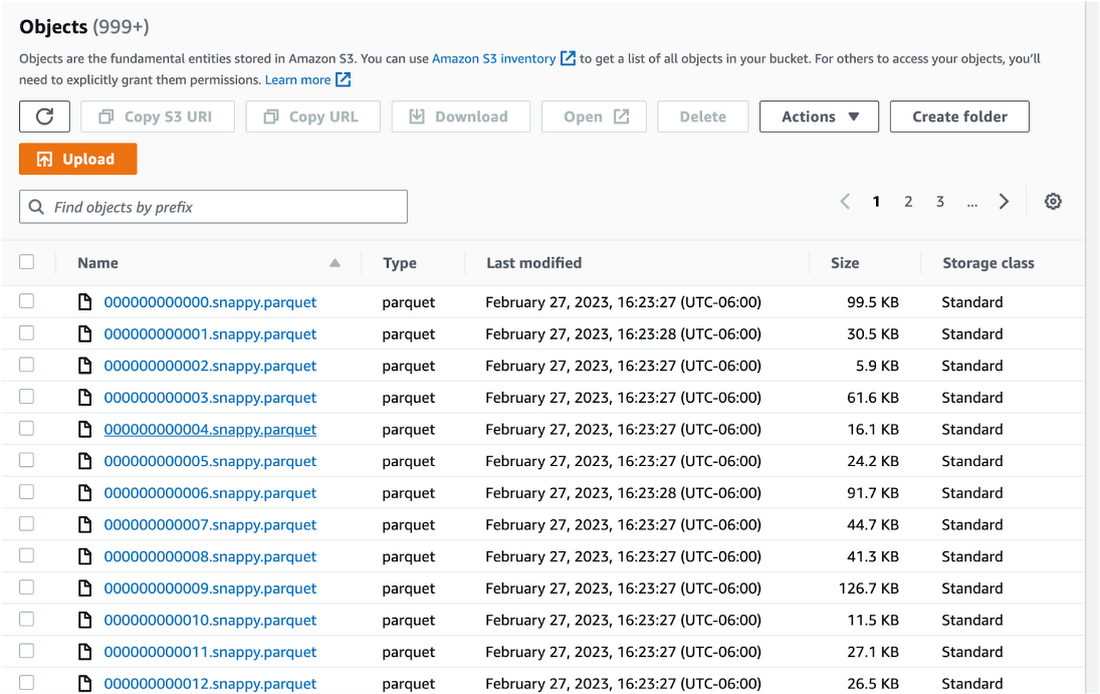
Step 1 : An initial orders dataset on AWS S3 contains 5.54 million rows, and with separate locations (300 rows) and zipcode (33144 rows) metadata files on AWS S3.
Orders Parquet files:
Location and Zipcode files:

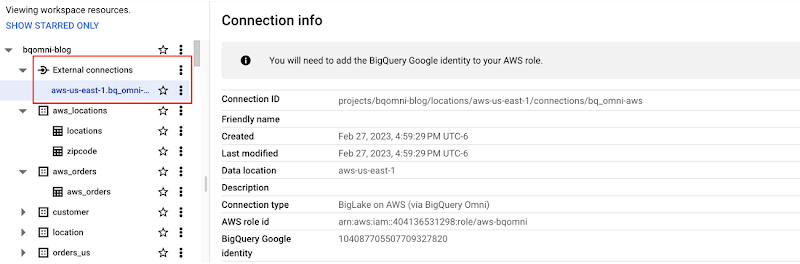
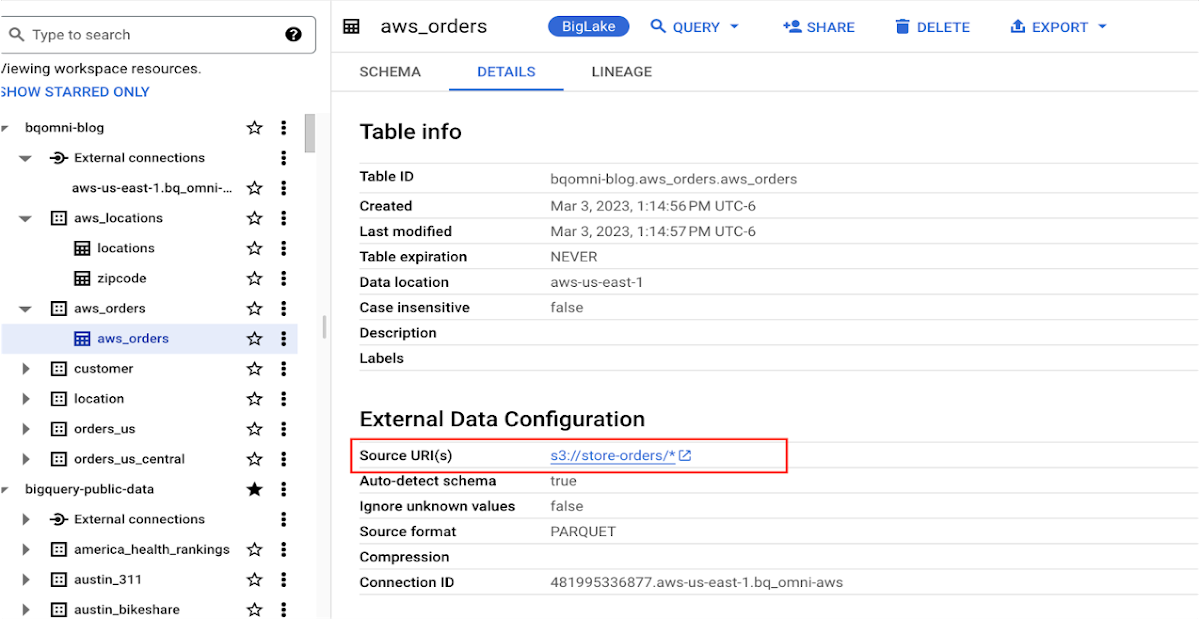
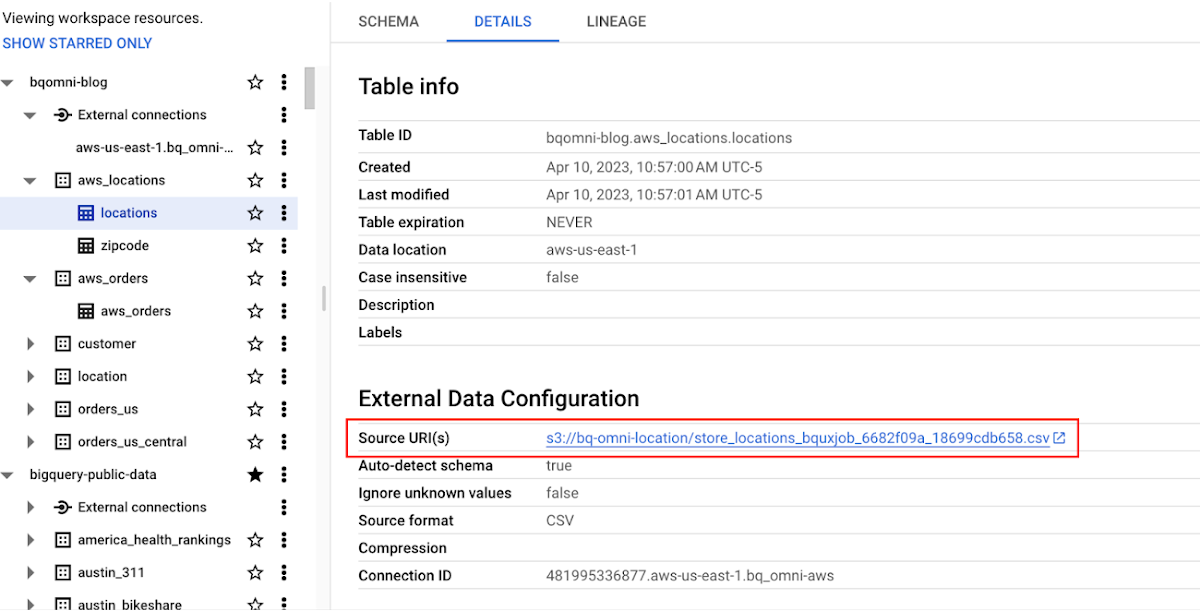
Step 2 : The retailer uses BigQuery Omni to establish a connection between the data stored in AWS and BigQuery, enabling them to access the S3 datasets externally.
External Connection for AWS
External Table for orders
External Table for locations
External Table for zipcode
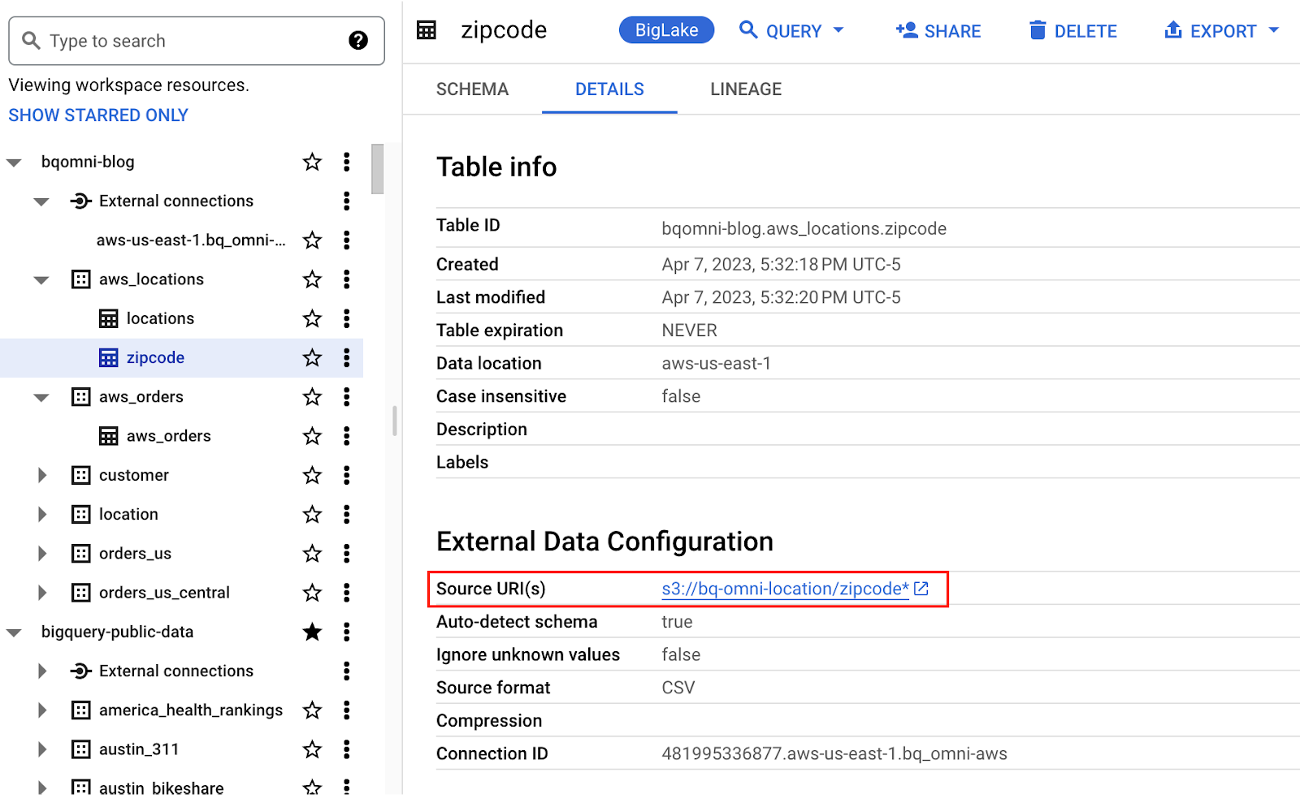
Step 3 : They combine the orders and locations datasets using BigQuery Omni, and remotely aggregate the data on AWS. Joining this dataset with geospatial datasets helps them derive geospatial coordinates.
The final aggregated dataset is reduced to 23 rows. Subsequently, they bring back the result dataset, which contains just 23 rows. This helps them reduce the extraction of millions of rows to just 23 rows for their geospatial analytics.
Select sales.store_city store_city,
sales.number_of_sales_last_10_mins number_of_sales_last_10_mins,
sales.store_zip store_zip,
 ST_GeogPoint(zip_lat_lng.longitude ,
   zip_lat_lng.latitude  ) geo
FROM (
 SELECT
   FORMAT_DATETIME("%X",
     CURRENT_DATETIME("America/Los_Angeles")) current_time,
   MAX(DATETIME(time_of_sale,
       "America/Los_Angeles")) time_of_last_sale,
   COUNT(1) number_of_sales_last_10_mins,
   locations.city store_city,
   locations.zip store_zip
 FROM
   `bqomni-blog.aws_locations.orders_small`  sales
 JOIN
   `bqomni-blog.aws_locations.locations` locations
 ON
   sales.store_id = locations.id
 GROUP BY
   locations.city,
   locations.zip ) sales
JOIN
   `bqomni-blog.aws_locations.zipcode` zip_lat_lng
ON
 cast(sales.store_zip as INT) = cast(zip_lat_lng.zipcode as INT)
 WHERE ST_WITHIN( ST_GeogPoint(zip_lat_lng.longitude , zip_lat_lng.latitude  ) ,ST_GeogFromText(zip_lat_lng.zipcode_geom ) )
 AND zip_lat_lng.state_name  = "New York"
 ORDER BY number_of_sales_last_10_mins
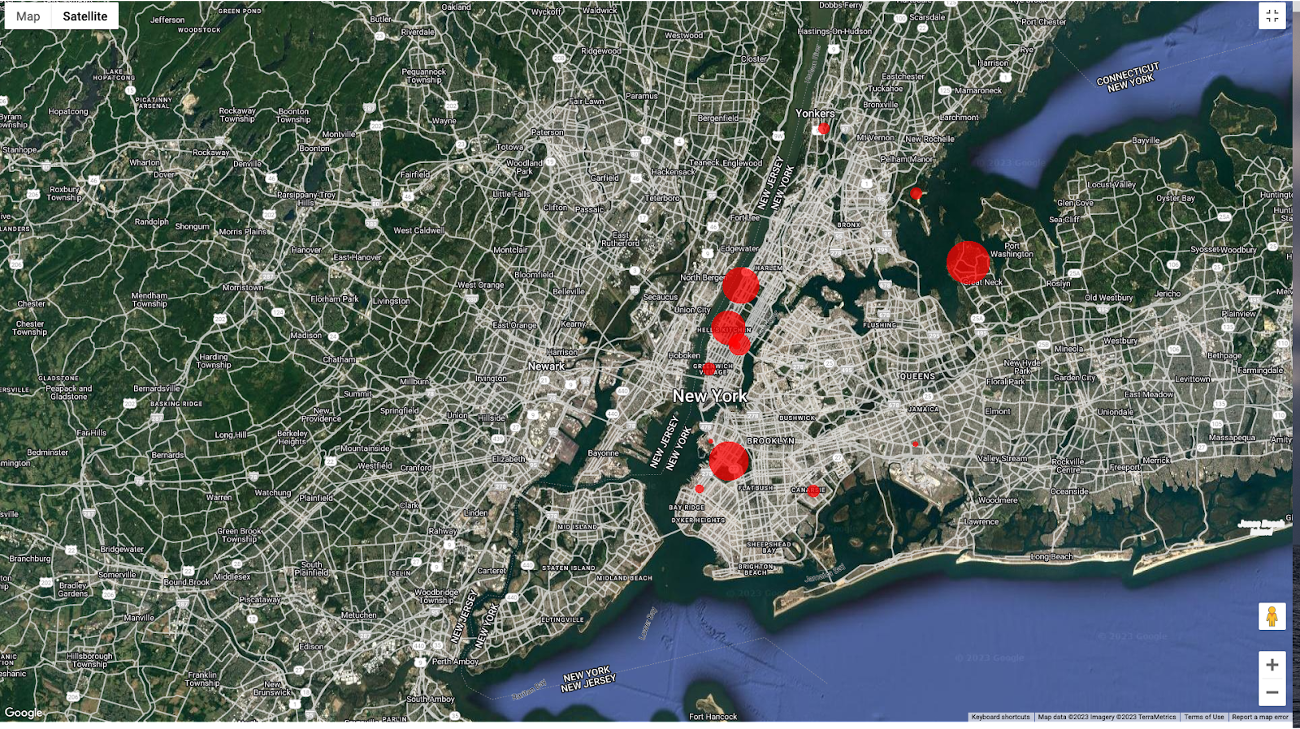
Aggregated Sales data by region
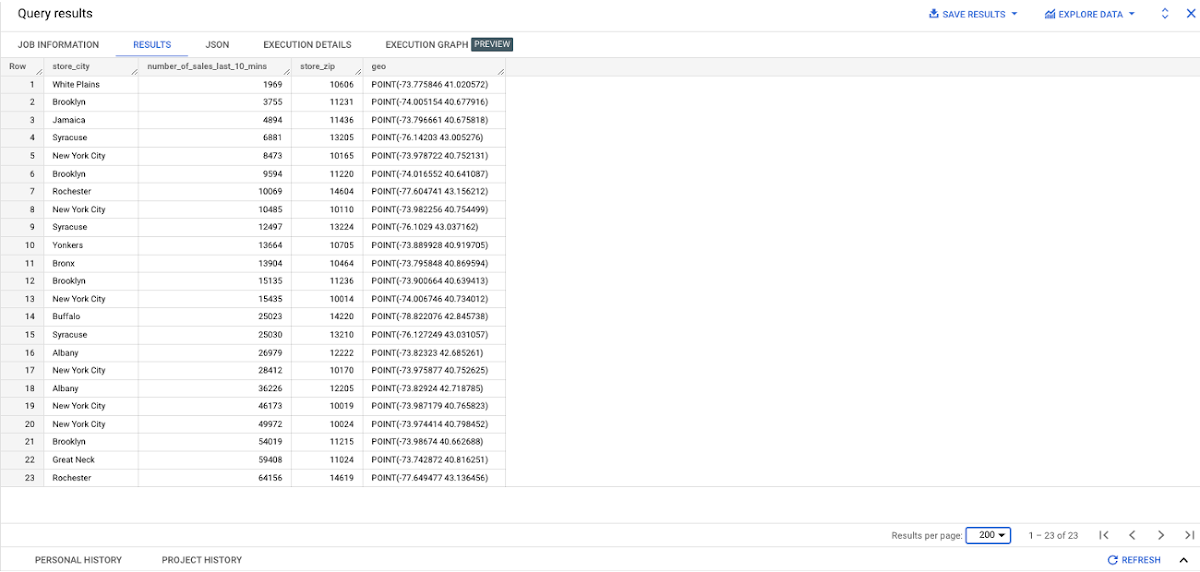
To build richer views of their sales volume data, the retailer uses BigQuery GeoViz integration, a powerful tool that allows for visualizing geographic data on maps.BigQuery Geo Viz is a web tool for visualization of geospatial data in BigQuery using Google Maps APIs. You can run a SQL query and display the results on an interactive map
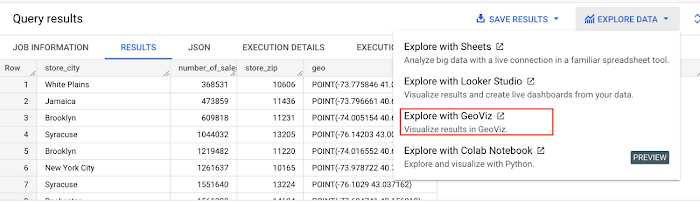
BigQuery Geo view for sales data analysis
With the geo-tagged data in place, the retailer can now see regional sales volume, sales density, distribution by department by time, and distribution within department, all powered through BigQuery.
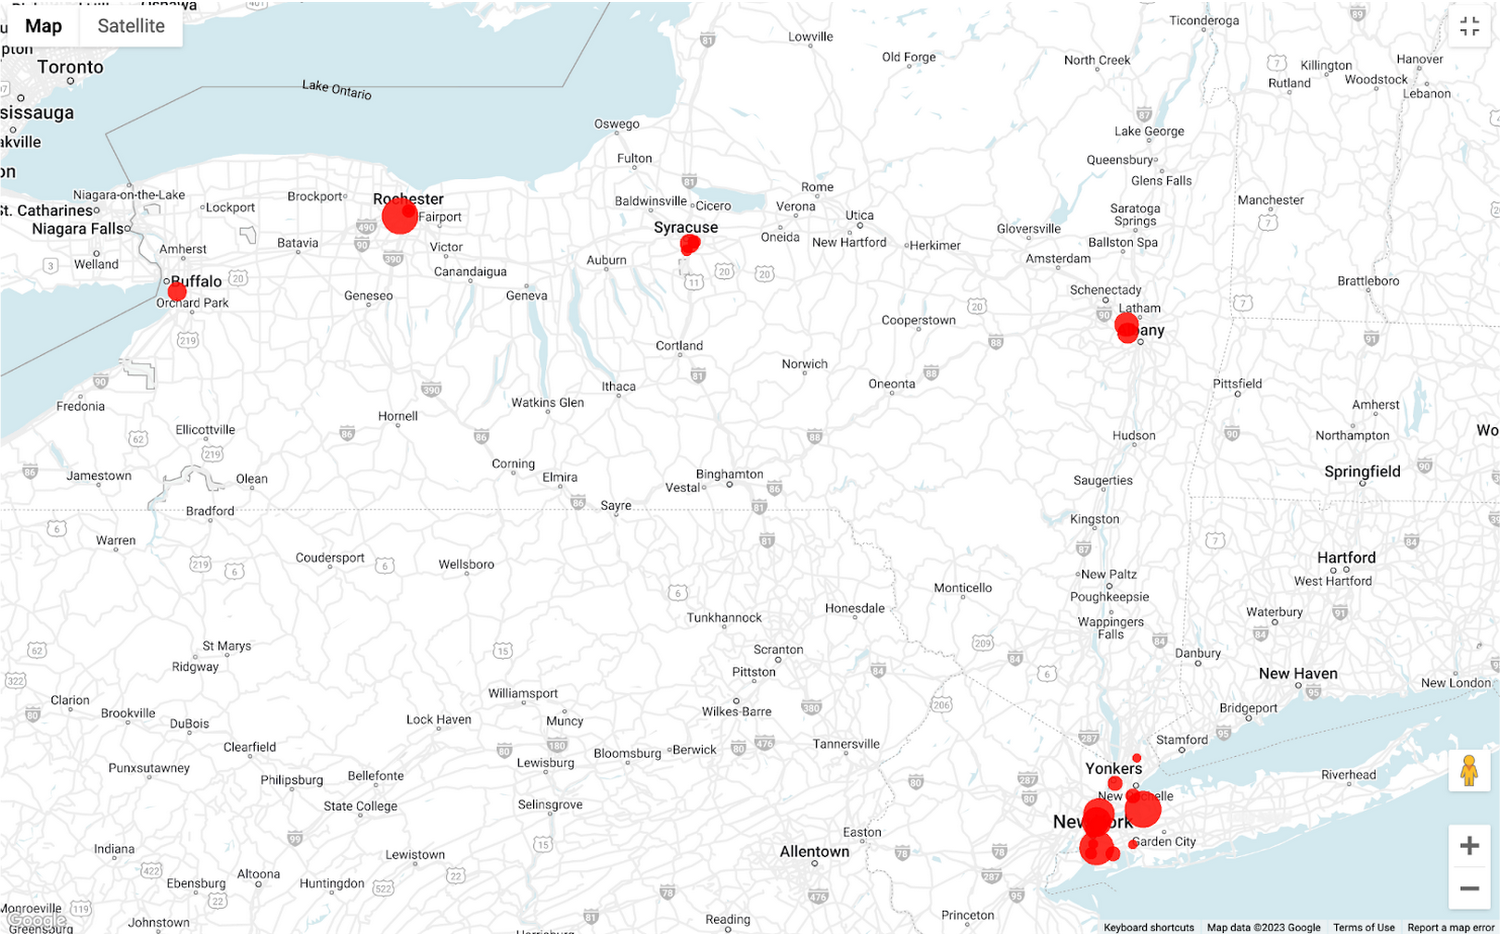
Satellite view
Benefits of using BigQuery Omni
Beyond geospatial analysis, BigQuery Omni offers a number of benefits, including:
Reduced costs: BigQuery Omni’s ability to eliminate data transfers between clouds can help organizations reduce costs and simplify data management, making it a valuable tool for multi-cloud analytics. Also, the ability to access and analyze data across multiple clouds can reduce the need for data replication and synchronization, which can further simplify the ETL process and improve data consistency.
Unified governance: BigQuery Omni uses the same security controls as BigQuery, which include features such as encryption, access controls, and audit logs, to help protect data from unauthorized access.
Single pane for analytics: BigQuery Omni provides a single interface for querying data across all three clouds, which can simplify the process of analyzing data and reduce the need for organizations to use multiple analytics tools.
Flexibility: Analyze data stored in any of the supported cloud storage services, giving organizations the flexibility to work with the data they have regardless of where it’s located.
BigQuery Omni is a valuable tool for geospatial analysis because it allows you to analyze data from multiple sources without having to move the data. This can save you time and money, and it can also help you to get more accurate insights from your data.If you are looking for a way to improve the accuracy, efficiency, and decision-making of your business, using BigQuery Omni to analyze geospatial data can be a powerful tool.
References
- Omni-introduction
- Omni-benefits
- Omni-aws-create-connection
- Omni-azure-create-connection
- BigQuery Omni Retail Demo on Looker
- Omni-pricing
- Working with Geospatial Data
- Geospatial Analytics – Intro
Learn more about how BigQuery Omni can help your organization.
3756
Of your peers have already watched this video.
38:00 Minutes
The most insightful time you'll spend today!
Microservices in the Cloud with Kubernetes and Istio
Are you building or interested in building microservices? They are a powerful method to build a scalable and agile backend, but managing these services can feel daunting: building, deploying, service discovery, load balancing, routing, tracing, auth, graceful failures, rate limits, and more.
The most suited solution for you is Istio. Istio is built with containers and microservices management in mind. The Apigee Edge API platform provides common visibility and management across both APIs and microservices for organizations of any size.
For instance, within a single Kubernetes cluster—and even with Istio helping mediate—an unreliable or slow microservice can drag the SLA of an entire application down along with it.
The kinds of sophisticated analytics that the Apigee platform provides can help administrators and product managers see these kinds of issues and react to them before it’s too late. Apigee is used by many organizations to enforce various types of quotas, allowing API teams to dynamically adjust how much API load is consumed by each organization who uses an API. This session will show you how the Kubernetes container management system and Istio service mesh can simplify many of the operational challenges of microservices, including an in-depth live demo.
Google Cloud Helps Northwell Health to Boost Caregiver Productivity and Access to Right Care Using AI

7966
Of your peers have already read this article.
2:00 Minutes
The most insightful time you'll spend today!
Lung cancer is the leading cause of cancer death in the United States and like any cancer, early detection is crucial to survival. Screening at-risk populations is an important part of reducing mortality, and if concerning nodules are found on imaging, further testing may be required. Today, we’ll share how Northwell Health uses Google Cloud products such as Cloud Healthcare APIs and BigQuery to increase caregiver productivity and deliver better care for patients with findings that indicate potential development of lung cancer.
Northwell is New York’s largest healthcare provider
Northwell Health is New York’s largest healthcare provider with 23 hospitals and nearly 800 outpatient facilities. Northwell’s nearly 4,000 doctors care for millions of patients each year, and at this scale, there is an immense amount of healthcare data to manage. To better manage and leverage this data, Northwell Health partnered with Google Cloud starting in 2018.
Enabling caregivers to spend more time with patients
Nic Lorenzen, the lead developer of Northwell Emerging Technology and Innovation team, has a mission to put together data for caregivers in a way that makes sense. It is no secret that inefficient electronic health records systems have a negative impact on a physician’s ability to deliver quality care. Traditional EHRs have information distributed across many tabs, which forces caregivers to spend considerable time at the computer trying to find information. Moreover, speed of care matters. If care is delayed, patients may have to spend more time in the hospital and may suffer worse health outcomes.
To solve this problem, Nic’s team focused on giving caregivers the most relevant pieces of data at the right time by developing an intelligent clinician rounding app. The data needed to derive these insights can depend on the caregiver’s role–a nurse cares about different things than a cardiologist. This system aggregates multiple data sources, and provides patient-specific insights to caregivers.
This system would not have been possible before with traditional EHRs and data warehouses that have proprietary data models and rarely sync data in real time. Now with data easily accessible through Google Cloud’s Healthcare solutions, Nic’s team can deliver the right clinical information to the right people instantly. These days, Nic says, “instead of spending 75% of our time dealing with architecting the underlying platforms, we spend 75% of our time focused on higher value use cases for clinicians and patients. Google Cloud’s Healthcare solutions have greatly improved our developer productivity and time to value.”
Caregivers have found this new system to be a game changer.Before the implementation of this system, caregivers would spend, on average, seven to nine minutes finding the data needed to make medical decisions for one patient. Now, that aggregated information is delivered to a caregiver’s mobile device in less than a second.
Ensuring patients get the right care with the power of AI
There are a number of reasons why patients might not get the care that they need. For example, patients today can go to multiple hospitals and clinics settings, and coordinating care across multiple facilities is complex. Regional hospitals and clinics have their own siloed view of their data, so pertinent information gathered by one clinic might not be seen by another. These gaps in clinical data lead to gaps in patient care.
When a patient gets radiologic imaging, they may have findings unrelated to the reason they initially got the imaging. For example, a chest CT for a car accident might reveal an incidental lung nodule that could be cancerous. Unfortunately, research shows that a large portion of patients do not get follow up for these incidental findings because it isn’t the primary reason why the patient is seeing a doctor. Moreover, social determinants of health are a factor that affects which patients receive follow-up care. Identifying these patients and providing the necessary follow up care prevents adverse events related to delayed detection of cancer.

With Cloud Healthcare solutions, Northwell built an AI model to identify these patients so that oncologists can appropriately follow up with patients who have findings suspicious for lung cancer. The AI model detects incidental pulmonary nodules in radiology reports so that doctors can then contact the patients that need follow-up care. Nic says his team was able to build this system in a week: “Google Cloud did a lot of heavy-lifting for us and allowed us to get to the AI applications much faster. It allowed us to build a platform that just works.”
Healthcare systems can now rapidly generate healthcare insights with one end-to-end solution, Google Cloud Healthcare Data Engine. It builds on and extends the core capabilities of the Google Cloud Healthcare API to make healthcare data more immediately useful by enabling an interoperable, longitudinal record of patient data. Northwell Health uses Google Cloud as the core of their platform, enabling their developers to create solutions to the most pressing healthcare problems.
Special thanks to Kalyan Pamarthy, Product Management Lead on Cloud Healthcare and Natural Language APIs for contributing to this blog post.

3694
Of your peers have already downloaded this article
8:45 Minutes
The most insightful time you'll spend today!
For most established businesses today, the disruptive start-up has emerged as the biggest and most intimidating competition. A start-up’s digital prowess and astounding ability to innovate and scale massively in weeks, for what takes conventional businesses quarters, is daunting. How does one compete with that?
To play in today’s digitally-connected world, companies need to be equipped to deliver apps and digital experiences at lightning speed. How do you leverage insights from your environment of customers, partners, suppliers, and, in many cases, stores, warehouses, and inventory and use all that data to deliver relevant products and services? How do you unlock the data from your slow-moving systems of record to build those apps and experiences at the speed and agility of the App Store?
Gartner calls it bi-modal IT: an approach that enables an organization to protect the back-end systems and also drive rapid innovation. Think of it as an enterprise gearbox that enables you to scale your interactions a million times . In this eBook we explore how businesses can implement an API tier to keep backend transaction systems humming as front-end digital interactions scale to billions of requests and interactions , way beyond what your systems were designed to do.
NCR’s Emerald Leverages Google Cloud to Help Grocers Boost Operational Agility
8247
Of your peers have already read this article.
3:00 Minutes
The most insightful time you'll spend today!
In recent years, the grocery industry has had to shift to facilitate a wider variety of checkout journeys for customers. This has meant ensuring a richer transaction mix, including mobile shopping, online shopping, in-store checkout, cashierless checkout or any combination thereof like buy online, pickup in store (BOPIS).
What’s more, in the past year and a half alone grocers have had to enable consumers new ways to shop for essentials. This has included needing to rapidly integrate or build on-demand delivery apps, offer curbside pickup with near-instant fulfillment as well as support touchless and cashless checkout experiences. Searches on Google Maps for retailers in the US with curbside pickup options have increased by 9000% since March 2020, and we believe these trends from 2020 will continue to define the future of grocery shopping.
The future of grocery will require agility and openness
Firstly, the need to rapidly adapt to changing consumer habits will be the new normal. Grocers will increasingly look to digitally transform legacy retail systems and modernize point of sale (POS) platforms to deliver and scale omnichannel experiences as quickly as possible. This necessitates a more agile and open architectural approach to technology – one built on microservices and leverages APIs so that new applications and experiences can be built, integrated and delivered faster.
Automation and data-driven retailing will be table stakes
In order for retailers to blend what they’re offering in the store with digital experiences more efficiently, they will also need to automate more. For example, with automation and business intelligence, grocers can take labor that might have been tied up with tender operations and checkout and redistribute those resources to restocking shelves, curbside pick-up or improving customer experiences.
Automation and access to real-time in-store inventory & supply chain data can also help grocers avoid the supply chain challenges seen in the early days of COVID-19. Grocers will need to find ways to leverage automation to ingest, organize, and analyze data from physical store networks, digital channels, distribution centers to better forecast demand and manage future fluctuations.
How NCR and Google Cloud are helping grocers adapt to disruption with operational agility
Helping grocers improve operational agility to address changing consumer shopping habits and to thrive during times of disruption is something that NCR and Google Cloud have teamed up to do. NCR has over 135 years of experience in retail, having invented the cash register and are continuing to help grocers innovate. NCR Emerald builds upon the company’s leadership in POS software and has turned it into a unified platform that helps grocers operate the entire store from front to back. The solution supports cashier-led checkout, self-checkout, integrated payments, merchandising, and enables regional managers and corporate employees access to the analytics and tools needed to optimize loyalty programs and promotions.

NCR has invested in a comprehensive, agile, and API-led retail architecture that lets grocers continually innovate and design new experiences as customers and the industry evolve. By running Emerald on Google Cloud, NCR can offer the solution on a subscription basis, helping grocers lower upfront capital expenditures and ensuring scalability. What’s more, NCR can tap into Google Cloud’s strength in data, analytics, and openness to deliver three key imperatives. Let’s take a look at each of these below.
Run the way grocers need to while leveraging Google Cloud as a single source of logic
Traditionally the POS system lived in the store. If disaster strikes, people still need access to food and essentials so the grocery store still needs to operate. It hardly gets more mission-critical than that. NCR Emerald is built on microservices, leveraging Kubernetes for front-of-house compute, and VMs (See graphic 1 below). This makes it easy to support lightweight clients accessible by store employees via any range of mobile devices, computer terminals, self-service kiosks, peripheral devices like receipt printers as well as legacy applications.
What’s unique is that because Emerald runs on Google Cloud, it supports all those in-store and digital touchpoints mentioned above, but also allows grocers to run lean. Emerald leverages Google Cloud as a single source of truth and operates a lot of what it does out of logic. Every sales transaction coming from every channel, including e-commerce, can be logged via NCR’s Hosted Service and centralized in BigQuery and Bigtable as a transaction data master. This enables the grocer to manage any transactional use case very consistently, whether it e supporting customers who want to purchase in one store and return in another, offering digital receipts or the ability to exchange online purchases in store. Emerald on Google Cloud can help retailers extend capabilities through the power of the cloud but not need to live exclusively in the cloud. In other words, the solution allows grocers the ability to run the way they need to.

Enable data-driven and real-time decision making for grocers
Store managers, regional managers, category managers, and others all require different cuts of the data to do their jobs effectively. However, data silos persist and how data is formatted and arranged can still remain pretty static. Therefore allowing users with different roles the ability to view and analyze that data quickly and in different ways continues to be a challenge.
As mentioned above, Emerald leverages Google Cloud data management solutions as the central repository for transactional, behavioral, and merchandising data. Every transaction from every store and every channel can be stored via NCR Hosted Service on BigQuery and Bigtable. NCR Analytics then harnesses the advanced analytical and data visualization capabilities of Looker to help grocers get a consolidated view of their business across all channels and then allow employees to slice and dice the data they way they need to. NCR Analytics also leverages the power of Google Cloud AI and machine learning to add another level of intelligence to the retailer’s data. For example, store managers can visualize how well they’re using their real estate and see how productive lanes 1-3 are compared with 7-10 or compare self-service versus manned lanes. By mapping to the retailer’s own catalog, they can also break down category-level performance and trends.

NCR Analytics takes advantage of Google Cloud’s data pipeline to reduce processing time, with scaling and resource management provided out of the box. By letting the cloud store and process the data, NCR is providing the ability for retailers to analyze their data in near real-time across all platforms – a real game changer in the grocery business.
Open APIs let grocers continually enrich the retail experience
Finally, Emerald is built on an API-first architecture managed through Apigee. It uses the power of Apigee as an open API platform to expose how Emerald can work with other NCR applications like loyalty and promotions, and third party applications like mobile ordering and order delivery to enrich the grocery experience for employees and customers. Every API that Emerald uses is available on Apigee, allowing them to share code samples and giving developers the ability to run scripts. This approach can allow retailers the ability to innovate in a fraction of the time and cost, speeding up 3rd party integrations up front and as businesses grow.
Take, for example, Northgate Market, a chain of 40 stores in California, that were able to transform its digital operations and enable experiences that set it apart from competitors – quickly and simply with Emerald. It took less than 6 months to go from contract to live deployment in the first store. Since then, Northgate Market has been able to extend their intelligence by leveraging the power of Looker and NCR Analytics.
Learn more about how NCR has been able to leverage an open, cloud-enabled architecture to help customers innovate across the retail, hospitality, and banking industries on the webinar “Role of APIs in Digital Transformation”. You can also learn more about how Northgate uses e-commerce to transform customer experience and gain consumer insights.
More Relevant Stories for Your Company

Rollouts Made Simple: Cloud Deploy’s Deploy Hooks
Cloud Deploy is a fully managed continuous delivery platform that automates the delivery of your application. Recently, we’ve heard from users that they want Cloud Deploy to also perform self-defined pre- and post-deployment operations to reduce the amount of additional toil required for each rollout. Examples of such operations include database schema

Meet the 8 Sponsors of 2021 State of DevOps Reports
Google Cloud and the DORA research team are excited to announce our eight sponsors for the 2021 State of DevOps report. We recently launched the 2021 State of DevOps survey, a 25-min survey for the DevOps community to share how they are using DevOps to improve software delivery performance. So if you haven’t

Dataflow Guarantees 50+% Increase in Developer Productivity and Infrastructure Cost Savings: Read More
In our conversations with technology leaders about data-driven transformation using Google Data Cloud - industry’s leading unified data and AI solution - , one important topic is incorporating continuous intelligence to move from answering questions such as “What has happened? to questions like “What is happening?” and “What might happen?”.


Reduce Costs, Increase Profits by Modernizing Your Mainframe Applications with Google Cloud
Mainframe powers much of global commerce and for decades—with its proprietary platform and legendary lock-in—was resistant to effective competition. Even years after most organizations began adopting public cloud, migrating off the mainframe remains too complex for many organizations to undertake. Google Cloud brings a unique, automated approach to modernization enabling
