





VMware Engine’s Exciting New Updates: A Google Cloud Journey

1337
Of your peers have already read this article.
2:30 Minutes
The most insightful time you'll spend today!
IT leaders today are being asked to simultaneously support their company’s infrastructure, find opportunities for growth, and meet their goals with fewer resources and smaller budgets than before. Recently we highlighted three customers who are leveraging Google Cloud VMware Engine to achieve these goals while lowering their TCO and transforming their organization.
It’s because of these successful customer outcomes that we have been awarded the 2023 VMware Cloud Innovation and SaaS Transformation partner achievement award for delivering solutions that accelerate customers’ digital transformation journey. We’re honored to receive this award and continue to stay focused on delivering tremendous value to our customers.
In the past few months, we’ve also made several updates to Google Cloud VMware Engine. Today’s post provides a recap of the latest milestones that make it easier for you to migrate and run your vSphere workloads in a cloud-first, enterprise-class VMware environment in Google Cloud.
Back in September 2022, we announced a number of updates including the preview of API/CLI support (which is now available). In February 2023, we also talked about how to use NetApp CVS as datastores for VMware Engine.
Key updates this time around include:
Availability of VMware Engine in Delhi, Santiago and Milan regions: This brings the availability of VMware Engine to 17 regions worldwide, each supporting 4 9’s of uptime SLA for clusters 5 or more, serving the needs of our regional and multi-national customers. In addition, we have also added a second zone in the London region.
Filestore datastore support for VMware Engine: Generally Available in all VMware Engine regions, you can use Filestore High Scale and Enterprise tier instances as external NFS datastores for VMware Engine nodes. Filestore is VMware certified as an NFS datastore with VMware Engine. You can size compute and storage capacity independently to meet your workload requirements for your storage-intensive VMs. You can also leverage vSAN for low-latency VM requirements and scale Filestore from TBs to PBs for the capacity hungry VMs. If interested in this feature, please contact your Google account team.
Stretched private clouds: These private clouds stretch across two data zones and a witness zone all within the same Google Cloud region. Stretched private clouds use vSphere and vSAN stretched clusters to provide compute and storage high availability against zone-level failures. This capability is now available in Frankfurt and Sydney regions. Learn more here.
Zerto solution version 9.5u1 support: This recovery solution allows critical infrastructure and application virtual machines (VMs) to be replicated continuously from your on-premises vCenter to your private cloud. Learn more about setting up Zerto here.
Google Cloud Backup and Disaster Recovery (GCBDR): GCBDR is available to protect applications running in VMware Engine, and can be managed within the Google Cloud Console. We recently launched GCBDR under Google Cloud Platform Terms of Service simplifying customers’ purchasing and support experience.
vTPM support: Google Cloud VMware Engine private clouds now support the addition of a Trusted Platform Module (TPM) 2.0 virtual cryptoprocessor to a virtual machine. You can add vTPMs to VMs by following VMware instructions or upgrading your existing VMs to include a vTPM. You can read more about this in the VMware blog.
This brings us to the end of our updates this time. For the latest updates to the service, please bookmark our release notes.
Innovation in the Clouds: Sky’s Blue-Sky Approach to FinOps

2914
Of your peers have already read this article.
2:30 Minutes
The most insightful time you'll spend today!
Google Cloud’s partnership with Sky Group, one of Europe’s largest media and entertainment companies, dates back more than four years to when Sky first became a Google Cloud customer moving diagnostic data from millions of its Sky Q TV boxes to its Google Cloud data platform.
In June 2019, a few years into their cloud adoption journey, Sky was faced with a challenge they had anticipated from the start. Their recent bill across all major cloud providers had been increasing rapidly, reaching their planned yearly budget after only six months. Sky wasn’t sure if they’d undershot their forecasts, if they were overspending, or both.
“In the beginning, we were given a brief to investigate internal cloud spend with the aim of finding out where we could make savings, but in reality we didn’t know what we would expect to find,” said Nathan King, a cloud architect in the Cloud Enablement Center and now Head of Cloud Financial Management (FinOps) at Sky since the start of 2020.
Nathan assembled a small team who started to explore Google Cloud spend using the Cloud Billing tool. At first, they drilled into their biggest Google Cloud cost categories and discovered some immediate cost optimizations with BigQuery, Compute Engine and Cloud Storage. Over the course of the next six months, through careful analysis, they managed to find over $1.5m in immediate savings, exceeding expectations.
Yet they soon realized this was just the tip of the iceberg—it was clear there were millions of pounds more savings to be made, but actually achieving them at scale would require careful planning. “We formed a FinOps function to target these savings, but with 600 to 700 projects for Google Cloud alone, spanning four Google Cloud organizations, it would have been a manual process and difficult for teams to digest our recommendations,” Nathan said.
After attending a Google-led FinOps workshop and shaping their FinOps strategy, Nathan’s team focused on iterating through the FinOps lifecycle phases of Inform, Optimize, Operate and generating savings over time. Here’s how they did it:
Inform: Make Information Visible
The first step was focused on developing a clear vision for cost allocation and recharge, which required partnering closely with the finance, procurement and tax teams (particularly for international and affiliates) to understand the supporting business logic and processes. With a lot of hard work, the team managed to break down barriers to implement and embed new processes into broader business functions like finance.
WIth the recharge model in place, the team ran a number of pilots to find the right FinOps tooling to meet their needs. They ran a number of pilots, including using Data Studio and visualizing BigQuery exports. Given their ambitions to scale across the enterprise globally, the team chose Google Cloud’s Looker to realize their vision, building intuitive dashboards to visualize spend and recommendations across all cloud providers. “We wanted one view across all clouds, where customers can dynamically see cloud spend and intelligent optimization recommendations in just one place,” Nathan said.
After less than three weeks of development, the Looker dashboards were ready to go and have been a game changer ever since. “The moment our leadership and different departments started seeing the Looker dashboards, the value we were adding as a FinOps team became immediately clear,” Nathan said.
There are different report pages for each stakeholder group, each custom developed and automated using Looker and BigQuery. The BigQuery Optimization page, for example, provides insights on Slots consumed across the organization, down to granular query data like the cost of each query, how it was written, who submitted it and number of slots utilized. The dashboards also highlight potential areas of optimization, like BigQuery datasets without retention policies set or where data isn’t partitioned.
A recent breakthrough has been building pages for business teams, showing the related cloud spend contributing to a business unit of value, such as the cost per live stream or per subscriber in Sky’s case. Although this is an inherently difficult metric to capture, the opportunity has been made possible with the FinOps team’s progress and is starting to drive business investment decisions.
Optimize: Drive Cloud Efficiency
The second stage of the FinOps lifecycle focuses on delivering optimizations. As Sky’s FinOps dashboards were operationalized and highlighted savings opportunities, they enabled users to generate more than $3 million in Google Cloud savings alone in 2020 and over $800,000 in other cloud providers.
The team began with focusing on the top four products by spend: BigQuery, Compute Engine, Cloud Dataflow and Cloud Storage. Working with their Google account team and studying Google whitepapers and blog posts like Cloud cost optimization: principles for lasting success, they developed their own best practice guidance and embedded recommendations into the dashboards.
Creating their own recommenders and leveraging Google Cloud’s recommenders, the team discovered a plethora of cost optimization opportunities. “Key examples were overly expensive queries, storage buckets set without retention policies, and VMs without autoscaling enabled,” Nathan said. Teams were then empowered to make their own savings, like the NowTV business unit that had been forecast to overspend for the year until they received their dashboard with thousands of optimization recommendations. After just three weeks, the team had implemented more than 90% of recommendations and brought their spend under budget for the year, saving more than 50%.
The FinOps team still searches for new recommendations every day and have been collaborating with Google product managers to take their insights to the next level. “We’ve loved partnering with Google product managers, who encourage us to give feedback on new features before they go to market. We’ve also shared some of our in-house recommenders to influence the features being developed by Google, including the Idle VM and Idle Persistent Disk Recommenders as part of Active Assist,” Nathan said.
Operate: Embed FinOps & Drive Self-Sufficiency
Now that teams could visualize their cloud spend and make real-time decisions based on cost optimization recommendations, the FinOps team has begun working on embedding processes, leveraging machine learning, and improving efficiency in their own ways of working.
Looker’s extensive capabilities continue to play a role in this. “Before we started using Looker, our most popular report was an electricity bill showing customers’ detailed monthly cloud spend, previous month comparisons and forecasts for months ahead,” Nathan said. “This report took days, sometimes weeks to run. With Looker, we’ve automated the entire process and brought that time down to just minutes.”
More teams are embedding the dashboards into their own processes, like finance, which now uses the interactive dashboards in meetings instead of static report snapshots, or in-house Google Cloud architects, who use the recommendations to optimize their cloud spend before deploying any technology.
As the FinOps team continues to operate like a product function, designing with CX/UX in mind and iteratively releasing new features like anomaly reporting, budget alerts, and forecasting based on machine learning, it’s becoming clear that Cloud Financial Management is a key capability and mindset that can impact wide-reaching parts of the business at scale.
Elevating Sky’s FinOps journey to the next level
Indeed, as more business teams collaborate with the FinOps function, the opportunities are growing. “The FinOps team has changed the way we view and manage cloud spend, enabling us to partner with finance and show digestible reports to the CFO. We’re now looking further to broaden our range of insights, like elevating our dashboards to understand how using Google Cloud is supporting Sky’s Net carbon zero ambitions by incorporating Google’s data center sustainability metrics,” says Vince Marco, Architecture Manager at Sky.
So, after being unsure of drivers for their increasing cloud spend in 2019, 18 months later Sky is far more confident about its investment decisions. The team knows that every dollar spent is being used optimally and driving maximum value for its investment.
If you’re an enterprise using cloud, but want to better manage cloud costs, consider setting up a FinOps capability and creating a FinOps mindset. Looker can help you get started by providing reporting and insights into cloud expenditures to identify initial savings. As you learn more and scale, empower teams to make their own savings utilizing built-in actionality for monitoring and customizing for business billing activity nuances and department-specific chargebacks. Reimagine how cloud finances can be managed and optimized as Sky is doing.
To learn more about Looker’s Cloud Cost Management Block visit Looker Marketplace.
Answering the 4 Common FAQs on Compute Engine

3862
Of your peers have already read this article.
1:30 Minutes
The most insightful time you'll spend today!
Compute Engine lets you create and run virtual machines (VMs) on Google’s infrastructure, allowing you to launch large compute clusters with ease. When it comes to getting started with Compute Engine, our customers have lots of questions—but some questions come up more often than others.
We looked at an internal list of the most popular Compute Engine documentation pages over a 30-day period to find out what topics were explored by users again and again. Here are the top four questions users have about Compute Engine, in order.
1. What are the different machine families
Compute Engine lets you select the right machine for your needs. You can choose from a curated set of predefined virtual machine (VM) configurations optimized for specific workloads, ranging from small-level purpose to large-scale use cases or create a machine type customized to your needs with our custom machine type feature.
Compute Engine machines are categorized by machine family, including:
- General-purpose: Best price-performance ratio for a variety of standard and cloud-native workloads
- Compute-optimized: Highest performance per core for compute-intensive workloads, such as ad serving or media transcoding
- Memory-optimized: More compute and memory per core than any other family for memory-intensive workloads, such as SAP HANA or in-memory data analytics
- Accelerator-optimized: Designed for your most demanding workloads, such as machine learning (ML) or high performance computing (HPC)
Read the documentation to learn more about each machine family category.
2. How to connect to VMs using advanced methods
In general, we recommend using the Google Cloud Console and the gcloud command-line tool to connect to Linux VM instances. However, some of our customers want to use third-party tools, or require alternative connection configurations.
In these cases, there are several methods that might fit your needs better than the standard connection options:
- Connecting to instances using third-party tools (e.g. Windows PuTTY, Chrome OS Secure Shell app), or MacOS or Linux local terminal)
- Connecting to instances without external IP addresses
- Connecting to instances as the root user Manually connecting between instances and running commands as a service account
Read the documentation to learn about advanced methods for connecting Linux VMs.
3. How to set up OS Login
OS Login lets you use IAM roles and permissions to manage access and permissions to VMs.
OS Login is the recommended way to manage users across multiple instances or projects. OS Login provides:
- Automatic Linux account lifecycle management
- Fine-grained authorization using Google IAM without having to grant broader privileges
- Automatic permissions updates to prevent unwanted access
- Ability to import existing Linux accounts from Active Directory (AD) and Lightweight Directory Access Protocol (LDAP)
You can also add an extra layer of security by setting up OS Login with two-factor authentication or manage organization access by setting up organization policies.
Read the documentation to learn how to configure OS login and connect to your instances.
4. How to manage SSH keys in metadata
Compute Engine allows you to manually manage SSH keys and local user accounts by editing public SSH key metadata.
You can add public SSH keys to instance and project metadata using:
- The Google Cloud Console The gcloud command-line tool
- API methods from the Google Cloud Client Libraries
Read the documentation to learn how to manually manage SSH keys and local user accounts in metadata.
Don’t see your question here? Check out the Compute Engine documentation for all of our recommended guides, tutorials, and resources.

4001
Of your peers have already downloaded this article
3:30 Minutes
The most insightful time you'll spend today!
Everything COOs need to know to make an informed decision
about migrating and modernizing their businesses’ core
technology estate to the cloud.
Intel-Google Collaboration Brings Edge Computing on Factory Floors: Hannover Messe 2022

3224
Of your peers have already read this article.
1:30 Minutes
The most insightful time you'll spend today!
The typical smart factory is said to produce around 5 petabytes of data per week. That’s equivalent to 5 million gigabytes, or roughly 20,000 smartphones.
Managing such vast amounts of data in one facility, let alone a global organization, would be challenging enough. Doing so on the factory floor, in near-real-time, to drive insights, enhancements, and particularly safety, is a big dream for leading manufacturers. And for many, it’s becoming a reality, thanks to the possibilities unlocked with edge computing.
Edge computing brings computation, connectivity, and data closer to where the information is generated, enabling better data control, faster insights, and actions. Taking advantage of edge computing requires the hardware and software to collect, process, and analyze data locally to enable better decisions and improve operations.
At Hannover Messe 2022, Intel and Google Cloud will demonstrate a new technology implementation that combines the latest generation of Intel processors with Google Cloud’s data and AI expertise to optimize production operations from edge to cloud. This proof-of-concept project is powered by the Edge Insights for Industrial platform (EII), an industry-specific platform from Intel; and a pair of Google Cloud solutions: Anthos, Google Cloud’s managed applications platform, and the newly-launched Manufacturing Data Engine.
Edge computing exploits the untapped gold mine of data sitting on-site and is expected to grow rapidly. The Linux Foundation’s “2021 State of the Edge” predicts that by 2025, edge-related devices will produce roughly 90 zettabytes of data. Edge computing can help provide greater data privacy and security, and can accomodate the reduced bandwidth needs between local storage and the cloud.
Imagine a world in which the power of big data and AI-driven data analytics is available at the point where the data is gathered to inform, make, and implement decisions in near real-time.
This could be anywhere on the factory floor, from a welding station to a painting operation or more. Data would be collected by monitoring robotic welders, for example, and analyzed by industrial PCs (IPCs) located at the factory edge. These edge IPCs would detect when the welders are starting to go off spec, predicting increased defect rates even before they appear, and adding preventive maintenance to correct the errors without any direct intervention. Real time, predictive analytics using AI could substantially prevent defects before they happen. Or the same IPCs could use digital cameras for visual inspection to monitor and identify defects in real-time, allowing them to be addressed quickly.
Edge computing has powerful potential applications in assisting with data gathering, processing, storage and analysis in many manufacturing sectors, including automotive, semiconductor and electronics manufacturing, and consumer packaged goods. Whether modeling and analysis is done and stored locally or in the cloud, or is predictive, simultaneous, or lagged, technology providers are aligning to meet these needs. This is the new world of edge computing.
The joint Intel and Google Cloud proof of concept aims to extend the Google Cloud capabilities and solutions to the edge. Intel’s full breadth of industrial solutions, hardware and software, are coming together in this edge-ready solution, encompassing Google Cloud industry-leading tools. The concept shortens the time to insights, streamlining data analytics and AI at the edge.
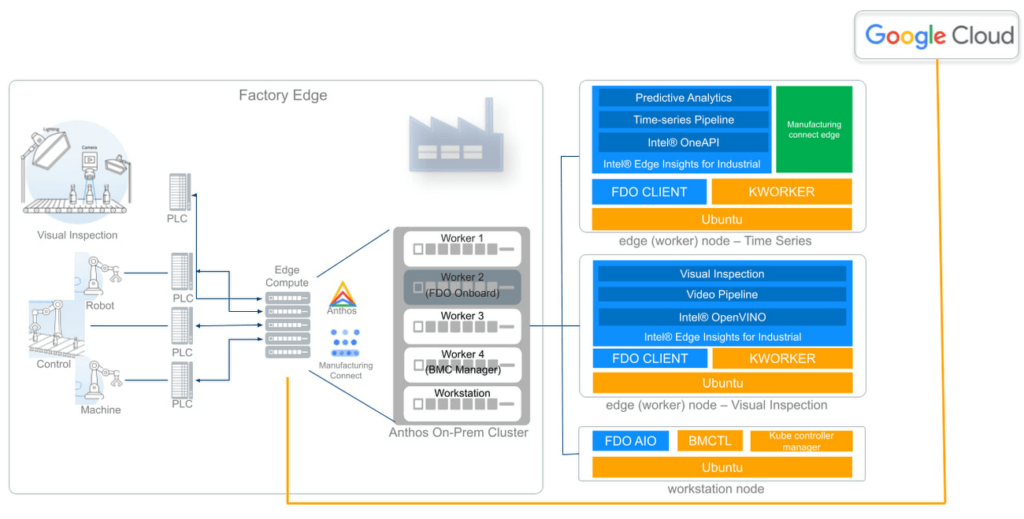
The Intel-Google Cloud proof of concept demonstrates how manufacturers can gather and analyze data from over 250 factory devices using Manufacturing Connect from Google Cloud, providing a powerful platform to run data ingestion and AI analytics at the edge.
In this demonstration in Hannover, Intel and Google Cloud show how manufacturers can capture time-series data from robotic welders to inspect welding quality and show how predictive analytics can benefit the factory operators. In addition, the video and image data is captured from a factory camera to show how visual inspection can highlight anomalies on plastic chips with model scoring. The demo also features zero-touch device onboarding using FIDO Device Onboard (FDO) to illustrate the ease with which additional computers could be added to the existing Anthos cluster.
By combining Google Cloud’s expertise in data, AI/ML and Intel’s Edge Insight’s for Industrial platform that was optimized to run on Google Anthos, manufacturers can run and manage their containerized applications at the edge, in on-premise data center, or in public clouds using an efficient and secure connection to the Manufacturing Data Engine from Google Cloud. It forges a complete edge-to-cloud solution.
Simplified device onboarding is available using Fido Device Onboard (FDO)—an open IoT protocol that brings fast, secure, and scalable zero-touch onboarding of new IoT devices to the edge. FDO allows factories to easily deploy automation and intelligence in their environment without introducing complexity into their OT infrastructure.
The Intel-Google Cloud implementation can analyze that data using localized Intel or third-party AI and machine learning algorithms. Applications can be layered on the Intel hardware and Anthos ecosystem, allowing customized data monitoring and ingestion, data management and storage, modeling, and analytics. This joint PoC facilitates and support improved decision making and operations, whether automated or triggered by the engineers on the front lines.
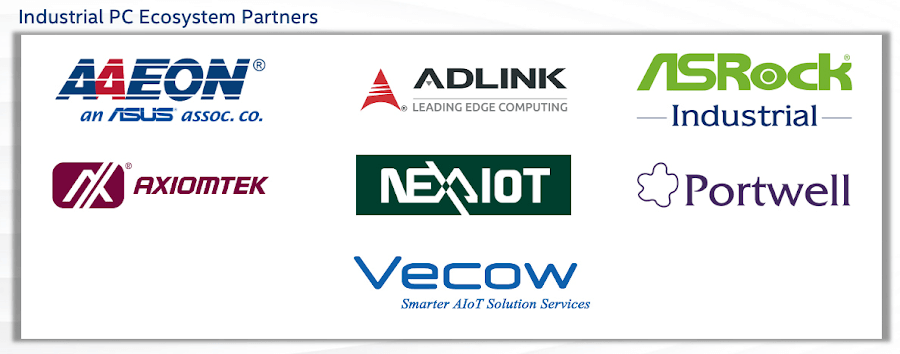
Intel collaborates with a vibrant ecosystem of leading hardware partners to develop solutions for the industrial market by using the latest generation of Intel processors. These processors can run data intensive workloads at the edge with ease.
Putting data and AI directly into the hands of manufacturing engineers can improve quality inspection loops, customer satisfaction, and ultimately the bottom line.
The new manufacturing solutions will be demonstrated in person for the first time at Hannover Messe 2022, May 30–June 2, 2022. Visit us at Stand E68, Hall 004, or schedule a meeting for an onsite demonstration with our experts.
10153
Of your peers have already watched this video.
1:00 Minutes
The most insightful time you'll spend today!
Predict User Churn on Gaming Apps with Google Analytics Data using BigQuery ML
User retention can be a major challenge for mobile game developers. According to the Mobile Gaming Industry Analysis in 2019, most mobile games only see a 25% retention rate for users after the first day. To retain a larger percentage of users after their first use of an app, developers can take steps to motivate and incentivize certain users to return. But to do so, developers need to identify the propensity of any specific user returning after the first 24 hours.
In this blog post, we will discuss how you can use BigQuery ML to run propensity models on Google Analytics 4 data from your gaming app to determine the likelihood of specific users returning to your app.
You can also use the same end-to-end solution approach in other types of apps using Google Analytics for Firebase as well as apps and websites using Google Analytics 4. To try out the steps in this blogpost or to implement the solution for your own data, you can use this Jupyter Notebook.
Using this blog post and the accompanying Jupyter Notebook, you’ll learn how to:
- Explore the BigQuery export dataset for Google Analytics 4
- Prepare the training data using demographic and behavioural attributes
- Train propensity models using BigQuery ML
- Evaluate BigQuery ML models
- Make predictions using the BigQuery ML models
- Implement model insights in practical implementations
Google Analytics 4 (GA4) properties unify app and website measurement on a single platform and are now default in Google Analytics. Any business that wants to measure their website, app, or both, can use GA4 for a more complete view of how customers engage with their business. With the launch of Google Analytics 4, BigQuery export of Google Analytics data is now available to all users. If you are already using a Google Analytics 4 property, you can follow this guide to set up exporting your GA data to BigQuery.
Once you have set up the BigQuery export, you can explore the data in BigQuery. Google Analytics 4 uses an event-based measurement model. Each row in the data is an event with additional parameters and properties. The Schema for BigQuery Export can help you to understand the structure of the data.
In this blogpost, we use the public sample export data from an actual mobile game app called “Flood It!” (Android, iOS) to build a churn prediction model. But you can use data from your own app or website.
Here’s what the data looks like. Each row in the dataset is a unique event, which can contain nested fields for event parameters.
SELECT *FROM `firebase-public-project.analytics_153293282.events_*`TABLESAMPLE SYSTEM (1 PERCENT)

This dataset contains 5.7M events from over 15k users.
SELECTCOUNT(DISTINCT user_pseudo_id) as count_distinct_users,COUNT(event_timestamp) as count_eventsFROM`firebase-public-project.analytics_153293282.events_*

Our goal is to use BigQuery ML on the sample app dataset to predict propensity to user churn or not churn based on users’ demographics and activities within the first 24 hours of app installation.

In the following sections, we’ll cover how to:
- Pre-process the raw event data from GA4
- Identify users & the label feature
- Process demographic features
- Process behavioral features
- Train classification model using BigQuery ML
- Evaluate the model using BigQueryML
- Make predictions using BigQuery ML
- Utilize predictions for activation
Pre-process the raw event data
You cannot simply use raw event data to train a machine learning model as it would not be in the right shape and format to use as training data. So in this section, we’ll go through how to pre-process the raw data into an appropriate format to use as training data for classification models.
This is what the training data should look like for our use case at the end of this section:

Notice that in this training data, each row represents a unique user with a distinct user ID (user_pseudo_id).
Identify users & the label feature
We first filtered the dataset to remove users who were unlikely to return the app anyway. We defined these ‘bounced’ users as ones who spent less than 10 mins with the app. Then we labeled all remaining users:
- churned: No event data for the user after 24 hours of first engaging with the app.
- returned: The user has at least one event record after 24 hours of first engaging with the app.
For your use case, you can have a different definition of bounce and churning. Also you can even try to predict something else other than churning, e.g.:
- whether a user is likely to spend money on in-game currency
- likelihood of completing n-number of game levels
- likelihood of spending n amount of time in-game etc.
In such cases, label each record accordingly so that whatever you are trying to predict can be identified from the label column.
From our dataset, we found that ~41% users (5,557) bounced. However, from the remaining users (8,031), ~23% (1,883) churned after 24 hours:
SELECTbounced,churned,COUNT(churned) as count_usersFROMbqmlga4.returningusersGROUP BY 1,2ORDER BY bounced

To create these bounced and churned columns, we used the following snippet of SQL code.
...#churned = 1 if last_touch within 24 hr of app installation, else 0IF (user_last_engagement < TIMESTAMP_ADD(user_first_engagement,INTERVAL 24 HOUR),1,0 ) AS churned,#bounced = 1 if last_touch within 10 min, else 0IF (user_last_engagement <= TIMESTAMP_ADD(user_first_engagement,INTERVAL 10 MINUTE),1,0 ) AS bounced,...
You can view the Jupyter Notebook for the full query used for materializing the bounced and churned labels.
Process demographic features
Next, we added features both for demographic data and for behavioral data spanning across multiple columns. Having a combination of both demographic data and behavioral data helps to create a more predictive model.
We used the following fields for each user as demographic features:
geo.countrydevice.operating_systemdevice.language
A user might have multiple unique values in these fields — for example if a user uses the app from two different devices. To simplify, we used the values from the very first user engagement event.
CREATE OR REPLACE VIEW bqmlga4.user_demographics AS (WITH first_values AS (SELECTuser_pseudo_id,geo.country as country,device.operating_system as operating_system,device.language as language,ROW_NUMBER() OVER (PARTITION BY user_pseudo_id ORDER BY event_timestamp DESC) AS row_numFROM `firebase-public-project.analytics_153293282.events_*`WHERE event_name="user_engagement")SELECT * EXCEPT (row_num)FROM first_valuesWHERE row_num = 1 #first engagement);
Process behavioral features
There is additional demographic information present in the GA4 export dataset, e.g. app_info, device, event_params, geo etc. You may also send demographic information to Google Analytics through each hit via user_properties. Furthermore, if you have first-party data on your own system, you can join that with the GA4 export data based on user_ids.
To extract user behavior from the data, we looked into the user’s activities within the first 24 hours of first user engagement. In addition to the events automatically collected by Google Analytics, there are also the recommended events for games that can be explored to analyze user behavior. For our use case, to predict user churn, we counted the number of times the follow events were collected for a user within 24 hours of first user engagement:
user_engagementlevel_start_quickplaylevel_end_quickplaylevel_complete_quickplaylevel_reset_quickplaypost_scorespend_virtual_currencyad_rewardchallenge_a_friendcompleted_5_levelsuse_extra_steps
The following query shows how these features were calculated:
WITHevents_first24hr AS (SELECTe.*FROM`firebase-public-project.analytics_153293282.events_*` eJOINbqmlga4.returningusers rONe.user_pseudo_id = r.user_pseudo_idWHERETIMESTAMP_MICROS(e.event_timestamp) <= r.ts_24hr_after_first_engagement)SELECTuser_pseudo_id,SUM(IF(event_name = 'user_engagement', 1, 0)) AS cnt_user_engagement,# ... repeated for all behavior data ...SUM(IF(event_name = 'use_extra_steps', 1, 0)) AS cnt_use_extra_steps,FROMevents_first24hrGROUP BY1
View the notebook for the query used to aggregate and extract the behavioral data. You can use different sets of events for your use case. To view the complete list of events, use the following query:
SELECTevent_name,COUNT(event_name) as event_countFROM`firebase-public-project.analytics_153293282.events_*`GROUP BY 1ORDER BYevent_count DESC
After this we combined the features to ensure our training dataset reflects the intended structure. We had the following columns in our table:
- User ID:
user_pseudo_id
- Label:
churned
- Demographic features
countrydevice_osdevice_language
- Behavioral features
cnt_user_engagementcnt_level_start_quickplaycnt_level_end_quickplaycnt_level_complete_quickplaycnt_level_reset_quickplaycnt_post_scorecnt_spend_virtual_currencycnt_ad_rewardcnt_challenge_a_friendcnt_completed_5_levelscnt_use_extra_stepsuser_first_engagement
At this point, the dataset was ready to train the classification machine learning model in BigQuery ML. Once trained, the model will output a propensity score between churn (churned=1) or return (churned=0) indicating the probability of a user churning based on the training data.
Train classification model
When using the CREATE MODEL statement, BigQuery ML automatically splits the data between training and test. Thus the model can be evaluated immediately after training (see the documentation for more information).
For the ML model, we can choose among the following classification algorithms where each type has its own pros and cons:

Often logistic regression is used as a starting point because it is the fastest to train. The query below shows how we trained the logistic regression classification models in BigQuery ML.
CREATE OR REPLACE MODEL bqmlga4.churn_logregTRANSFORM(EXTRACT(MONTH from user_first_engagement) as month,EXTRACT(DAYOFYEAR from user_first_engagement) as julianday,EXTRACT(DAYOFWEEK from user_first_engagement) as dayofweek,EXTRACT(HOUR from user_first_engagement) as hour,* EXCEPT(user_first_engagement, user_pseudo_id))OPTIONS(MODEL_TYPE="LOGISTIC_REG",INPUT_LABEL_COLS=["churned"]) ASSELECT*FROMbqmlga4.train
We extracted month, julianday, and dayofweek from datetimes/timestamps as one simple example of additional feature preprocessing before training. Using TRANSFORM() in your CREATE MODEL query allows the model to remember the extracted values. Thus, when making predictions using the model later on, these values won’t have to be extracted again. View the notebook for the example queries to train other types of models (XGBoost, deep neural network, AutoML Tables).
Evaluate model
Once the model finished training, we ran ML.EVALUATE to generate precision, recall, accuracy and f1_score for the model:
SELECT*FROMML.EVALUATE(MODEL bqmlga4.churn_logreg)

The optional THRESHOLD parameter can be used to modify the default classification threshold of 0.5. For more information on these metrics, you can read through the definitions on precision and recall, accuracy, f1-score, log_loss and roc_auc. Comparing the resulting evaluation metrics can help to decide among multiple models.Furthermore, we used a confusion matrix to inspect how well the model predicted the labels, compared to the actual labels. The confusion matrix is created using the default threshold of 0.5, which you may want to adjust to optimize for recall, precision, or a balance (more information here).
SELECTexpected_label,_0 AS predicted_0,_1 AS predicted_1FROMML.CONFUSION_MATRIX(MODEL bqmlga4.churn_logreg)

This table can be interpreted in the following way:

Make predictions using BigQuery ML
Once the ideal model was available, we ran ML.PREDICT to make predictions. For propensity modeling, the most important output is the probability of a behavior occurring. The following query returns the probability that the user will return after 24 hrs. The higher the probability and closer it is to 1, the more likely the user is predicted to return, and the closer it is to 0, the more likely the user is predicted to churn.
SELECTuser_pseudo_id,returned,predicted_returned,predicted_returned_probs[OFFSET(0)].prob as probability_returnedFROMML.PREDICT(MODEL bqmlga4.churn_logreg,(SELECT * FROM bqmlga4.train)) #can be replaced with a proper test dataset
Utilize predictions for activation
Once the model predictions are available for your users, you can activate this insight in different ways. In our analysis, we used user_pseudo_id as the user identifier. However, ideally, your app should send back the user_id from your app to Google Analytics. In addition to using first-party data for model predictions, this will also let you join back the predictions from the model into your own data.
- You can import the model predictions back into Google Analytics as a user attribute. This can be done using the Data Import feature for Google Analytics 4. Based on the prediction values you can Create and edit audiences and also do Audience targeting. For example, an audience can be users with prediction probability between 0.4 and 0.7, to represent users who are predicted to be “on the fence” between churning and returning.
- For Firebase Apps, you can use the Import segments feature. You can tailor user experience by targeting your identified users through Firebase services such as Remote Config, Cloud Messaging, and In-App Messaging. This will involve importing the segment data from BigQuery into Firebase. After that you can send notifications to the users, configure the app for them, or follow the user journeys across devices.
- Run targeted marketing campaigns via CRMs like Salesforce, e.g. send out reminder emails.
You can find all of the code used in this blogpost in the Github repository:
What’s next?
Continuous model evaluation and re-training
As you collect more data from your users, you may want to regularly evaluate your model on fresh data and re-train the model if you notice that the model quality is decaying.
Continuous evaluation—the process of ensuring a production machine learning model is still performing well on new data—is an essential part in any ML workflow. Performing continuous evaluation can help you catch model drift, a phenomenon that occurs when the data used to train your model no longer reflects the current environment.
To learn more about how to do continuous model evaluation and re-train models, you can read the blogpost: Continuous model evaluation with BigQuery ML, Stored Procedures, and Cloud Scheduler
More resources
If you’d like to learn more about any of the topics covered in this post, check out these resources:
- BigQuery export of Google Analytics data
- BigQuery ML quickstart
- Events automatically collected by Google Analytics 4
- Qwiklabs: Create ML models with BigQuery ML
Or learn more about how you can use BigQuery ML to easily build other machine learning solutions:
- How to build demand forecasting models with BigQuery ML
- How to build a recommendation system on e-commerce data using BigQuery ML
Let us know what you thought of this post, and if you have topics you’d like to see covered in the future! You can find us on Twitter at @polonglin and @_mkazi_.Thanks to reviewers: Abhishek Kashyap, Breen Baker, David Sabater Dinter.
More Relevant Stories for Your Company

Building a Stronger South Bend through Cloud Computing Education
The city of South Bend, Indiana has announced they are working with Google Cloud to connect 500 local job seekers with no-cost access to Google Cloud Skills Boost through Upskill SB. This initiative will train, upskill, and certify residents in cloud computing skills to create pathways to technical jobs. As companies, nonprofits, and

Why Now Moving to Cloud is Great for Media and Broadcasting Companies
The broadcasting industry has gone through many evolutions since its inception. From linear over-the-air (OTA) to digital & personalized, to standard to ultra high definition, these evolutions were driven by increased demand from viewers who want more choices. The next evolution is happening now, driven by the emergence in cloud

Expect 40 Percent Higher Price-performance than General Purpose VM with Google TAU VMs!
In November 2021, we announced the general availability of Tau VMs. Since then, Google Cloud’s Tau VMs with Google Kubernetes Engine (GKE) have unlocked value for many customers who are now using Tau VMs for their production workloads, such as: Ascend, who achieved over 125% higher performance; Nylas, who gained

Media CDN to Intelligently Deliver Streaming Experiences to Viewers around the World!
The digital media and entertainment industry is experiencing dramatic growth, as audiences migrate to online experiences and content providers seek to deliver new and innovative content. According to The Global Internet Phenomena Report, streaming video accounted for 53.7% of internet bandwidth traffic, up by 4.8% from a year ago. This
