





Scope for Tech Adoption and Advancements in Healthcare are Still High: Google Cloud Research

5700
Of your peers have already read this article.
3:00 Minutes
The most insightful time you'll spend today!
Since the start of the COVID-19 pandemic, there’s been a rapid acceleration of digital transformation across the entire healthcare industry. Telehealth has become a more mainstream and safe way for patients and caregivers to connect. Machine learning modeling has helped speed up innovation and drug discovery. And new levels of integration and data portability have helped enable greater vaccine availability and equitable access to those who need it.
Data has been at the crux of this digital transformation — helping people stay healthy, accelerating life sciences research and delivering more personalized and equitable care. We recently unveiled partial results from our research with The Harris Poll, which revealed that nearly all physicians (95%) believe increased data interoperability will ultimately help improve patient outcomes. Today, we’re unveiling the second part of that research.
In February 2020, we commissioned The Harris Poll to survey 300 physicians in the U.S. about their biggest pain points — this was just before the COVID-19 pandemic strained the entire healthcare system and made us all hyper-aware of the risks we take in going to the hospital. In June 2021, we followed-up with those same questions and more. What it unveiled was just how much COVID-19 reshaped technology’s role in the healthcare field and how it’s changing day-to-day operations for physicians.
Here are some of the highlights:
Healthcare organizations accelerated technological upgrades over the course of the pandemic. After a year shaped primarily by the COVID-19 pandemic, use of telehealth saw substantial YOY growth, jumping nearly threefold from 32% in February 2020 to 90% this year. Forty-five percent of physicians say the COVID-19 pandemic accelerated the pace of their organization’s adoption of technology. In fact, more than 3 in 5 physicians (62%) say the pandemic has forced their healthcare organization to make technology upgrades that normally would have taken years. For example, 48% of physicians would like to have access to telehealth capabilities in the next five years. Before the COVID-19 pandemic, about half of physicians (53%) say their healthcare organization’s approach to the adoption of technology would best be described as “neutral” (i.e., willing to try new technologies only if they have been in the market for awhile or others have tried and recommended them).
Despite the technological leaps this year, most physicians still believe the industry lags behind in technology adoption but recognize the opportunity for technological support and advancement. The majority of physicians don’t view the healthcare industry as a leader when it comes to digital adoption. More than half of physicians describe the healthcare industry as lagging behind the gaming (64%), telecommunications (56%), and financial services industries (53%). However, the healthcare industry is not seen to be trailing as much as it was last year behind retail (54% in 2020; 44% in 2021); hospitality and travel (53% in 2020; 43% in 2021); and the public sector (39% in 2020; 26% in 2021).
Better interoperability alleviates physician burnout, improves health outcomes and speeds up diagnoses. The majority of physicians say increased data interoperability will cut the time to diagnosis for patients significantly (86%) and will ultimately help improve patient outcomes (95%.) In addition to better patient experiences and outcomes, more than half of physicians (54%) believe increased access to data via technology has had a positive impact on their healthcare organization overall. A majority believe that technology can alleviate the likelihood of physician “burn-out” (57%) and that efficient tools help decrease friction and stress (84%). And, as a result, 6 in 10 physicians say access to better technology and clinical data systems would allow them to have better work/life balance (60%) and that better access to/more complete patient data would reduce administrative burdens (61%). It is therefore not surprising that nearly 9 in 10 physicians (89%) say they are increasingly looking for ways to bring together all patient data into a single place for a more complete view of health.
Familiarity with new Department of Health and Human Services (DHHS) interoperability rules grows, and many physicians are in favor. Most physicians (74%) say they have at least heard of the new DHHS rules (launched in 2019) to improve the interoperability of electronic health information. This is a clear rise from 2020 (64%), but deeper knowledge is fairly low. Only 30% of physicians say they are somewhat or very familiar with the new rules (though, again, this is a rise from 2020, when only 18% said they were very/somewhat familiar). Similar to in 2020, among those who have heard of the new rules, nearly half are in favor (48% in 2021; 45% in 2020) but a similar proportion remain unsure (46% in 2021; 50% in 2020). And like in 2020, by far the top potential benefit of the rules is thought to be forcing EHRs to be more interoperable with other systems (70%).
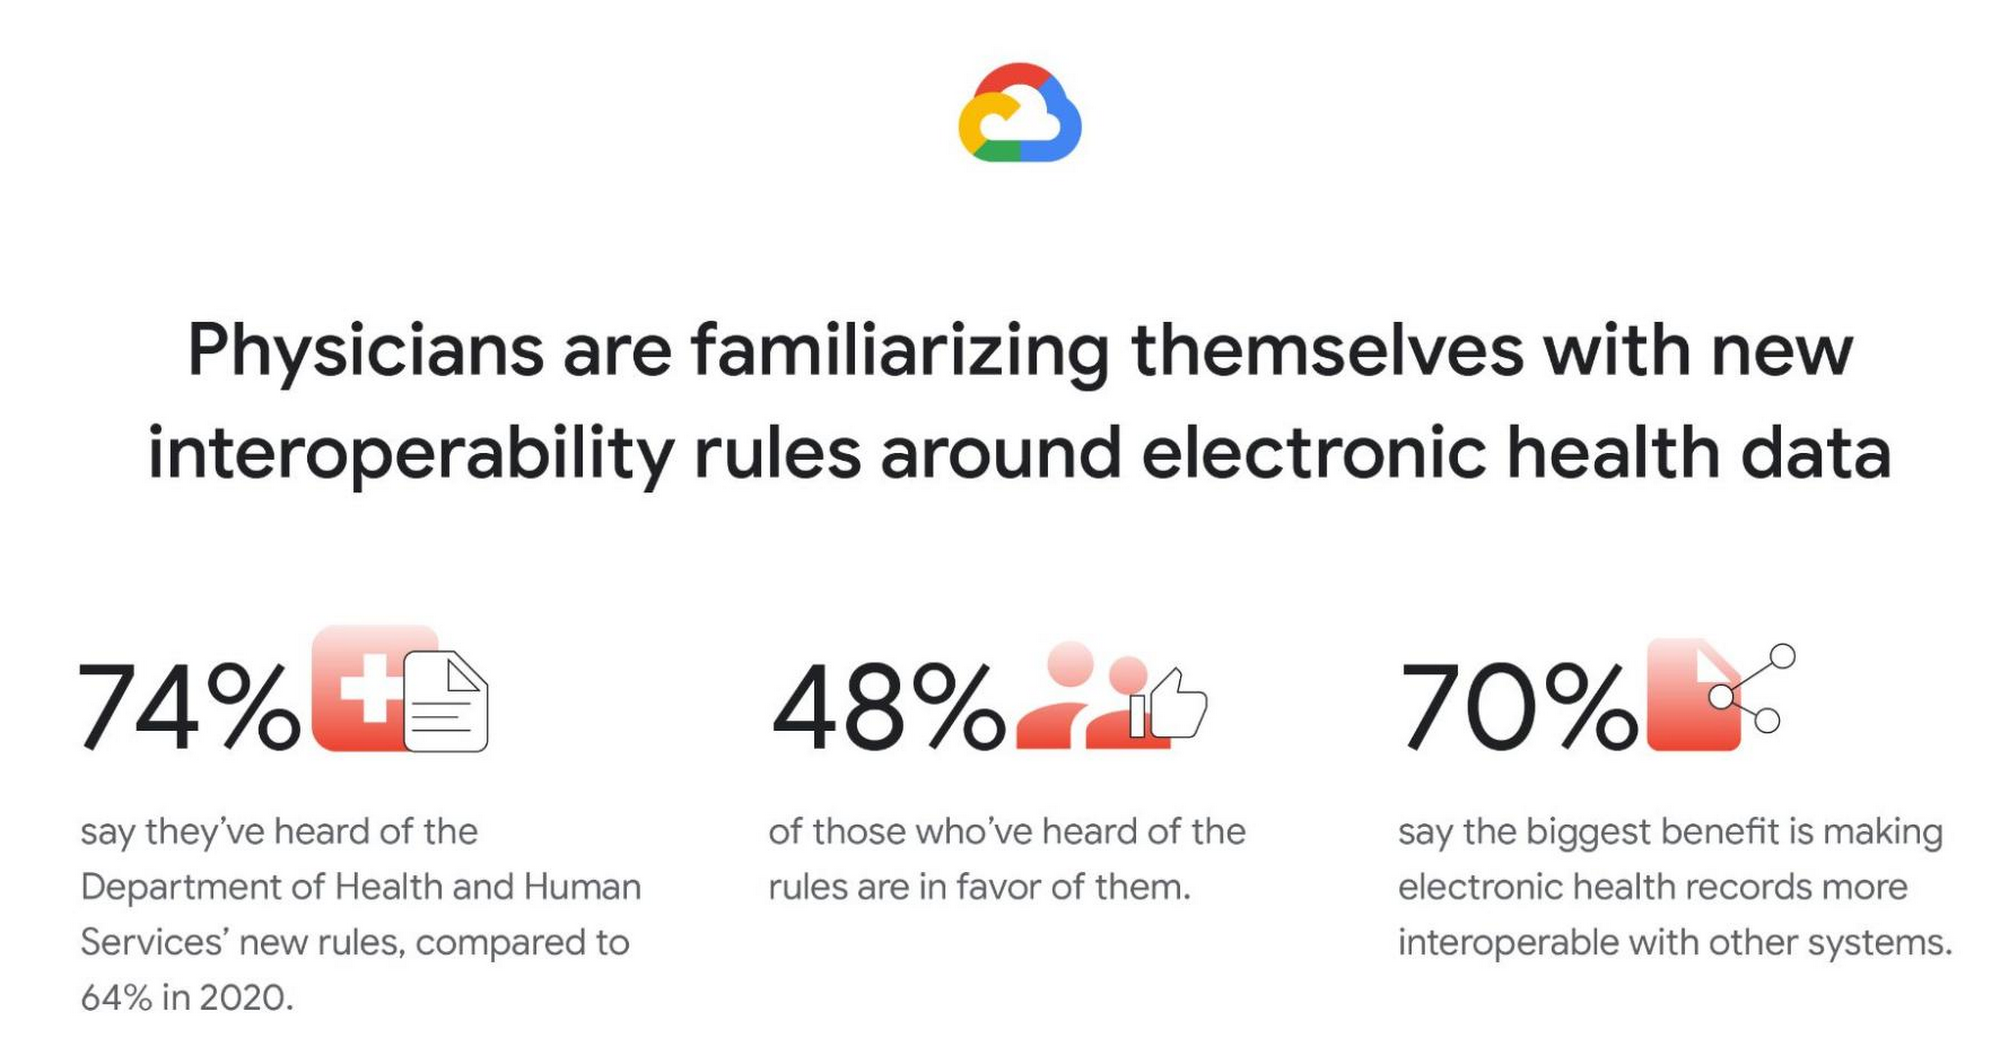
Google was founded on the idea that bringing more information to more people improves lives on a vast scale. In healthcare, that means creating tools and solutions that make data available in real time to help streamline operations and improve quality of care and patient outcomes. For example, our recently announced Healthcare Data Engine makes it easier for healthcare and life sciences leaders to make smart real-time decisions through clinical, operational, & groundbreaking scientific insights. To find out more about the Healthcare Data Engine, click here.
Survey methodology: The 2021 survey was conducted online within the United States by The Harris Poll on behalf of Google Cloud from June 9 – 29, 2021 among 303 physicians who specialize in Family Practice, General Practice, or Internal Medicine, who treat patients, and are duly licensed in the state they practice. The 2020 survey was conducted from February 18 – 25, 2020 among 300 physicians who specialize in Family Practice, General Practice, or Internal Medicine, who treat patients, and are duly licensed in the state they practice. Physicians practicing in Vermont were excluded from the research. This online survey is not based on a probability sample and therefore no estimate of theoretical sampling error can be calculated. For complete survey methodology, including weighting variables and subgroup sample sizes, please contact press@google.com.
How to Use Data to Tell Compelling Stories and Win New Deals

4501
Of your peers have already read this article.
2:30 Minutes
The most insightful time you'll spend today!
A picture is worth a thousand words–especially at work. The data we present every day is what helps us drive decision-making in the workplace. But understanding how to visualize a story can be difficult if you’re left staring at numbers sitting stagnant in rows or columns within a spreadsheet.
This is where visualization with charts and reports becomes critical. Let’s say your team needs to understand global sales trends. If you have a waterfall chart that shows regional contribution to total revenue or a scatter plot that shows individual salesperson performance, it’s much easier to spot patterns, draw insights, and make informed recommendations. The same goes for analyzing travel expenses.
In Google Sheets, we have several built-in tools that make it easy to create and share useful charts and reports so that you can quickly visualize data (without having to leave the spreadsheet). Follow these tips to showcase your data in Sheets and influence decisions.
1. Pick the most compelling way to visualize your data.
Perhaps just as important as the data you reference is the way in which you present it. Charts are the basic building blocks for data visualization and can take many forms–from bar charts to line graphs to scatter plots. There are more than 30 chart types to choose from in Sheets, and we’re constantly adding more ways to express your data. Here are a few we recommend:
- To draw attention to a key metric or KPI, try the brand new scorecard chart. For example, you can show the total sales number for your organization’s top-selling product, and even call out percentage increase or decrease over time.
- To illustrate how values add to or subtract from a starting value, try a waterfall chart. For example, show how your product sales and restocking efforts led to a net decrease in inventory from last quarter to this quarter.
- To represent different data series using lines and bars, try a combo chart. For example, you can show revenue in bars and profit margins in a line across the same chart, giving you a more complete picture of your organization’s financial health.
If you’re unsure how to best present your data, Google’s built-in machine learning can help you choose the right visualization—Sheets intelligently suggests charts for you. Simply highlight data you would like to visualize, click the chart button, and then select one of the suggested charts. According to our internal data, more than 1.5 million charts are inserted into Sheets each week based on intelligent recommendations.
Note: Once you have a chart inserted into Sheets, you may want to control the look and feel. We recently made it possible to click directly on data labels, chart titles, or legends and drag to reposition them. You can also easily delete these elements using the delete or backspace keys, if you want to make other data points stand out. We’re exploring even more ways to customize charts—stay tuned.
2. Be sure to tell a complete story.
Data really comes to life when you put several charts and tables together into a report or dashboard. Going back to our sales data example, an individual line graph showing revenue over time gives you quick insight into the general sales trend for your organization (hopefully, up and to the right!). But when you surround that line graph with other charts and tables–like a pie chart showing total revenue breakdown by-product, or a stacked bar chart comparing revenue driven by each sales team–you can tell a more complete story.
If you do build reports featuring multiple charts, there are ways that Sheets can help you organize and format them more quickly. Earlier this year, we made it easier to align, size, and position objects within your spreadsheets so you can quickly put several charts together. We also recently added themes, which let you alter the look and feel of an entire spreadsheet—including charts, pivot tables, and cells—to ensure a consistent look and feel across the elements in your report. To apply a preset theme, select Format > Theme and choose the right option. Faster formatting can mean faster reporting.
3804
Of your peers have already watched this video.
28:27 Minutes
The most insightful time you'll spend today!
Power your business with search and AI in G Suite
More than ever, businesses are dealing with major challenges like increased competition, data and information overload, and processes slowing people down.
To overcome these challenges, businesses need to move faster, harness data and resources and remove friction from getting things done.
We know that countless hours are wasted every day by information workers doing mundane tasks that distract and take time away from the creative knowledge work where they can uniquely add value. In 2019, we commissioned a total economic impact analysis with Forrester Research, and based on a number of interviews with our customers, we have learned that G Suite* is delivering value in four key ways, revenue growth, employee efficiency, risk mitigation, and IT cost savings.
The numbers are all based on a composite customer with 20,000 users generating $3 billion a year in revenue. For highly collaborative employees, the time savings of mundane tasks with G Suite is huge. Almost an extra month’s worth of time every year, with 20% of that time reallocated towards value-added tasks that are important to your business.
In this video, find out how G Suite can help with employee efficiency, saving people time, boosting productivity, and reducing frustration.
(G Suite* is now Google Workspace)
5165
Of your peers have already watched this video.
14:00 Minutes
The most insightful time you'll spend today!
How Google Workspace Helps Manage, Govern and Protect Sensitive Data
The shift towards a hybrid work style and trends accelerated by the pandemic has resulted in data deluge. With companies and individuals sharing increasingly large volumes of information and collaborating with internal and external stakeholders, the need for innovations for higher security also escalates. View this video to learn how Google Workspace approaches security across content lifecycle from client-side encryption updates, data loss prevention, Google Vault, data regions, labels, and more!
Google Cloud Accelerates Financial Organizations’ Journey towards Digital Transformation

10468
Of your peers have already read this article.
2:00 Minutes
The most insightful time you'll spend today!
When I reflect back on the past year and the pandemic, I’m struck by how the reliance on remote work and operations has changed the fundamentals of business forever. For the financial services industry, this rings particularly true. Many conversations I’m having right now with organizations revolve around embracing a transformation cloud, and thinking of cloud computing not just as an infrastructure decision, but also as the locus for transformation throughout the company.
Today, as we welcome the industry to our Financial Services Summit, we’ll demonstrate just how Google Cloud accelerates a financial organization’s digital transformation through app and infrastructure modernization, data democratization, people connections, and trusted transactions. We hope you’ll join us.
How we’re helping financial services firms build their transformation clouds
At Google Cloud, we continue to focus on areas where we can bring the best of our capabilities to banking, capital markets, insurance, and payments customers around the world. Our work with financial services industry customers has given us a deep understanding of the real-world, specific use cases that matter most to them. This groundwork led us to engineer products and solutions that are open and flexible, not ones that force them to rip out existing investments in ERP or other early IaaS cloud implementations.
It’s why we’ve engineered solutions such as Lending DocAI, Open Banking with Apigee, and Datashare for financial services to help transform the industry. These solutions were created with our customers’ security and compliance top-of-mind and are built at the intersection of user-optimized experience, technology, and sovereignty.
At their core, financial institutions want to drive growth, reduce costs, mitigate risk, stay compliant, and increase efficiency. As a result, when we partner with them on their transformation journeys, we consider three essential focus areas:
- Enabling the human experience and connected interactions
- Building an open and intelligent data foundation for better insights
- Providing the most trusted and secure cloud in the industry
Enabling humans and connected interactions
A company’s transformation is about more than technology; people and culture ultimately drive change. HSBC, for example, recognized its business users would benefit from guided answers to common questions around risk policy compliance, and turned to Google Cloud to leverage AI and machine learning bots to assist employees, ease the burden on policy experts, and improve the user experience. Using Dialogflow, a core component of Contact Center AI, HSBC was able to build a conversational platform that quickly and accurately addresses user needs at scale.
Another example is Equifax, which used Google Workspace to support collaboration not only internally between employees, but also externally with customers. Customers can use Google Cloud solutions for financial services to build these sorts of technology-enabled human interactions quickly and easily—supporting organizational change at scale.
Building an open and intelligent data foundation for smarter, faster insights
The real impact of Google Cloud solutions for financial services comes when the whole company has access to the right information at the right time, and can act more intelligently on that data. Our solutions help businesses safely leverage their data and get a complete 360-degree view of their customers’ information, which can often be scattered across multiple systems (CRM, lending, credit, etc.). This helps financial institutions improve the overall customer experience—and sometimes even develop new products quickly.
Indeed, all financial institutions are looking for ways to grow revenue and reduce expenses, and data can be a critical ingredient to doing both effectively. As daily transactions rise, so does the volume and complexity of data. But to implement new customer experience innovations (and new revenue streams), financial institutions must first capture data effectively. This is why AXA Switzerland, for example, uses real-time analytics on Google Cloud to gain cross-industry insights about future trends and customer preferences.
Financial services organizations also need the confidence of building on a platform that provides choice, flexibility, and agility to move fast. It’s why we have an open cloud approach that allows Google Cloud services to run in different physical locations such as on-premises, other public clouds, and the edge. Customers can also harness the power of data and AI through our open APIs, machine-learning services, and analytics engines on any major cloud platform. This is why companies like Macquarie Bank are taking advantage of Google Cloud’s open, hybrid architecture to modernize and empower its developers.
Compliant and secure to address risk and regulatory needs
As a highly regulated industry, financial services is focused on security and compliance, risk and regulations, and fraud detection and prevention. Google Cloud offers unique capabilities to earn customers’ trust as part of our continuing work to be the most trusted cloud in the industry. Google Cloud provides a secure foundation that you can verify and independently control. Our cloud technology reduces risk and data loss, because it is built on comprehensive zero-trust architecture. Finally, we offer a shared-fate model built on best practices in risk management via automation, guidance, and insurance. This is why customers like BBVA have confidence anywhere their systems may operate.
On the regulatory front, global legislators and regulators continue to focus on the stability of the industry that only a decade ago went through one of the biggest liquidity crises in history. With this oversight comes strong expectations of risk mitigation. Google Cloud offers a single, global set of controls, reviewed by financial institutions and regulators around the world, and verified in collaborative audits—making compliance simpler and less costly for our customers.
Finally, Google Cloud allows financial services firms to operate confidently with advanced security tools that help protect data, applications, and infrastructure, as well as their customers from fraudulent activity, spam, and abuse. We help protect your data against threats, using the same infrastructure and security services we use for our own operations, ensuring you never have to trade-off between ease of use and security. Google Cloud encrypts data at-rest and in-transit. And we now also offer the ability to encrypt data-in use, while it’s being processed for customer VM and container workloads.
Let us help you with your transformation cloud journey
We’ve seen leading financial services companies embrace Google Cloud to help them move beyond infrastructure toward the next phase of their cloud evolution. This is an era where no company is better positioned to lead than Google Cloud, and we’re excited to help you with your journey.
Learn more about Google Cloud for financial services.
5888
Of your peers have already watched this video.
1:30 Minutes
The most insightful time you'll spend today!
FFF Enterprises See 80% Improvements in Speed at Lower Cost by Moving SAP Data to Google Cloud
FFF Enterprises, a pharmaceutical distributor of lifesaving biopharma products, vaccines and plasma products deployed SAP on Google Cloud to leverage its ability to scale server demands, reduce costs and improve speed and performance. Learn how the migration helps FFF empower healthcare to care!
More Relevant Stories for Your Company

How Barilla Created a Social Media Style App to Improve Efficiency
Google Cloud Results Replaced conflicting, time-consuming paper logs with a near real-time, transparent appScaled rapidly and easily to accommodate new teams thanks to Google App EngineEnables photographic and video communication to replace confusing textNew factory solution rolled out in just 15 days In 1877, Pietro Barilla set up a small

16 Popular Chrome Insider Posts to Help You Simplify Browser Deployments
We launched the Chrome Insider blog in 2019 to share tips and best practices with IT admins so they could better deploy, manage, and secure Chrome browser. Since then, the series has covered everything from supporting legacy browsers to protecting enterprise credentials to simplifying deployments. To make it even easier




How a Furniture Retailer Found a Cool Way to Innovate Every Day and Beat Competition
MADE.COM is a London-based company that designs and retails homewares and furniture online, and across a network of experiential showrooms in Europe. Founded by serial entrepreneur Ning Li and Brent Hoberman, with Julien Callède and Chloe Macintosh in 2010, the company works with independent designers to create world-class furniture for

New ways Google Workspace works with tools you already use
Looking back on 2020, it’s clear that the ways we work have rapidly transformed—from the rise of remote work and increasingly digitized processes, to balancing time across work and personal responsibilities. But one thing hasn’t changed—businesses still rely on a staggering number of applications to get work done. Working from
