





Recommendations for Modelling SAP Data inside BigQuery

8433
Of your peers have already read this article.
4:00 Minutes
The most insightful time you'll spend today!
Over the past few years, many organizations have experienced the benefits of migrating their SAP solutions to Google Cloud. But this migration can do more than reduce IT maintenance costs and make data more secure. By leveraging BigQuery, SAP customers can complement their SAP investments and gain fresh insights by consolidating enterprise data and easily extending it with powerful datasets and machine learning from Google.
BigQuery is a leading cloud data warehouse, fully managed and serverless, and allows for massive scale, supporting petabyte-scale queries at super-fast speeds. It can easily combine SAP data with additional data sources, such as Google Analytics or Salesforce, and its built-in machine learning lets users operationalize machine learning models using standard SQL — all at a comparatively low cost.
If your SAP-powered organization is looking to supercharge its analytics with the strength of BigQuery, read on for considerations and recommendations for modeling with SAP data. These guidelines are based on our real-world implementation experience with customers and can serve as a roadmap to the analytics capabilities your business needs.
Considerations for data replication
Like most technology journeys, this one should start with a business objective. Keeping your intended business value and goals in mind is critical to making the right decisions in the early steps of the design process.
When it comes to replicating the data from an SAP system into BigQuery, there are multiple ways to do it successfully. Decide which method will work best for your organization by answering these questions:
- Does your business need real-time data? Will you need to time travel into past data?
- Which external datasets will you need to join with the replicated data?
- Are the source structures or business logic likely to change? Will you be migrating the SAP source systems any time soon? For instance, will you be moving from SAP ECC to SAP S/4HANA?
You’ll also need to determine whether replication should be done on a table-by-table basis or whether your team can source from pre-built logic. This decision, along with other considerations such as licensing, will influence which replication tool you should use.
Replicating on a table-by-table basis
Replicating tables, especially standard tables in their raw form, allows sources to be reused and ensures more stability of the source structure and functional output. For example, the SAP table for sales order headers (VBAK) is very unlikely to change its structure across different versions of SAP, and the logic that writes to it is also unlikely to change in a way that affects a replicated table.
Something else to consider: Reconciliation between the source system and the landing table in BigQuery is linear when comparing raw tables, which helps avoid issues in consolidation exercises during critical business processes, such as period-end closing. Since replicated tables aren’t aggregated or subject to process-specific data transformation, the same replicated columns can be reused in different BigQuery views. You can, for instance, replicate the MARA table (the material master) once and use it in as many models as needed.
Replicating pre-built logic
If you replicate pre-built models, such as those from SAP extractors or CDS views, you don’t need to build the logic in BigQuery, since you’re using existing logic. Some of these extraction objects have embedded delta mechanisms, which may complement a replication tool that can’t handle deltas. This will save initial development time, but it can also lead to challenges if you create new columns, or if customizations or upgrades change the logic behind the extraction.
It’s also important to note that different extraction processes may transform and load the same source columns multiple times, which creates redundancy in BigQuery and can lead to higher maintenance needs and costs. However, replicating pre-built models may still be a good choice, since doing so can be especially useful for logic that tends to be immutable, such as flattening a hierarchy, or logic that is highly complex.
How you approach replication will also depend on your long-term plans and other key factors — for example, the availability (and curiosity) of your developers, and the time or effort they can put into applying their SQL knowledge to a new data warehouse.
With either replication approach, bear in mind when designing your replication process that BigQuery is meant to be an append-always database — so post-processing of data and changes will be required in both cases.
Processing data changes
The replication tool you choose will also determine how data changes are captured (known as CDC – change data capture). If the replication tool allows for it (for example as SAP SLT does) the same patterns described in the CDC with BigQuery documentation also apply to SAP data.
Because some data, like transactions, are known to be less static than others (e.g., master data), you need to decide what should be scanned in real time, what will require immediate consistency, and what can be processed in batches to manage costs. This decision will be based on the reporting needs from the business.
Consider the SAP table BUT000, containing our example master data for business partners, where we have replicated changes from an SAP ERP system:
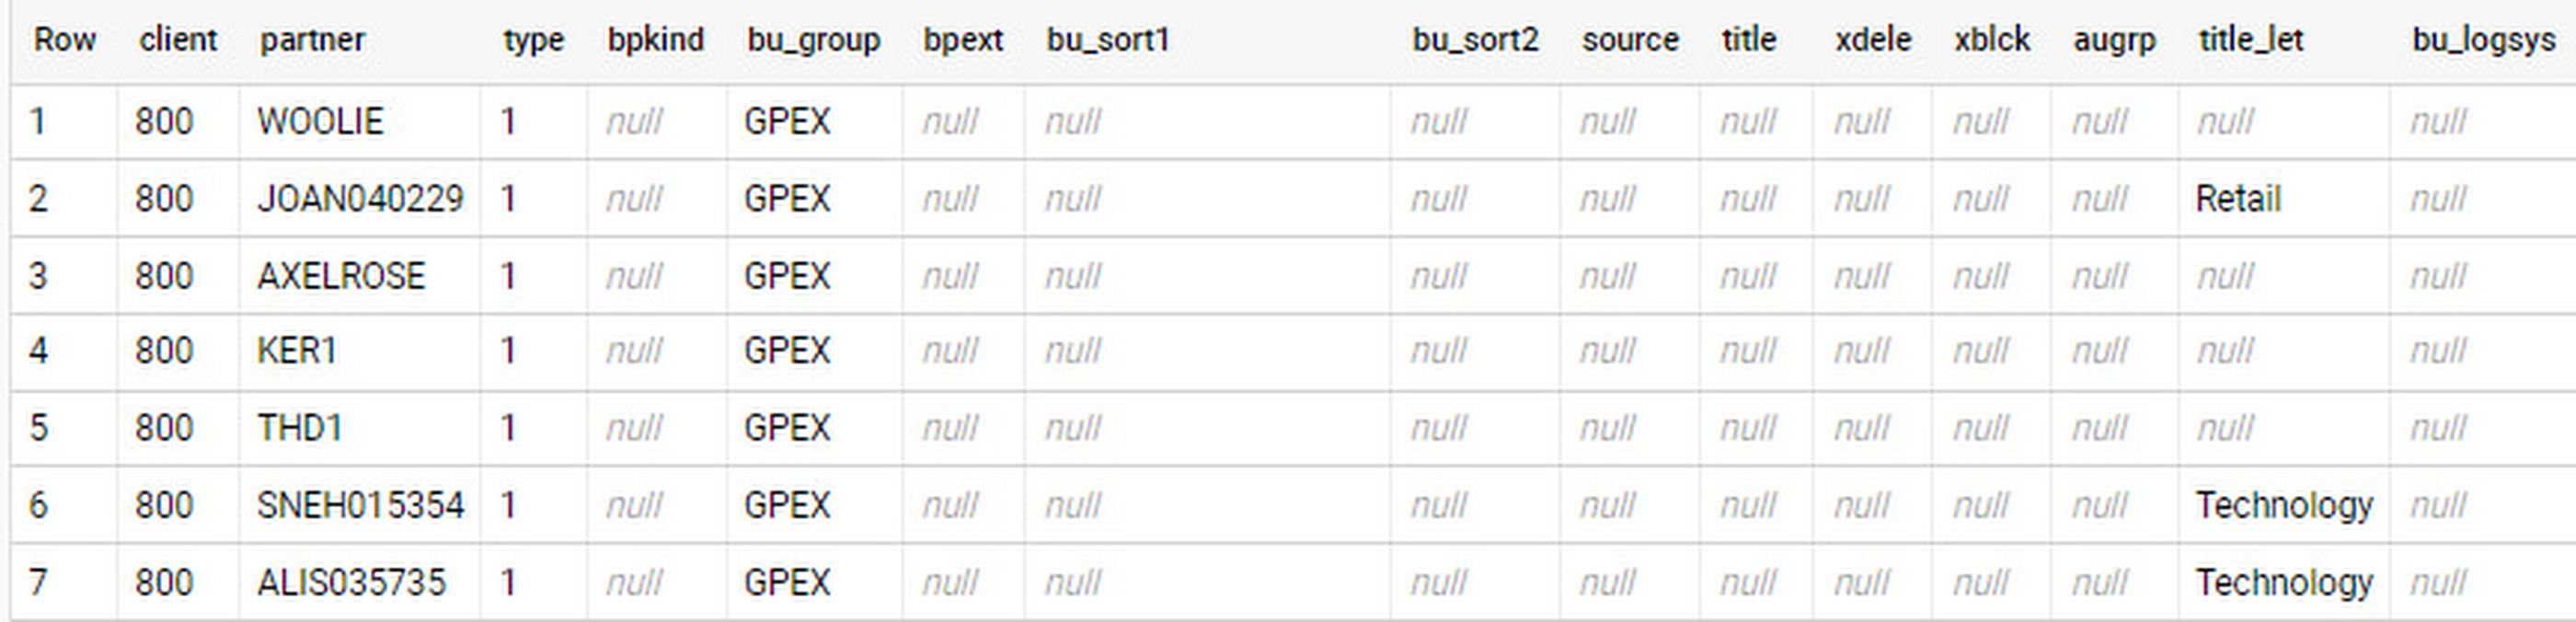
In an append-always replication in BigQuery, all updates are received as new records. For example, deleting a record in the source will be represented as a new record in BigQuery with a deletion flag. This applies to whether the records are coming from raw tables like BUT000 itself or pre-aggregated data, as from a BW extractor or a CDS view.
Let’s take a closer look at data coming particularly from the partners “LUCIA” and “RIZ”. The operation flag tells us whether the new record in BigQuery is an insert (I), update (U) or deletion (D), while the timestamps help us identify the latest version of our business partner.
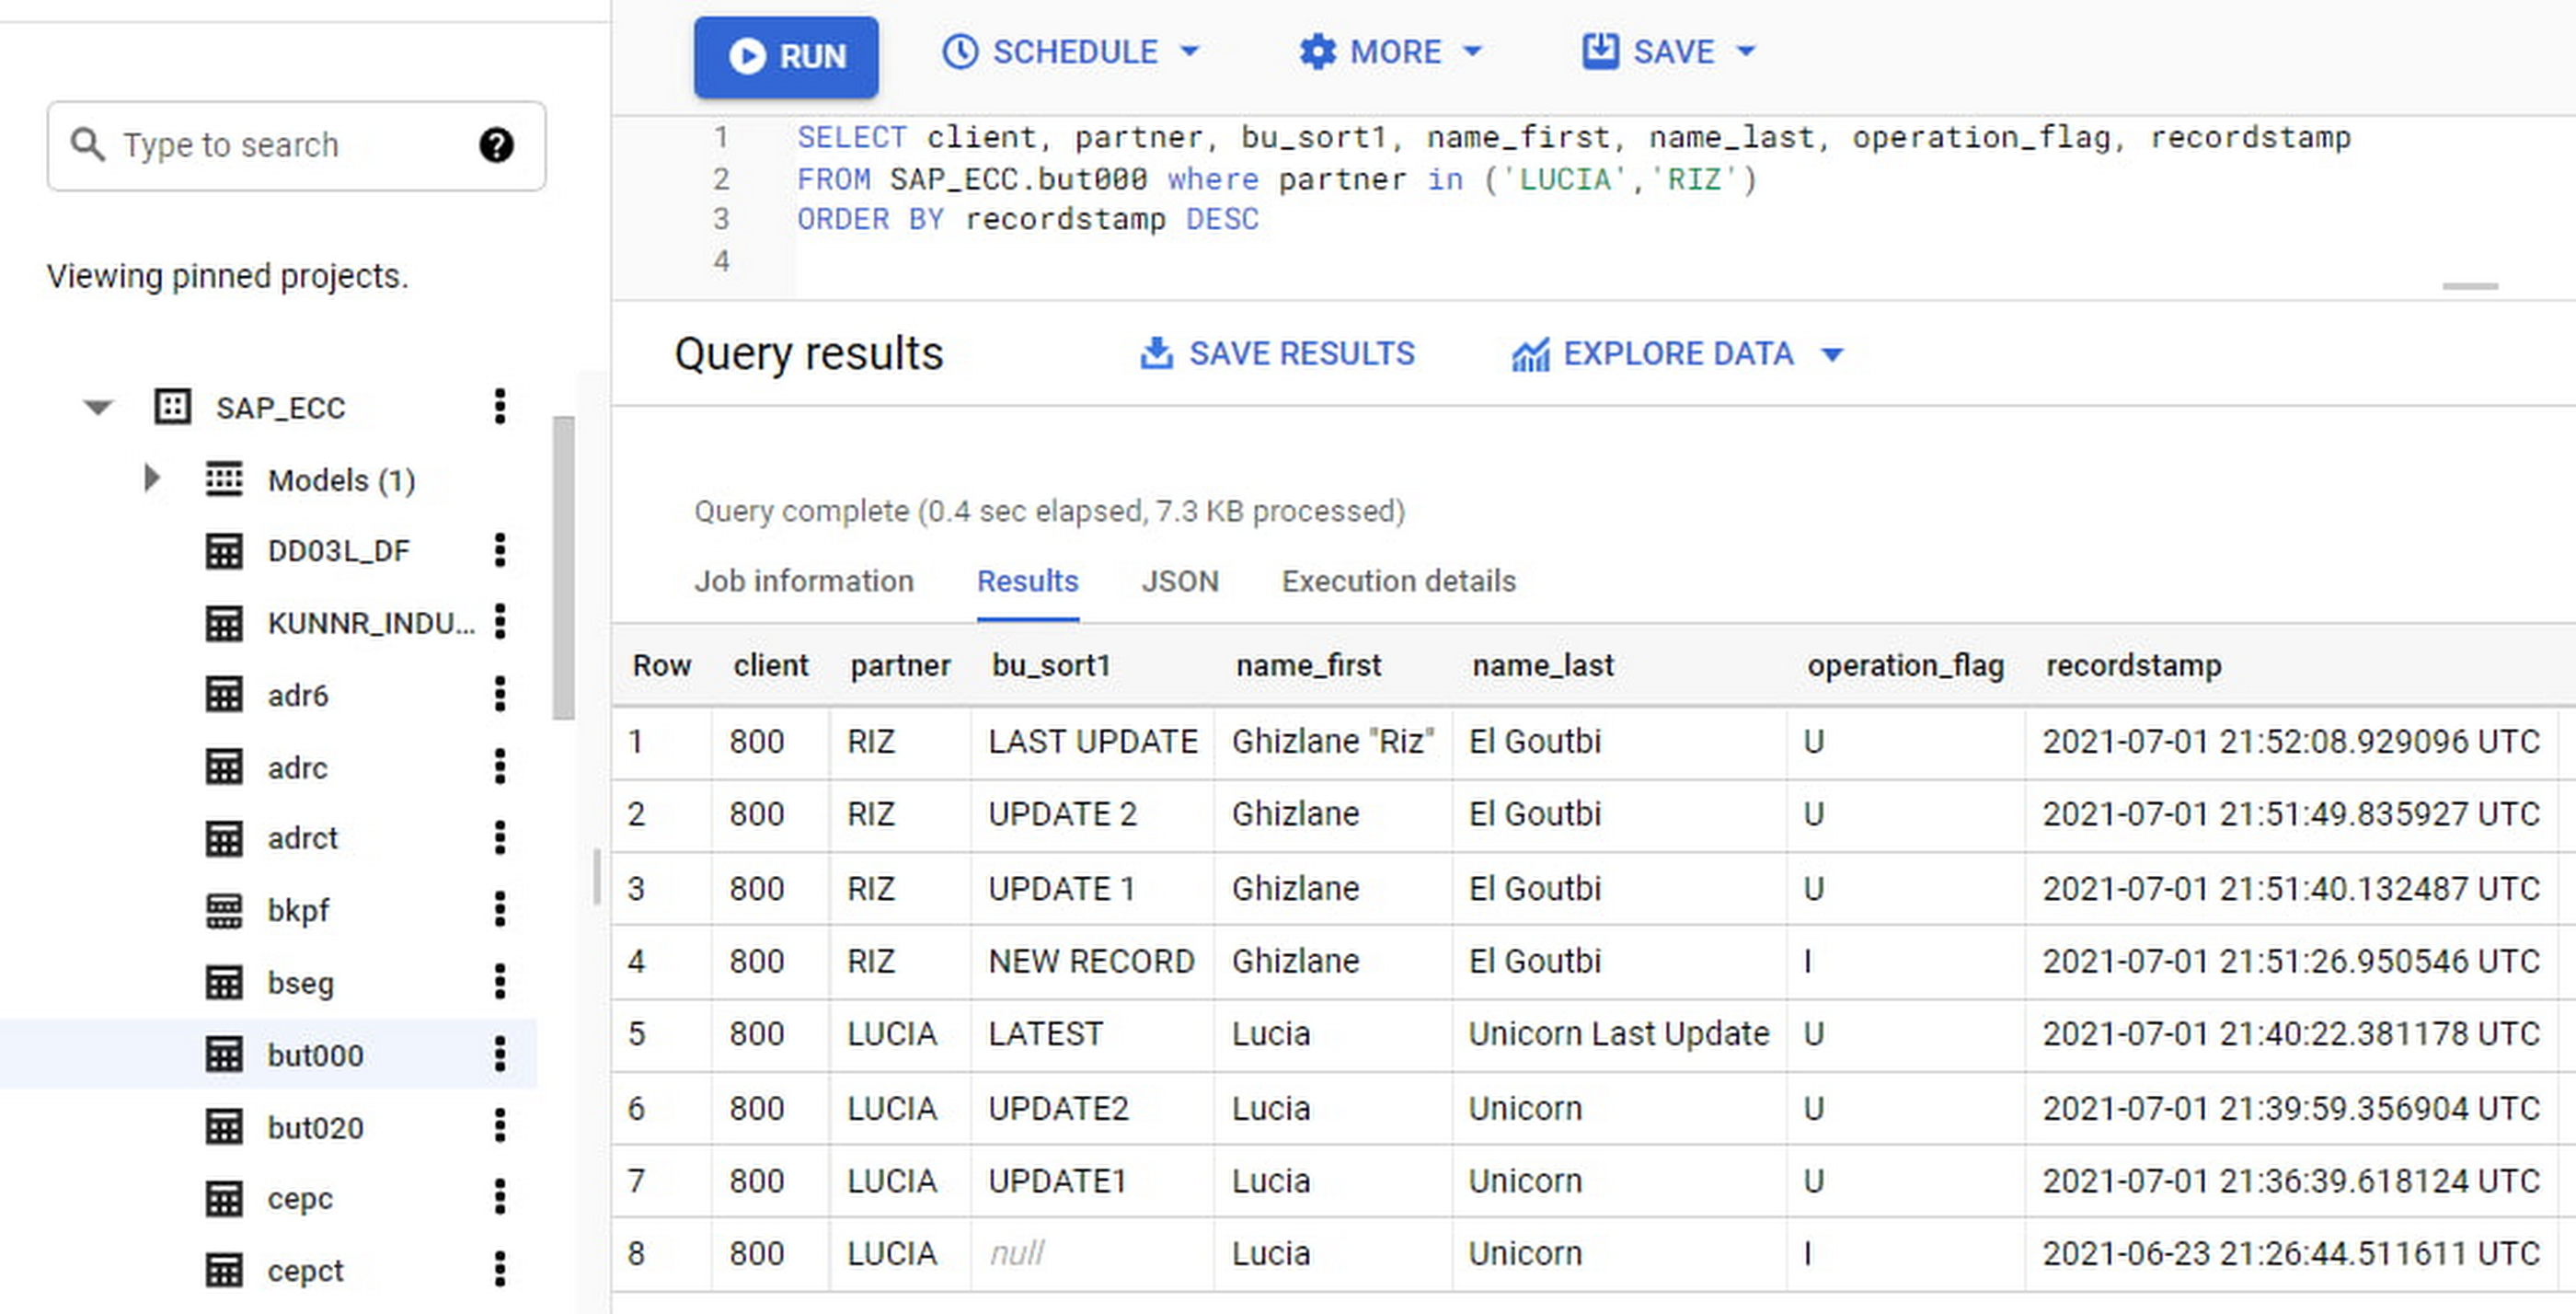
If we want to find the latest updated record for the partners LUCIA and RIZ, this is what the query would look like:
SELECT partner,ARRAY_AGG(i1 ORDER BY i1.recordstamp DESC LIMIT 1) AS rowFROM SAP_ECC.but000 i1WHERE partner in ('LUCIA','RIZ')GROUP BY partner
With the following result:
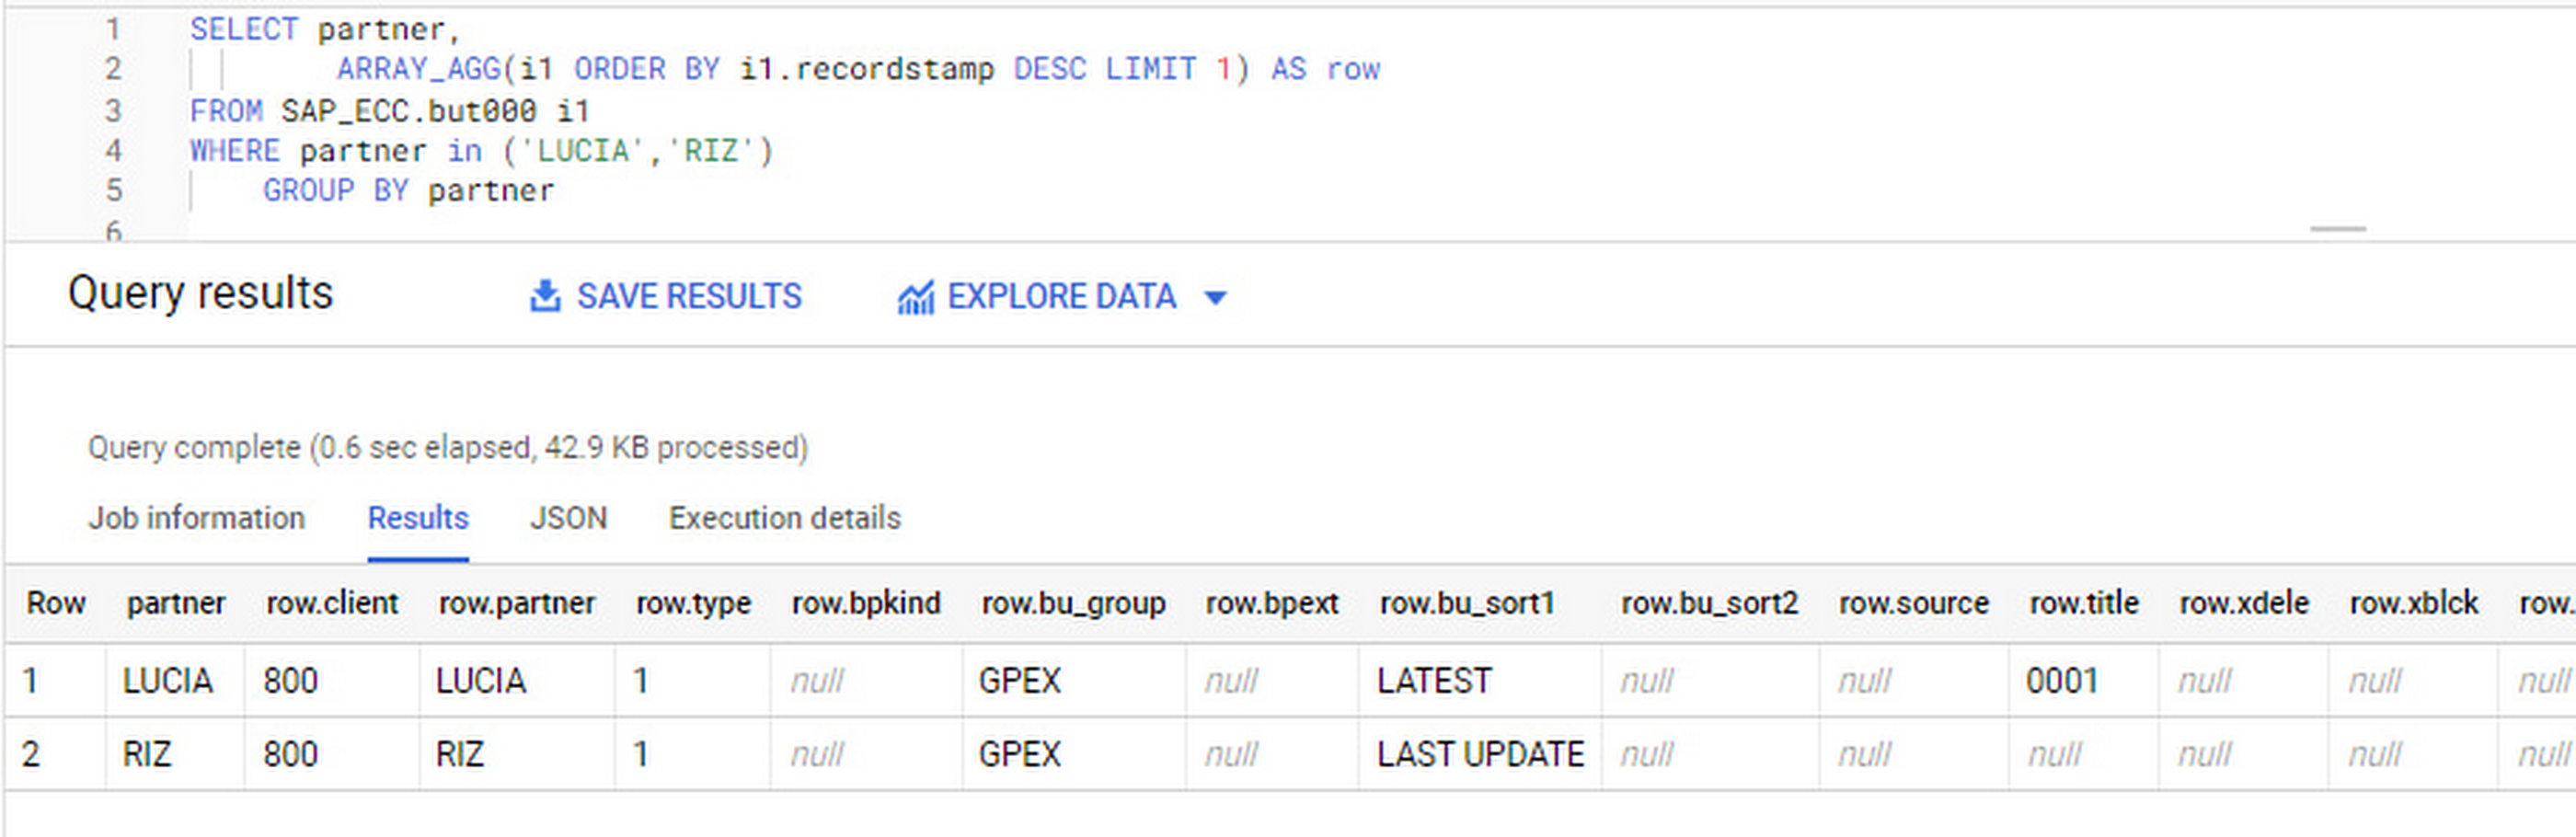
After identifying stale records for “LUCIA” and “RIZ” business partners, we can proceed to deleting all stale records for “LUCIA” if we do not want to retain the history. In this example, we are using a different table to which the same replication has been done, for the purpose of comparison and to check that all stale records have been deleted for the selection made and that we only kept last updated records. For example:
DELETE SAP_HANA.but000 i1WHEREi1.recordstamp < TIMESTAMP_SUB(CURRENT_TIMESTAMP(), INTERVAL 3 HOUR) ANDi1.recordstamp < (SELECT MAX(recordstamp) FROM SAP_HANA.but000 i2WHEREi1.partner = i2.partnerand partner="LUCIA")
You can also use the following query to retrieve stale records for “LUCIA” partner before moving forward with deletion
SELECT partner, operation_flag, recordstamp FROM SAP_HANA.but000 i1WHEREi1.recordstamp < TIMESTAMP_SUB(CURRENT_TIMESTAMP(), INTERVAL 3 HOUR)ANDi1.recordstamp < (SELECT MAX(recordstamp) FROM SAP_HANA.but000 i2WHEREi1.partner = i2.partnerand partner="LUCIA")
Which produces all of the records, except the latest update:

Partitioning and clustering
To limit the number of records scanned in a query, save on cost and achieve the best performance possible, you’ll need to take two important steps: determine partitions and create clusters.
Partitioning
A partitioned table is one that’s divided into segments, called partitions, which make it easier to manage and query your data. Dividing a large table into smaller partitions improves query performance and controls costs because it reduces the number of bytes read by a query.
You can partition BigQuery tables by:
- Time-unit column: Tables are partitioned based on a “timestamp,” “date,” or “datetime” column in the table.
- Ingestion time: Tables are partitioned based on the timestamp recorded when BigQuery ingested the data.
- Integer range: Tables are partitioned based on an integer column.
Partitions are enabled when the table is created, as in the example below. A great tip is to always include the partition filter as shown on the left-hand side of the query.

Clustering
Clustering can be created on top of partitioned tables by applying the fields that are likely to be used for filtering. When you create a clustered table in BigQuery, the table data is automatically organized based on the contents of one or more of the columns in the table’s schema. The columns you specify are then used to colocate related data.
Clustering can improve the performance of certain query types — for example, queries that use filter clauses or that aggregate data. It makes a lot of sense to use them for large tables such as ACDOCA, the table for accounting documents in SAP S/4HANA. In this case, the timestamp could be used for partitioning, and common filtering fields such as the ledger, company code, and fiscal year could be used to define the clusters.
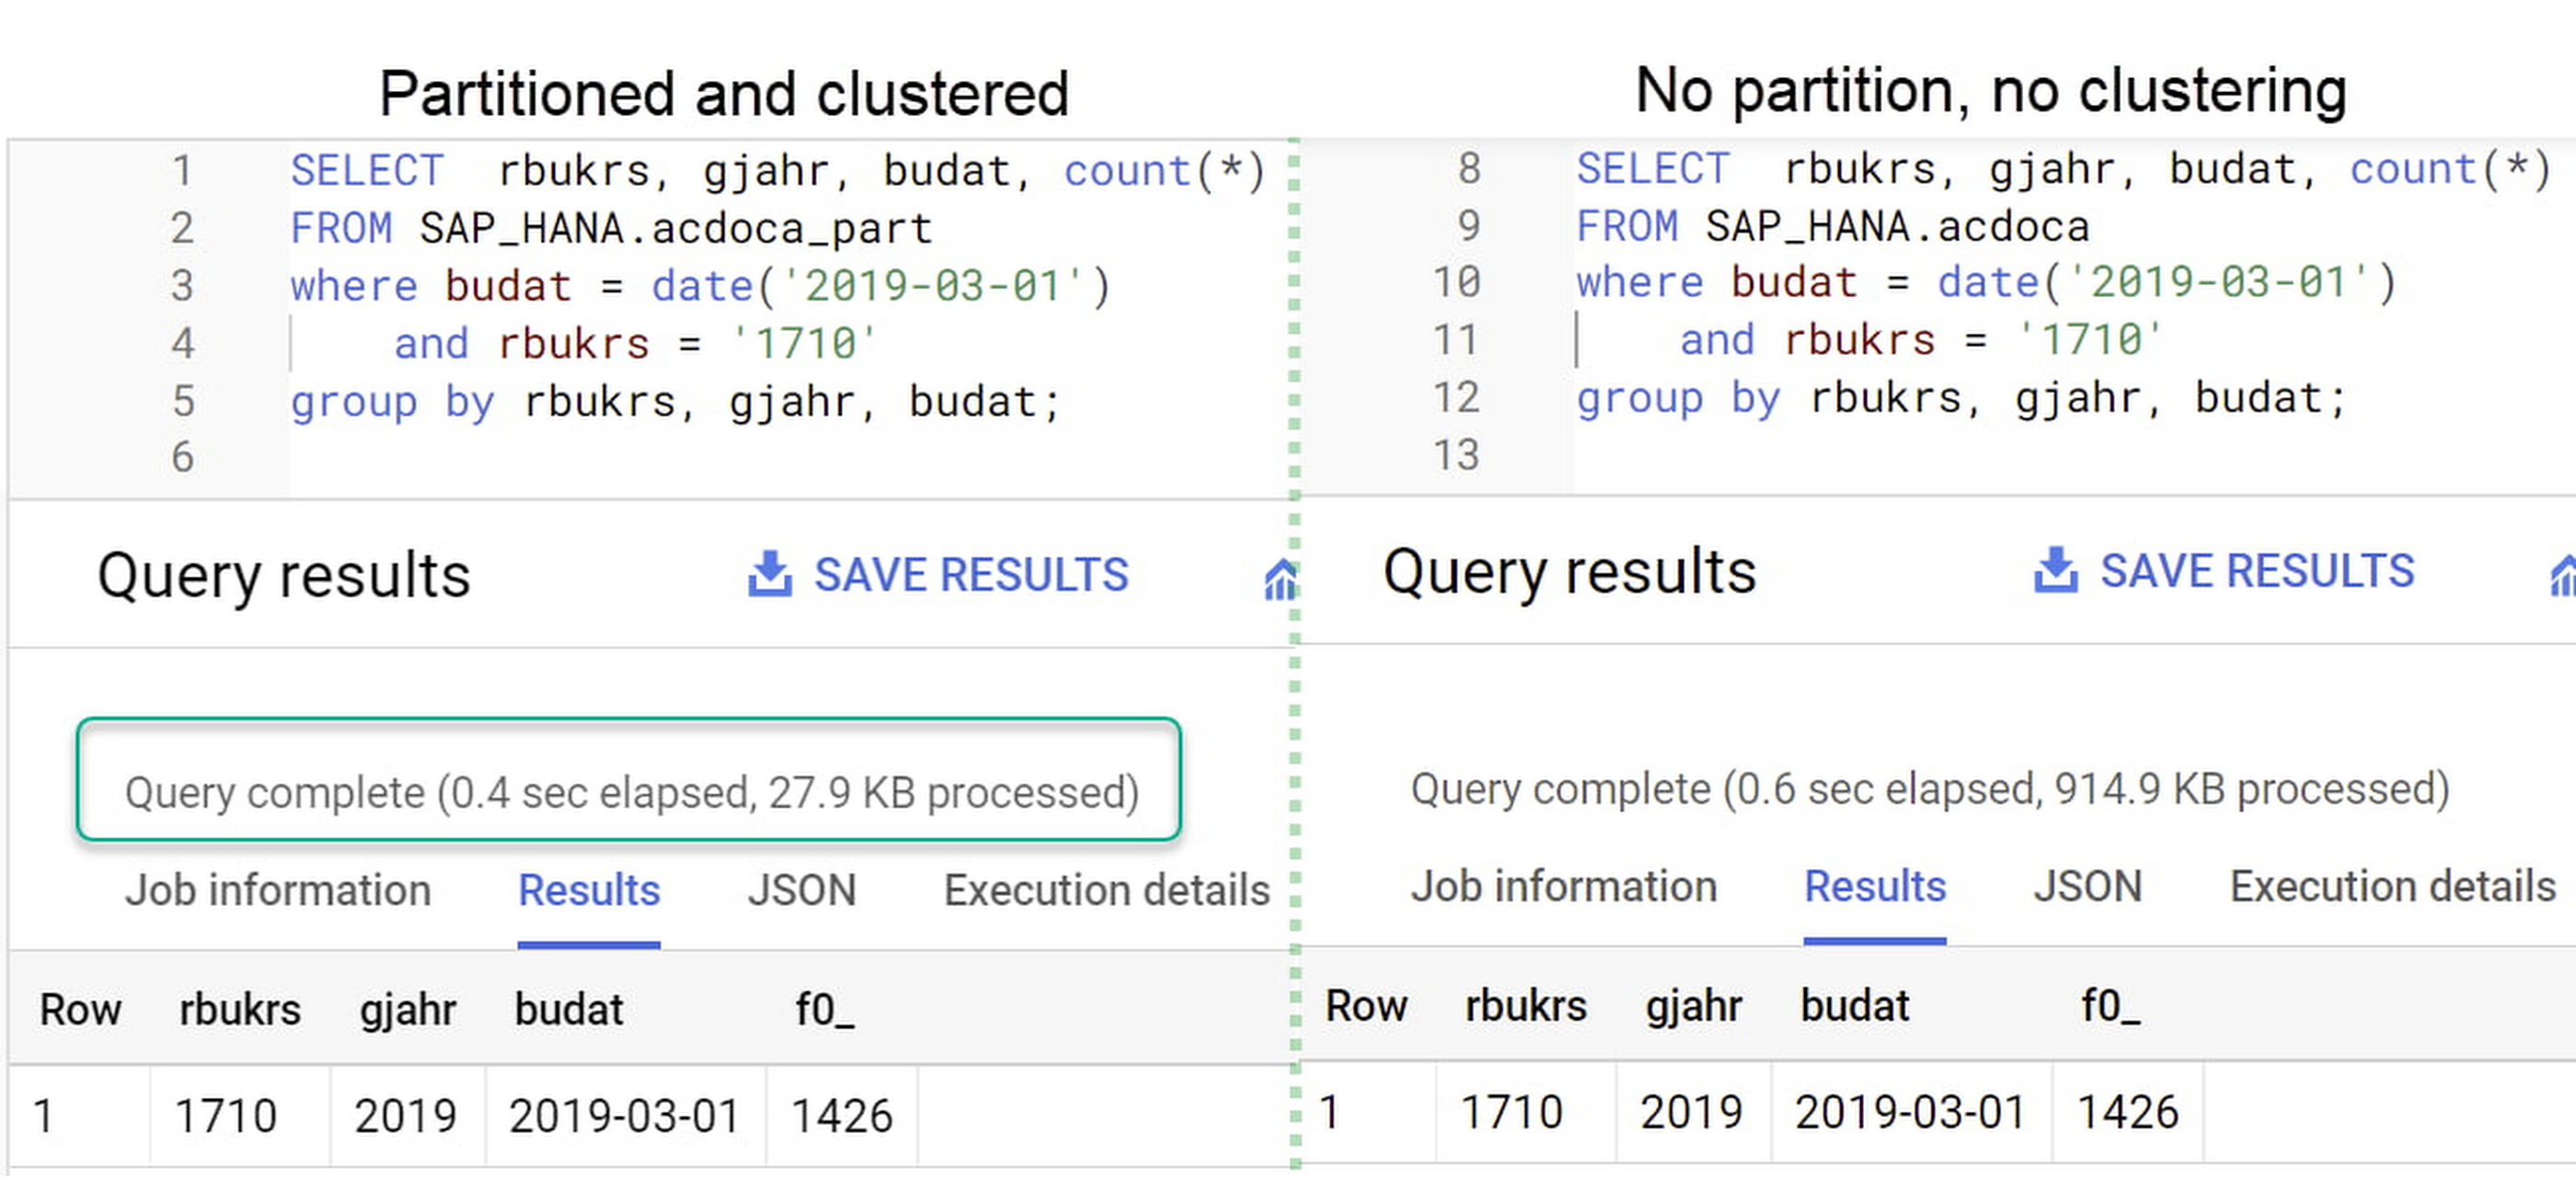
A great feature is that BigQuery will also periodically recluster the data automatically.
Materialized views
In BigQuery, materialized views are precomputed views that periodically cache the results of a query for better performance and efficiency. BigQuery uses precomputed results from materialized views and, whenever possible, reads only the delta changes from the base table to compute up-to-date results quickly. Materialized views can be queried directly or can be used by the BigQuery optimizer to process queries to the base table.
Queries that use materialized views are generally completed faster and consume fewer resources than queries that retrieve the same data only from the base table. If workload performance is an issue, materialized views can significantly improve the performance of workloads that have common and repeated queries. While materialized views currently only support single tables, they are very useful common and frequent aggregations like stock levels or order fulfillment.
Further tips on performance optimization while creating select statements can be found in the documentation for optimizing query computation.
Deployment pipeline and security
For most of the work you’ll do in BigQuery, you’ll normally have at least two delivery pipelines running — one for the actual objects in BigQuery and the other to keep the data staging, transforming, and updated as intended within the change-data-capture flows. Note that you can use most existing tools for your Continuous Integration / Continuous Deployment (CI/CD) pipeline — one of the benefits of using an open system like BigQuery. But, if your organization is new to CI/CD pipelines, this is a great opportunity to gradually gain experience. A good place to start is to read our guide for setting up a CI/CD pipeline for your data-processing workflow.
When it comes to access and security, most end-users will only have access to the final version of the BigQuery views. While row and column-level security can be applied, as in the SAP source system, separation of concerns can be taken to the next level by splitting your data across different Google Cloud projects and BigQuery datasets. While it’s easy to replicate data and structures across your datasets, it’s a good idea to define the requirements and naming conventions early in the design process so you set it up properly from the start.
Start driving faster and more insightful analytics
The best piece of advice we can give you is this: Try it yourself. Anyone with SQL knowledge can get started using the free BigQuery tier. New customers get $300 in free credits to spend on Google Cloud during the first 90 days. All customers get 10 GB storage and up to 1 TB queries/month, completely free of charge. In addition to discovering the massive processing capabilities, embedded machine learning, multiple integration tools, and cost benefits, you’ll soon discover how BigQuery can simplify your analytics tasks.
If you need additional assistance, our Google Cloud Professional Services Organization (PSO) and Customer Engineers will be happy to help show you the best path forward for your organization. For anything else, contact us at cloud.google.com/contact.
3119
Of your peers have already watched this video.
23:30 Minutes
The most insightful time you'll spend today!
Pytorch at Scale on Cloud TPUs
Cloud TPU Pods are machine learning supercomputers that enable enterprises to train large machine learning models at a scale otherwise difficult or sometimes impossible.
They deliver business value through solving many machine learning problems including image search, neural architecture search and large-scale language models both for Google and Google Cloud customers.
However, until a few months ago TPU devices and pods were limited to Tensorflow models. Much awaited support for Pytorch was announced in Pytorch conference 2019.
In this session, Vaibhav Singh, ML Specialist, Cloud Customer Engineer, Google Cloud and Taylan Bilal, Software Engineer, Google Cloud demystify the art and science of training your Pytorch models on TPUs. They take you through a step-by-step walkthrough using an example, then explain how it works, and finally how to scale up Pytorch training with Cloud TPU Pods.
This Diagnostic Company is Revolutionising Healthcare Delivery with AI
5408
Of your peers have already read this article.
5:30 Minutes
The most insightful time you'll spend today!
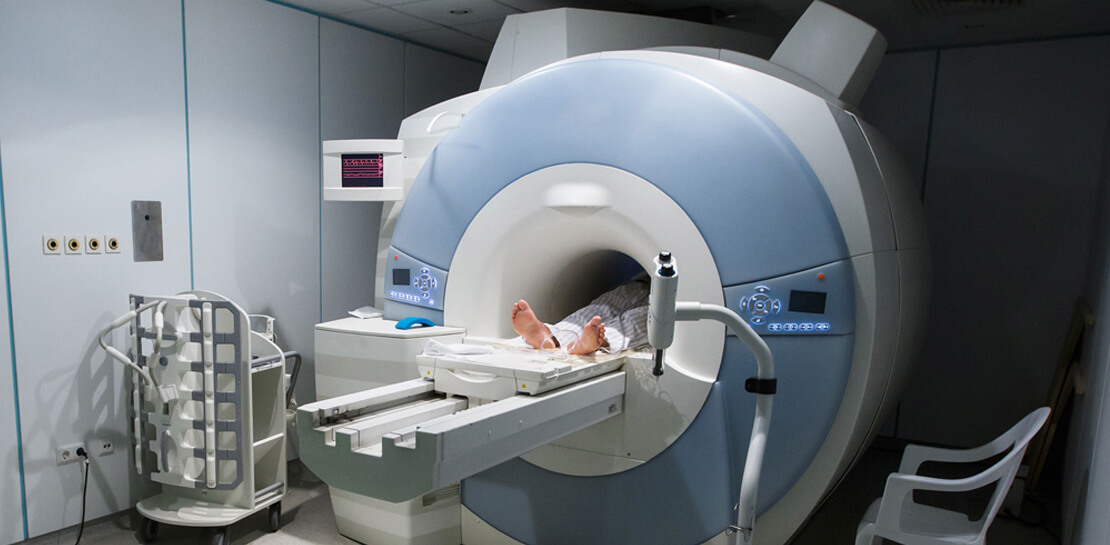
Dr. Elliot Smith cannot be accused of lacking ambition. A high achiever with a Ph.D. in Electrical Engineering and a specialist in magnetic resonance imaging (MRI) systems, Smith aims to deliver top quality healthcare to anyone in the world — regardless of their location or wealth.
Dr. Smith has already made strides on this journey with his Brisbane, Queensland-headquartered business, Maxwell MRI. “I saw there was a big gap in the market around automating the diagnosis of health conditions,” he says. “Existing processes were typically manual and involved a lot of people.”
Artificial intelligence (AI) and machine learning can remove a key obstacle to scaling out medicine and improve the efficiency and accuracy of diagnosing conditions, the healthcare entrepreneur believes.
“Our grand vision is to build an AI doctor that anyone can receive affordable support from and connect to in order to obtain results,” explains Dr. Smith.
Maxwell MRI presently enables clinicians to submit anonymised MRI scans to a machine learning enabled AI platform to help diagnose prostate cancer. The service is sold to clinicians who can then charge a per-session fee to clients. As well as obtaining results for individual cases, the MRI scans and associated information is used to ‘train’ the platform to deliver accurate diagnoses faster and in a more affordable way than existing systems do.
Dr. Smith and his team started by running a number of functions and processes on a single server with graphics processing units (GPUs) and sizable hard disk capacity. However, this infrastructure could not scale to support the planned growth of the business. Each case Maxwell MRI processes involves about 200MB of data in MRI scans alone. Once supplementary data, blood test result, pathology results and genetic information is included, this load can reach more than 1GB of data per patient.
The business aimed to process 150,000 cases by the end of 2018. This required a service that could deliver massive scale in data storage and compute, and could easily be accessed from any location. “We wanted to move from three GPUs to 30 GPUs without having to buy more servers or other associated equipment, so the cloud was the natural next step,” says Dr. Smith.
Maxwell MRI evaluated Google Cloud Platform (GCP) and determined that the managed services component of GCP would remove the burden of infrastructure deployment and administration. In addition, Google Cloud Machine Learning Engine would enable the business to scale to as many GPUs as needed to meet demand.
Maxwell MRI started with some small experiments to determine that GCP met all its requirements and completed its migration to the platform in February 2017. “We really started to scale up the data we had and consequently our computing requirements at that time,” Dr. Smith says.
The Maxwell MRI platform features an upload service that enables clinicians to upload imaging and associated data. This service triggers several different upload pipelines that clean and standardise data. They then write imaging data to Google Cloud Storage, and more structured data to a combination of Google Cloud Datastore and Google Cloud Spanner.
The platform then converts the information into records that can be used to ‘train’ new machine learning configurations or run evaluations through existing machine learning pipelines.
“The tasks we perform including segmenting various anatomical regions for analysis and sending those results back into Google Cloud Storage,” says Dr. Smith. “This then commences that repeated process of running Google Cloud Dataflow pipelines and machine learning algorithms, and presenting those outcomes back to the clinicians.”
Existing Literature Validated
The data processed and analysed to date has, Dr Smith says, enabled Maxwell MRI to help validate existing literature that indicates clinicians lack confidence in existing early-stage testing procedures for prostate cancer. This prompts them to move quickly to the biopsy stage to assure themselves their diagnosis is valid. “New technologies have a lot of potential to rectify this situation and guide treatment to be more accurate, specific and cost-effective,” he says.
Results Delivered in 10-15 Minutes
More specifically, using GCP has enabled Maxwell MRI to guarantee to clinicians that results will be delivered within minutes. “Clinicians are used to getting results back in two days to a week,” says Dr. Smith. “We’re saying that with our platform running on GCP we’ll deliver you results in 10 to 15 minutes, regardless of the number of patients coming in.”
Running on GCP has enabled the business to accelerate its development cycles, test new ideas easily on a subset of data, test in parallel and deliver new services considerably faster than in another environment. In addition, the flexible GCP charging model aligned with the ability to scale compute capabilities quickly and easily has enabled the fledgling business to control its costs.
Google technologies are poised to play an integral role in the business’s future. “With Google available, it doesn’t make sense for us to use our own infrastructure,” Dr. Smith says. “Our expertise in AI, machine learning and clinical engagement complements cloud platform specialties of infrastructure, managed services and ease of use. We see a bright future ahead in helping to transform healthcare globally.”
End Security Risks with the Unattended Projects Recommender Feature

6133
Of your peers have already read this article.
3:00 Minutes
The most insightful time you'll spend today!
In fast-moving organizations, it’s not uncommon for cloud resources, including entire projects, to occasionally be forgotten about. Not only such unattended resources can be difficult to identify, but they also tend to create a lot of headaches for product teams down the road, including unnecessary waste and security risks.
To help you prune your idle cloud resources, we’re excited to introduce Unattended Project Recommender. It’s a new feature of Active Assist that provides you with a one-stop shop for discovering, reclaiming, and shutting down unattended projects. With actionable and automatic recommendations, you no longer have to worry about wasting money or mitigating security risks presented by your idle resources. Unattended Project Recommender uses machine learning to identify, with a high degree of confidence, projects that are likely abandoned based on API and networking activity, billing, usage of cloud services, and other signals. This feature is available via the Recommender API today, making it easy for you to integrate with your company’s existing workflow management and communication tools, or export results to a BigQuery table for custom analysis.
Thousands of projects can be unattended in large organizations, presenting major security risks
Your cloud projects can go abandoned or unattended for a number of reasons — ranging from a test environment that’s no longer needed, to project cancellation, to project owner switching jobs, and more. Not only can such projects contribute to your cloud bill (waste) but they may contain security issues such as open firewalls or privileged service account keys that attackers can exploit to get a hold of your cloud resources for cryptocurrency mining or, worse, compromise your company’s sensitive data. These security risks tend to grow over time because the latest best practices and patches are usually not applied to unattended projects.
We experience this issue here at Google, too… In fact, it has been on Google’s internal security team’s radar for some time now, so we joined forces and looked into this problem together, starting with our very own “google.com” organization cloud projects. We quickly found some projects that were unattended, but remediating this issue was easier said than done due to challenges in several areas:
- Detection: With lots of signals available to you via sources like Cloud Monitoring, what are the right ones you should look at (e.g. API, networking, user activity)? How can you tell the difference between an unattended project and a project that has a low level of activity by design (e.g. a “shell” project that holds an auth token)?
- Remediation: Once you have identified a project that seems abandoned, how do you go about ensuring that it’s indeed an unattended project? How do you reduce the risk of deleting something that might be essential to a production workload, causing irreversible data loss? How do you solve this at the scale of your entire organization, beyond a one-time cleanup?
Over the course of 2021 we built and tested a Google-internal prototype first, cleaning up many of our internal unattended projects, and then worked with a number of Google Cloud customers to build and tune this feature based on real-life data (thank you to all of our early adopters for working with us and your generous feedback that helped us shape this feature!) It was not uncommon for us to come across organizations with thousands of unattended projects, and we’re very excited to bring Unattended Project Recommender to all customers, in public preview.
Discovering and acting on unattended project recommendations
Unattended Project Recommender analyzes usage activity across all projects under your organization, including the following data:
- API activity (e.g. service accounts with authentication activity, API calls consumed)
- Networking activity (ingress and egress)
- Billing activity (e.g. services with billable usage)
- User activity (e.g. active project owners)
- Cloud services usage (e.g. number of active VMs, BigQuery jobs, storage requests)
Based on these signals, it can generate recommendations to clean up projects that have low usage activity (where “low usage” is defined using a machine learning model that ranks projects in your organization by level of usage), or recommendations to reclaim projects that have high usage activity but no active project owners. Here’s what an example post-processed summary list of recommendations can look like for the “foobar” organization that has 3 projects:
Project ID: demo-project-307815Recommendation: CLEANUP_PROJECTProject ID: new-projectRecommendation: N/AProject ID: bobs-playground-projectRecommendation: RECLAIM_PROJECT
In addition to the recommendations, you can also examine the underlying project activity insights that the recommendations are based upon. The insights provide additional information that can be useful for integration with your organization’s existing workflows and automation (e.g. send an auto-generated email or chat message to project owners based on the list provided by the owners field). Here’s an example insight payload:
content:activeAppengineInstanceDailyCount: 0activeCloudsqlInstanceDailyCount: 0activeGceInstanceDailyCount: 3activeServiceAccountDailyCount: 1apiClientDailyCount: 18922 // Daily average API calls producedbigqueryInflightJobDailyCount: 0bigqueryInflightQueryDailyCount: 0bigqueryStorageDailyBytes: 0bigqueryTableDailyCount: 0consumedApiDailyCount: 0 // Daily average API calls consumeddatastoreApiDailyCount: 0gcsObjectDailyCount: 11gcsRequestDailyCount: 0gcsStorageDailyBytes: 2663548hasActiveOauthTokens: false // OAuth tokens used in the last 180 dayshasBillingAccount: truenumActiveUserOwners: 1owners: // List of project owners- activeOnProject: falsemember: user:user1@example.com- activeOnProject: truemember: user:user2@example.comserviceWithBillableUsage:– Cloud Storage- Compute EnginevpcEgressDailyBytes: 264456938 // Daily average VPC egress bytesvpcIngressDailyBytes: 392435047 // Daily average VPC ingress bytesusagePercentile: 20 // Level of usage relative to other projects
GCP projects are used in many different ways and for many different purposes. In case you get a recommendation to delete a project that’s being used in a way that’s out of the scope for this feature, you can dismiss the recommendation and it will stop showing up for the given project.
Restoring deleted projects
When you choose to shut down a project using the projects.delete() method, it gets marked for deletion. After a project is marked for deletion, it becomes unusable, all resources within that project are shut down, and a 30-day wait period for the project and all of its data to get fully deleted begins.
In case a useful project is accidentally shut down, you have the option to restore the project within that 30-day wait period. Since restoring allows you to recover most but not necessarily all of your project data and resources, we recommend carefully examining the utilization insights associated with a project and considering any additional utilization signals that may not be captured by the Unattended Project Recommender before taking the cleanup action.
Early customer success stories
A number of enterprise customers are already using Unattended Project Recommender to keep their organizations clean of unattended projects and resources.
Decathlon, a French sporting goods retailer, is excited for the insight Unattended Project Recommender will bring to their environment, and are already deploying it as a part of their latest cloud security initiatives.
“After a thorough test of this feature and the validation of our CISO, we ended up deleting our first 775 projects, and no one complained! A great help to improve our security. The next step for us will be to operationalize it at scale, and implement a company wide policy for unattended resource management.” —Adeline Villette, Cloud Security Officer
For Veolia, one of the world’s largest water, waste and energy management companies, not only does this feature reduce security risks and waste, but also helps drive cultural shift and alignment with its ecological transformation strategy.
“This feature allows us to reduce our costs and security debt on assets that are no longer in use, and is also fully in line with Veolia’s philosophy of limiting its carbon footprint. After having tested Unattended Project Recommender on more than 3,000 projects throughout our organization, we are looking to bring it as proactive alerts to our project owners at scale.”—Thomas Meriadec, Product Manager
Box, a secure cloud content management provider, views it as a foundation for building a repeatable process to remediate unused resources.
“Unattended Project Recommender is a great fit for us. It gives us a unified view of project usage across our entire organization and enables us to address security risks of legacy projects in a systematic and organized manner, ensuring an even safer environment.” —Matt Bowes, Staff Security Engineer
Getting started with the Unattended Project Recommender
To help you get started, we’ve prepared a Cloud Shell tutorial (source code) that you can use to find unattended project recommendations within your own Projects/Folders/Organization. Click this button to clone the tutorial from GitHub and run in your Cloud Shell environment:

As you can see, listing recommendations for your projects only takes a few clicks with the tutorial (special thanks to Lanre Ogunmola, Security & Compliance Specialist, for making this look so easy)! For additional detail on using the gcloud CLI or API to discover unattended project recommendations, please refer to the documentation page.
You can also automatically export all recommendations from your Organization to BigQuery and then investigate the recommendations with DataStudio or Looker, or use Connected Sheets that let you use Google Workspace Sheets to interact with the data stored in BigQuery without having to write SQL queries.
As with any other Recommender, you can choose to opt out of data processing at any time by disabling the appropriate data groups in the Transparency & control tab under Privacy & Security settings.
We hope that you can leverage Unattended Project Recommender to improve your cloud security posture and reduce cost, and can’t wait to hear your feedback and thoughts about this feature! Please feel free to reach us at active-assist-feedback@google.com and we also invite you to sign up for our Active Assist Trusted Tester Group if you would like to get early access to the newest features as they are developed.
What Drives Your Organization to be Data-driven?

4889
Of your peers have already read this article.
4:00 Minutes
The most insightful time you'll spend today!
Every organization has its own unique data culture and capabilities. Yet each is expected to use technology trends and solutions in the same way as everyone else. Your organization may be built on years of legacy applications, you may have developed a considerable amount of expertise and knowledge, yet you may be asked to adopt a new approach based on a technology trend. On the other hand, you may be on the other side of the spectrum, a digitally native organization built with engineering principles from scratch without legacy systems but expected to follow the same principles as process driven, established organizations. The question is, should we treat these organizations in the same way when it comes to data processing? In this series of blogs and papers this is what we are exploring: how to set up an organization from the first principles from data analyst, data engineering and data science point of view. In reality, there is no such organization that is solely driven by one of these but it is likely to be a combination of multiple types. What type of organization you become is then driven by how much you are influenced by each of these principles.
When you are considering what data processing technology encompasses, take a step back and make a strategic decision based on your key goals. This can be whether you optimize for performance, cost, reduction in operational overhead, increase in operational excellence, integration of new analytical and machine learning approaches. Or perhaps you’re looking to leverage existing employees’ skills while meeting all your data governance and regulatory requirements. We will be exploring these different themes and will focus on how they guide your decision-making process. You may be coming from technologies which are solving some of the past problems and some of the terminologies may be more familiar, however they don’t scale your capabilities. There is also the opportunity cost of prioritizing legacy and new issues that arise from a transformation effort, and as a result your new initiative can set you further behind on your core business while you play catch up to an ever changing technology landscape.
Data value chain
The key for any ingestion and transformation tool is to extract data from a source and start acting on it. The ultimate goal is to reduce the complexity and increase the timeliness of the data. Without data, it is impossible to create a data driven organization and act on the insights. As a result, data needs to be transformed, enriched, joined with other data sources, and aggregated to make better decisions. In other words, insights on good timely data mean good decisions.
While deciding on the data ingestion pipeline, one of the best approaches is to look into the volume of data, the velocity of the data, and type of data that is arriving. Other considerations include the number of different data sources you are managing, whether you need to scale to thousands of sources using generic pipelines, whether you want to create one generic pipeline but then apply data quality rules and governance. ETL tools are ideal for this use case as generic pipelines can be written and then parameterized.
On the other hand, consider the data source. Can the data be directly ingested without transforming and formatting the data? If the data does not need to be transformed and can be ingested directly into the data warehouse as a managed solution. This not only reduces the operational costs but also allows for more timely data delivery. If the data is coming in through an unstructured format such as XML or in a format such as EBCDIC and needs to be transformed and formatted, then a tool with ETL Capabilities can be used depending on the speed of the data arrival.
It is also important to understand the speed and time of arrival of the data. Think about your SLAs and time durations/windows that are relevant for your data ingestion plans. This would not only drive the ingestion profiles but would also dictate which framework to use. As discussed above, velocity requirements would drive the decision-making process.
Type of Organization
Different organizations can be successful by employing different strategies based on the talent that they have. Just like in sports, each team plays with a different strategy with the ultimate goal of winning.
Organizations often need to decide on what’s the best strategy to take in respect to data ingestion and processing – whether you need to hire an expensive group of data engineers, or exploit your data wizards and analysts to enrich and transform data that can be acted on, or whether it would be more realistic to train the current workforce to do more functional/high value work rather than to focus on building generally understood and available foundational pieces.
On the other hand, the transformation part of ETL pipelines as we know it, dictates where the load will be. All of these are made a reality in the cloud native world where data can be enriched, aggregated, and joined. Loading data into a powerful and modern data warehouse means that you can already join and enrich the data using ELT. Consequently, ETL isn’t really needed in its strict terms anymore if the data can be loaded directly into the data warehouse.
All of the above was not possible in the traditional, siloed, and static data warehouses and data ecosystems whereby systems would not talk to each other or there were capacity constraints in respect to both storing and processing the data in the expensive Data Warehouse. This is no longer the case in the BigQuery world as storage is now cheap and transformations are now much more capable without constraints of virtual appliances.
If your organization is already heavily invested into an ETL tool, one option is to use them to load BigQuery and transform the data initially within the ETL tool. Once the as-is and to-be are verified to be matching, then with the improved knowledge and expertise one can start moving workloads into BigQuery SQL, and effectively do ELT.
Furthermore, if your organization is coming from a more traditional data warehouse that extensively relies on stored procedures and scripting, then the question that one may ask is, do I continue leveraging these skills and expertise and use these capabilities that are also provided in BigQuery? ELT with BigQuery is more natural, similar to what’s already in Teradata BTEQ, Oracle PL/SQL but migrating from ETL to ELT requires changes. This change then enables exploiting streaming use cases, such as real-time use cases in retail. This is because there is no preceding step before data is loaded and made available.
Organizations can be broadly classified under 3 types as Data Analyst Driven, Data Engineering driven, and Blended organization. We will be covering a Data Science driven organization within the Blended category.
Data Analyst Driven
Analysts understand the business and are used to using SQL/spreadsheets. Allowing them to do advanced analytics through interfaces that they are accustomed to enables scaling. As a result, easy to use ETL tooling to bring data quickly into the target system becomes a key driver. Ingesting data directly from a source or staging area then also becomes critical as it allows analysts to exploit their key skills using ELT and increases timeliness of the data. This is commonplace with traditional EDWs and realized by extended capabilities of using Stored Procedures and Scripting. Data is enriched, transformed, and cleansed using SQL and ETL tools act as the orchestration tools.
The capabilities brought by cloud computing on separation of data and computation changes the face of the EDW as well. Rather than creating complex ingestion pipelines, the role of the ingestion becomes, bringing data close to the cloud, staging on a storage bucket or on a messaging system before being ingested into the cloud EDW. This then releases data analysts to focus on looking into data insights using tools and interfaces that they are accustomed to.
Data Engineering / Data Science Driven
Building complex data engineering pipelines is expensive but enables increased capabilities. This allows creating repeatable processes and scaling the number of sources. Once complemented with cloud it enables agile data processing methodologies. On the other hand, data science organizations allow carrying out experiments and producing applications that work for specific use cases but are not often productionised or generalized.
Real-time analytics enables immediate responses and there are specific use cases where low latency anomaly detection applications are required to run. In other words, business requirements would be such that it has to be acted upon as the data arrives on the fly. Processing this type of data or application requires transformation done outside of the target.
All the above usually requires custom applications or state-of-the-art tooling which is achieved by organizations that excel with their engineering capabilities. In reality, there are very few organizations that can be truly engineering organizations. Many fall into what we call here as the blended organization.
Blended org
The above classification can be used on tool selection for each project. For example, rather than choosing a single tool, choose the right tool for the right workload, because this would reduce operational cost, license cost and use the best of the tools available. Let the deciding factor be driven by business requirements: each business unit or team would know the applications they need to connect with to get valuable business insights. This coupled with the data maturity of the organization would be the key to making sure the right data processing tool would be the right fit.
In reality, you are likely to be somewhere on a spectrum. Digital native organizations are likely to be closer to being engineering driven, due to their culture and business that they are in. However, brick and mortar organizations would be closer to being analyst driven due to the significant number of legacy systems and processes they possess. These organizations are either considering or working toward digital transformation with an aspiration of having a data engineering / software engineering culture like Google.
The blended organization with strong skills around data engineering, would have built the platform and built frameworks, to increase reusable patterns would increase productivity and then reduce costs. Data engineers focus on running Spark on Kubernetes whereas infrastructure engineers focus on container work. This in turn provides unparalleled capabilities as application developers focus on the data pipelines and even the underlying technologies or platforms changes code stays the same. As a result, security issues, latency requirements, cost demands and portability are addressed at multiple layers.
Conclusion – What type of organization are you?
Often an organization’s infrastructure is not flexible enough to react to a fast changing technological landscape. Whether you are part of an organization which is engineering driven or analyst driven, organizations frequently look at technical requirements that inform which architecture to implement. But a key, and frequently overlooked, component needed to truly become a data-driven organization is the impact of the architecture on your data users. When you take into account the responsibilities, skill sets, and trust of your data users, you can create the right data platform to meet the needs of your IT department as well as your business.
To become a truly data-driven organization, the first step is to design and implement an analytics data platform that meets your technical and business needs. The reality is that each organization is different and has a different culture, different skills, and capabilities. Key is to leverage its strengths to stay competitive while adopting new technologies when it is needed and as it fits to your organization.
To learn more about the elements of how to build an analytics data platform depending on the organization you are, read our paper here.
Google and Fervo Agreement to Shape-up Plans for 24/7 Carbon-free Energy by 2030

4807
Of your peers have already read this article.
1:30 Minutes
The most insightful time you'll spend today!
When Google announced our plan to go beyond purchasing renewable power for 100% of our energy usage and operate on 24/7 carbon-free energy by 2030, we noted that achieving this goal will require new transaction structures, advancements in clean energy policy, and innovative new technologies. Today, we’re pleased to announce that one of these new technologies—a first-of-its-kind, next-generation geothermal project—will soon begin adding carbon-free energy to the electric grid that serves our data centers and infrastructure throughout Nevada, including our Cloud region in Las Vegas.
Google and clean-energy startup Fervo have just signed the world’s first corporate agreement to develop a next-generation geothermal power project, which will provide an “always-on” carbon-free resource that can reduce our hourly reliance on fossil fuels. In 2022, Fervo will begin adding “firm” geothermal energy to the state’s electric grid system, where Google’s commitments already include one of the world’s largest corporate solar-plus-storage power purchase agreements.
Importantly, this collaboration also sets the stage for next-generation geothermal to play a role as a firm and flexible carbon-free energy source that can increasingly replace carbon-emitting fossil fuels—especially when aided by policies that expand and improve electricity markets; incentivize deployment of innovative technologies; and increase investments in clean energy research, development, and demonstration (RD&D).
Next-generation geothermal technology
Traditional geothermal already provides carbon-free baseload energy to a number of power grids. But because of cost and location constraints, it accounts for a very small percentage of global clean energy production.
That’s one reason this new approach is so exciting; by using advanced drilling, fiber-optic sensing, and analytics techniques, next-generation geothermal can unlock an entirely new class of resource. And the US Department of Energy has found that with advancements in policy, technology, and procurement, geothermal energy could provide up to 120 GW of firm, flexible generation capacity in the US by 2050.
As part of our agreement, Google is partnering with Fervo to develop AI and machine learning that could boost the productivity of next-generation geothermal and make it more effective at responding to demand, while also filling in the gaps left by variable renewable energy sources. Although this project is still in the early stages, it shows promise.

Using fiber-optic cables inside wells, Fervo can gather real-time data on flow, temperature, and performance of the geothermal resource. This data allows Fervo to identify precisely where the best resources exist, making it possible to control flow at various depths. Coupled with the AI and machine learning development outlined above, these capabilities can increase productivity and unlock flexible geothermal power in a range of new places.
This won’t be the first time that Google is applying software solutions to clean energy applications: we’ve just announced an update to our carbon-intelligent computing program that helps us reduce emissions associated with running applications at Google data centers. And other forms of AI and machine learning are currently being used to increase the value of wind energy.
Already this year, Google has taken significant strides toward sourcing 24/7 carbon-free energy for all our data centers, office campuses, and Cloud regions. On Earth Day, our CEO Sundar Pichai announced that for the first time, five of our global data center sites operated near or at 90% carbon-free energy in 2020.
Not only does this Fervo project bring our data centers in Nevada closer to round-the-clock clean energy, but it also acts as a proof-of-concept to show how firm clean energy sources such as next-generation geothermal could eventually help replace carbon-emitting power sources around the world.
More Relevant Stories for Your Company

Woolaroo App and Vision AI are Helping Users Explore Native Languages
One of the most vibrant elements of culture is the use of native languages and the time-honored tradition of storytelling. Anthropologists and linguists have been vocal on the role that language plays in the preservation of culture and how it contributes to the appreciation of heritage. Unfortunately, of the more

Held Back by Database Scalability, This Financial Services Company Switches to Google Cloud and Cloud Spanner
Azimut Group operates an international network of companies handling investment and asset management, mutual funds, hedge funds, and insurance. Founded in Milan, Italy in 1988, Azimut Group today has branches in fifteen countries, including Brazil, China, and the USA. “We have subsidiaries and manage funds all over the world,” explains Simone

Reasons to Leverage Vertex AI Custom Training Service
At one point or another, many of us have used a local computing environment for machine learning (ML). That may have been a notebook computer or a desktop with a GPU. For some problems, a local environment is more than enough. Plus, there's a lot of flexibility. Install Python, install

Tyson Foods’ Story of Unlocking Opportunities by Integrating Real-time Analytics with AI and BI
As data environments become more complex, companies are turning to streaming analytics solutions that analyze data as it’s ingested and deliver immediate, high-value insights into what is happening now. These insights enable decision makers to act in real time to take advantage of opportunities or respond to issues as they
