





Real-time analytics for on-time delivery: Mercado Libre

3049
Of your peers have already read this article.
1:30 Minutes
The most insightful time you'll spend today!
Iteration and innovation fuel the data-driven culture at Mercado Libre. In our first post, we presented our continuous intelligence approach, which leverages BigQuery and Looker to create a data ecosystem on which people can build their own models and processes.
Using this framework, the Shipping Operations team was able to build a new solution that provided near real-time data monitoring and analytics for our transportation network and enabled data analysts to create, embed, and deliver valuable insights.
The challenge
Shipping operations are critical to success in e-commerce, and Mercado Libre’s process is very complex since our organization spans multiple countries, time zones, and warehouses, and includes both internal and external carriers. In addition, the onset of the pandemic drove exponential order growth, which increased pressure on our shipping team to deliver more while still meeting the 48-hour delivery timelines that customers have come to expect.
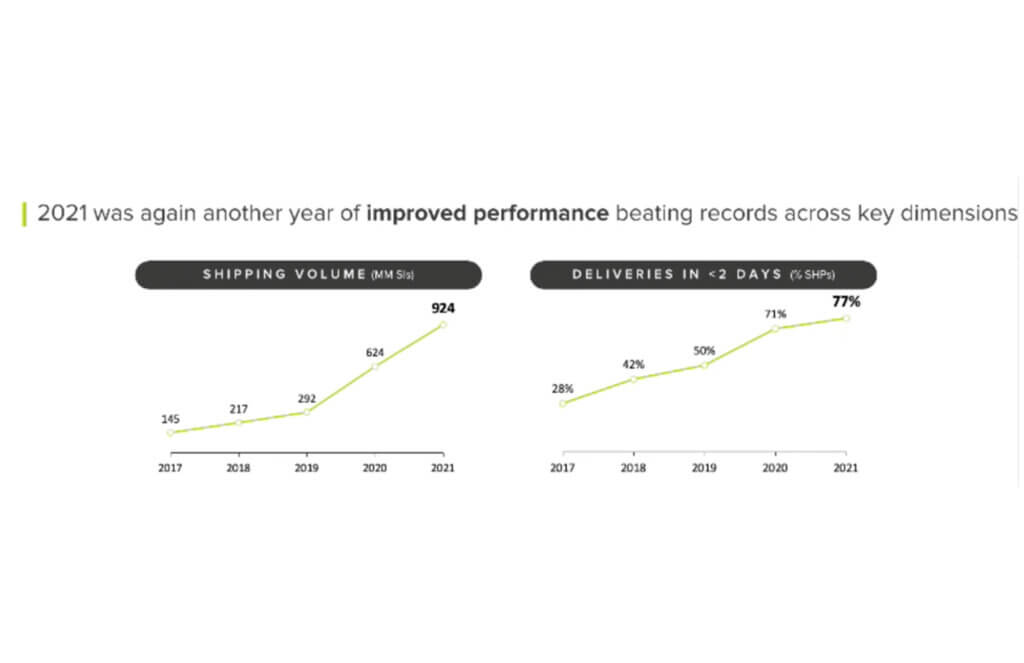
This increased demand led to the expansion of fulfillment centers and cross-docking centers, doubling and tripling the nodes of our network (a.k.a. meli-net) in the leading countries where we operate. We also now have the largest electric vehicle fleet in Latin America and operate domestic flights in Brazil and Mexico.
We previously worked with data coming in from multiple sources, and we used APIs to bring it into different platforms based on the use case. For real-time data consumption and monitoring, we had Kibana, while historical data for business analysis was piped into Teradata. Consequently, the real-time Kibana data and the historical data in Teradata were growing in parallel, without working together. On one hand, we had the operations team using real-time streams of data for monitoring, while on the other, business analysts were building visualizations based on the historical data in our data warehouse.
This approach resulted in a number of problems:
- The operations team lacked visibility and required support to build their visualizations. Specialized BI teams became bottlenecks.
- Maintenance was needed, which led to system downtime.
- Parallel solutions were ungoverned (the ops team used an Elastic database to store and work with attributes and metrics) with unfriendly backups and data bounded for a period of time.
- We couldn’t relate data entities as we do with SQL.
Striking a balance: real-time vs. historical data
We needed to be able to seamlessly navigate between real-time and historical data. To address this need, we decided to migrate the data to BigQuery, knowing we would leverage many use cases at once with Google Cloud.
Once we had our real-time and historical data consolidated within BigQuery, we had the power to make choices about which datasets needed to be made available in near real-time and which didn’t. We evaluated the use of analytics with different time windows tables from the data streams instead of the real-time logs visualization approach. This enabled us to serve near real-time and historical data utilizing the same origin.
We then modeled the data using LookML, Looker’s reusable modeling language based on SQL, and consumed the data through Looker dashboards and Explores. Because Looker queries the database directly, our reporting mirrored the near real-time data stored in BigQuery. Finally, in order to balance near real-time availability with overall consumption costs, we analyzed key use cases on a case-by-case basis to optimize our resource usage.
This solution prevented us from having to maintain two different tools and featured a more scalable architecture. Thanks to the services of GCP and the use of BigQuery, we were able to design a robust data architecture that ensures the availability of data in near real-time.
Streaming data with our own Data Producer Model: from APIs to BigQuery
To make new data streams available, we designed a process which we call the “Data Producer Model” (“Modelo Productor de Datos” or MPD) where functional business teams can serve as data creators in charge of generating data streams and publishing them as related information assets we call “data domains”. Using this process, the new data comes in via JSON format, which is streamed into BigQuery. We then use a 3-tiered transformation process to convert that JSON into a partitioned, columnar structure.
To make these new data sets available in Looker for exploration, we developed a Java utility app to accelerate the development of LookML and make it even more fun for developers to create pipelines.
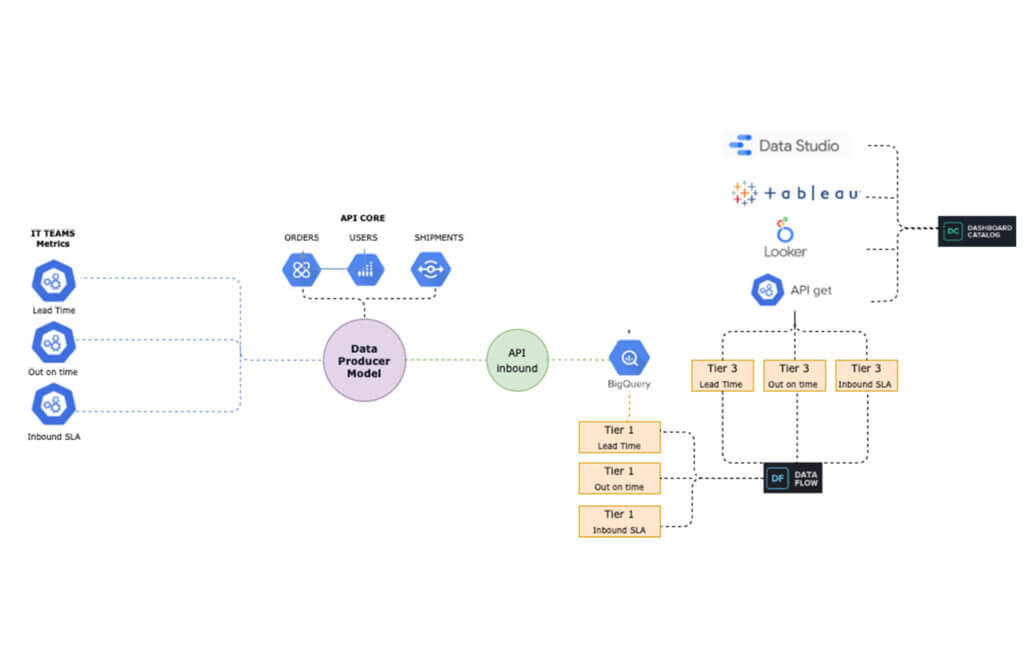
The complete “MPD” solution results in different entities being created in BigQuery with minimal manual intervention. Using this process, we have been able to automate the following:
- The creation of partitioned, columnar tables in BigQuery from JSON samples
- The creation of authorized views in a different GCP BigQuery project (for governance purposes)
- LookML code generation for Looker views
- Job orchestration in a chosen time window
By using this code-based incremental approach with LookML, we were able to incorporate techniques that are traditionally used in DevOps for software development, such as using Lams to validate LookML syntax as a part of the CI process and testing all our definitions and data with Spectacles before they hit production. Applying these principles to our data and business intelligence pipelines has strengthened our continuous intelligence ecosystem. Enabling exploration of that data through Looker and empowering users to easily build their own visualizations has helped us to better engage with stakeholders across the business.
The new data architecture and processes that we have implemented have enabled us to keep up with the growing and ever-changing data from our continuously expanding shipping operations. We have been able to empower a variety of teams to seamlessly develop solutions and manage third party technologies, ensuring that we always know what’s happening – and more critically – enabling us to react in a timely manner when needed.
Outcomes from improving shipping operations:
Today, data is being used to support decision-making in key processes, including:
- Carrier Capacity Optimization
- Outbound Monitoring
- Air Capacity Monitoring
This data-driven approach helps us to better serve you -and everyone- who expects to receive their packages on-time according to our delivery promise. We can proudly say that we have improved both our coverage and speed, delivering 79% of our shipments in less than 48 hours in the first quarter of 2022.
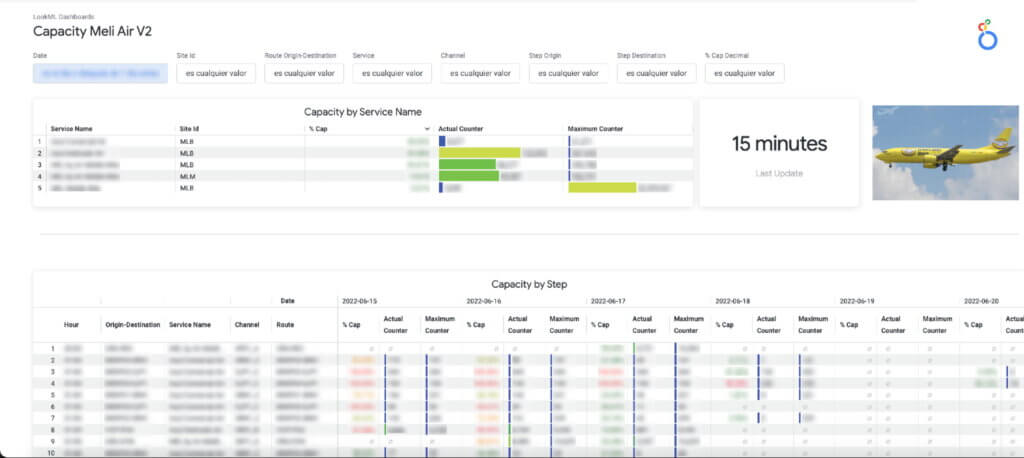
Here is a sneak peek into the data assets that we use to support our day-to-day decision making:
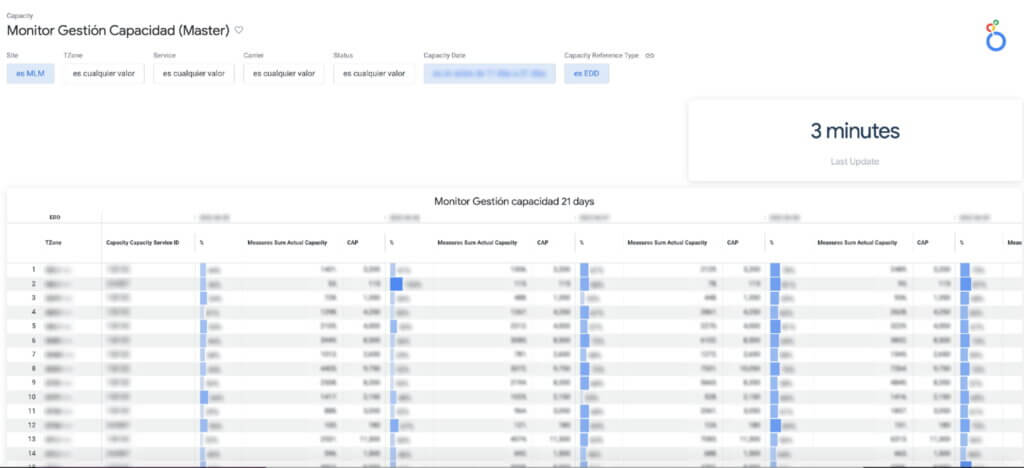
a. Carrier Capacity: Allows us to monitor the percentage of network capacity utilized across every delivery zone and identify where delivery targets are at risk in almost real time.
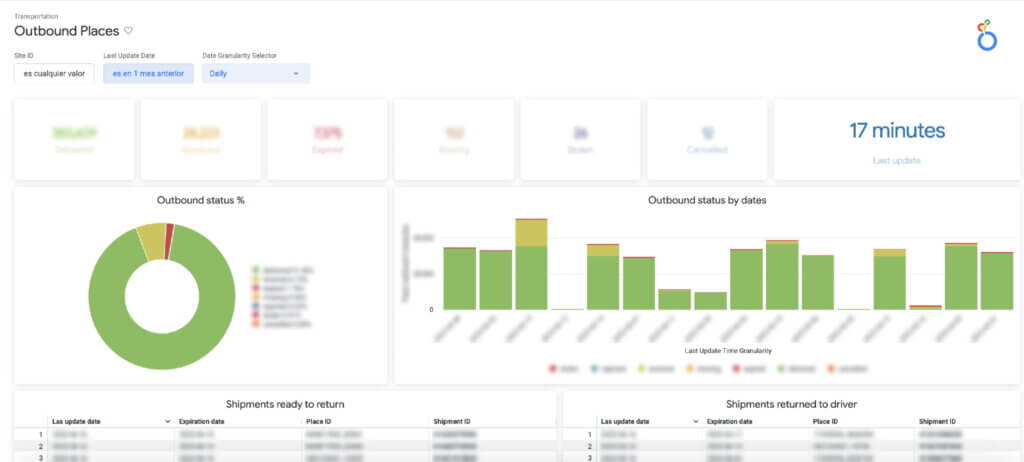
b. Outbound Places Monitoring: Consolidates the number of shipments that are destined for a place (the physical points where a seller picks up a package), enabling us to both identify places with lower delivery efficiency and drill into the status of individual shipments.
c. The Air Capacity Monitoring: Provides capacity usage monitoring for our aircrafts running each of our shipping routes.
Costs into the equation
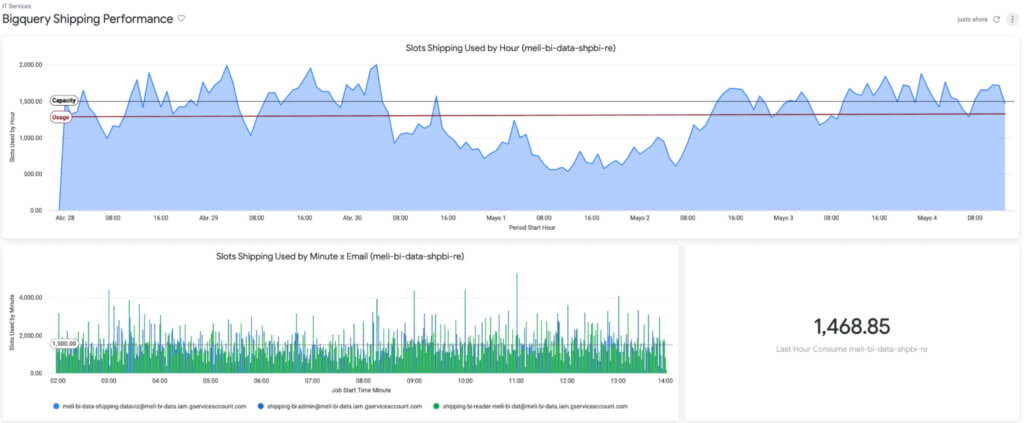
The combination of BigQuery and Looker also showed us something we hadn’t seen before: overall cost and performance of the system. Traditionally, developers maintained focus on metrics like reliability and uptime without factoring in associated costs.
By using BigQuery’s information schema, Looker Blocks, and the export of BigQuery logs, we have been able to closely track data consumption, quickly detect underperforming SQL and errors, and make adjustments to optimize our usage and spend.
Based on that, we know the Looker Shipping Ops dashboards generate a concurrency of more than 150 queries, which we have been able to optimize by taking advantage of BigQuery and Looker caching policies.
The challenges ahead
Using BigQuery and Looker has enabled us to solve numerous data availability and data governance challenges: single point access to near real-time data and to historical information, self-service analytics & exploration for operations and stakeholders across different countries & time zones, horizontal scalability (with no maintenance), and guaranteed reliability and uptime (while accounting for costs), among other benefits.
However, in addition to having the right technology stack and processes in place, we also need to enable every user to make decisions using this governed, trusted data. To continue achieving our business goals, we need to democratize access not just to the data but also to the definitions that give the data meaning. This means incorporating our data definitions with our internal data catalog and serving our LookML definitions to other data visualizations tools like Data Studio, Tableau or even Google Sheets and Slides so that users can work with this data through whatever tools they feel most comfortable using.
If you would like a more indepth look at how we made new data streams available from a process we designed called the “Data Producer Model” (“Modelo Productor de Datos” or MPD) register to attend our webcast on August 31.
While learning and adopting new technologies can be a challenge, we are excited to tackle this next phase, and we expect our users will be too, thanks to a curious and entrepreneurial culture. Are our teams ready to face new changes? Are they able to roll out new processes and designs? We’ll go deep on this in our next post.
Real-time analytics for on-time delivery: Mercado Libre
3050
Of your peers have already read this article.
1:30 Minutes
The most insightful time you'll spend today!
Iteration and innovation fuel the data-driven culture at Mercado Libre. In our first post, we presented our continuous intelligence approach, which leverages BigQuery and Looker to create a data ecosystem on which people can build their own models and processes.
Using this framework, the Shipping Operations team was able to build a new solution that provided near real-time data monitoring and analytics for our transportation network and enabled data analysts to create, embed, and deliver valuable insights.
The challenge
Shipping operations are critical to success in e-commerce, and Mercado Libre’s process is very complex since our organization spans multiple countries, time zones, and warehouses, and includes both internal and external carriers. In addition, the onset of the pandemic drove exponential order growth, which increased pressure on our shipping team to deliver more while still meeting the 48-hour delivery timelines that customers have come to expect.
This increased demand led to the expansion of fulfillment centers and cross-docking centers, doubling and tripling the nodes of our network (a.k.a. meli-net) in the leading countries where we operate. We also now have the largest electric vehicle fleet in Latin America and operate domestic flights in Brazil and Mexico.
We previously worked with data coming in from multiple sources, and we used APIs to bring it into different platforms based on the use case. For real-time data consumption and monitoring, we had Kibana, while historical data for business analysis was piped into Teradata. Consequently, the real-time Kibana data and the historical data in Teradata were growing in parallel, without working together. On one hand, we had the operations team using real-time streams of data for monitoring, while on the other, business analysts were building visualizations based on the historical data in our data warehouse.
This approach resulted in a number of problems:
- The operations team lacked visibility and required support to build their visualizations. Specialized BI teams became bottlenecks.
- Maintenance was needed, which led to system downtime.
- Parallel solutions were ungoverned (the ops team used an Elastic database to store and work with attributes and metrics) with unfriendly backups and data bounded for a period of time.
- We couldn’t relate data entities as we do with SQL.
Striking a balance: real-time vs. historical data
We needed to be able to seamlessly navigate between real-time and historical data. To address this need, we decided to migrate the data to BigQuery, knowing we would leverage many use cases at once with Google Cloud.
Once we had our real-time and historical data consolidated within BigQuery, we had the power to make choices about which datasets needed to be made available in near real-time and which didn’t. We evaluated the use of analytics with different time windows tables from the data streams instead of the real-time logs visualization approach. This enabled us to serve near real-time and historical data utilizing the same origin.
We then modeled the data using LookML, Looker’s reusable modeling language based on SQL, and consumed the data through Looker dashboards and Explores. Because Looker queries the database directly, our reporting mirrored the near real-time data stored in BigQuery. Finally, in order to balance near real-time availability with overall consumption costs, we analyzed key use cases on a case-by-case basis to optimize our resource usage.
This solution prevented us from having to maintain two different tools and featured a more scalable architecture. Thanks to the services of GCP and the use of BigQuery, we were able to design a robust data architecture that ensures the availability of data in near real-time.
Streaming data with our own Data Producer Model: from APIs to BigQuery
To make new data streams available, we designed a process which we call the “Data Producer Model” (“Modelo Productor de Datos” or MPD) where functional business teams can serve as data creators in charge of generating data streams and publishing them as related information assets we call “data domains”. Using this process, the new data comes in via JSON format, which is streamed into BigQuery. We then use a 3-tiered transformation process to convert that JSON into a partitioned, columnar structure.
To make these new data sets available in Looker for exploration, we developed a Java utility app to accelerate the development of LookML and make it even more fun for developers to create pipelines.
The complete “MPD” solution results in different entities being created in BigQuery with minimal manual intervention. Using this process, we have been able to automate the following:
- The creation of partitioned, columnar tables in BigQuery from JSON samples
- The creation of authorized views in a different GCP BigQuery project (for governance purposes)
- LookML code generation for Looker views
- Job orchestration in a chosen time window
By using this code-based incremental approach with LookML, we were able to incorporate techniques that are traditionally used in DevOps for software development, such as using Lams to validate LookML syntax as a part of the CI process and testing all our definitions and data with Spectacles before they hit production. Applying these principles to our data and business intelligence pipelines has strengthened our continuous intelligence ecosystem. Enabling exploration of that data through Looker and empowering users to easily build their own visualizations has helped us to better engage with stakeholders across the business.
The new data architecture and processes that we have implemented have enabled us to keep up with the growing and ever-changing data from our continuously expanding shipping operations. We have been able to empower a variety of teams to seamlessly develop solutions and manage third party technologies, ensuring that we always know what’s happening – and more critically – enabling us to react in a timely manner when needed.
Outcomes from improving shipping operations:
Today, data is being used to support decision-making in key processes, including:
- Carrier Capacity Optimization
- Outbound Monitoring
- Air Capacity Monitoring
This data-driven approach helps us to better serve you -and everyone- who expects to receive their packages on-time according to our delivery promise. We can proudly say that we have improved both our coverage and speed, delivering 79% of our shipments in less than 48 hours in the first quarter of 2022.
Here is a sneak peek into the data assets that we use to support our day-to-day decision making:
a. Carrier Capacity: Allows us to monitor the percentage of network capacity utilized across every delivery zone and identify where delivery targets are at risk in almost real time.
b. Outbound Places Monitoring: Consolidates the number of shipments that are destined for a place (the physical points where a seller picks up a package), enabling us to both identify places with lower delivery efficiency and drill into the status of individual shipments.
c. The Air Capacity Monitoring: Provides capacity usage monitoring for our aircrafts running each of our shipping routes.
Costs into the equation
The combination of BigQuery and Looker also showed us something we hadn’t seen before: overall cost and performance of the system. Traditionally, developers maintained focus on metrics like reliability and uptime without factoring in associated costs.
By using BigQuery’s information schema, Looker Blocks, and the export of BigQuery logs, we have been able to closely track data consumption, quickly detect underperforming SQL and errors, and make adjustments to optimize our usage and spend.
Based on that, we know the Looker Shipping Ops dashboards generate a concurrency of more than 150 queries, which we have been able to optimize by taking advantage of BigQuery and Looker caching policies.
The challenges ahead
Using BigQuery and Looker has enabled us to solve numerous data availability and data governance challenges: single point access to near real-time data and to historical information, self-service analytics & exploration for operations and stakeholders across different countries & time zones, horizontal scalability (with no maintenance), and guaranteed reliability and uptime (while accounting for costs), among other benefits.
However, in addition to having the right technology stack and processes in place, we also need to enable every user to make decisions using this governed, trusted data. To continue achieving our business goals, we need to democratize access not just to the data but also to the definitions that give the data meaning. This means incorporating our data definitions with our internal data catalog and serving our LookML definitions to other data visualizations tools like Data Studio, Tableau or even Google Sheets and Slides so that users can work with this data through whatever tools they feel most comfortable using.
If you would like a more indepth look at how we made new data streams available from a process we designed called the “Data Producer Model” (“Modelo Productor de Datos” or MPD) register to attend our webcast on August 31.
While learning and adopting new technologies can be a challenge, we are excited to tackle this next phase, and we expect our users will be too, thanks to a curious and entrepreneurial culture. Are our teams ready to face new changes? Are they able to roll out new processes and designs? We’ll go deep on this in our next post.
Spark on Google Cloud: How this Helps Customers with Agility, Cost Reduction and Time Spent on Spark

4877
Of your peers have already read this article.
1:30 Minutes
The most insightful time you'll spend today!
Apache Spark has become a popular platform as it can serve all of data engineering, data exploration, and machine learning use cases. However, Spark still requires the on-premises way of managing clusters and tuning infrastructure for each job. Also, end to end use cases require Spark to be used along with technologies like TensorFlow, and programming languages like SQL and Python. Today, these operate in silos, with Spark on unstructured data lakes, SQL on data warehouses, and TensorFlow in completely separate machine learning platforms. This increases costs, reduces agility, and makes governance extremely hard; prohibiting enterprises from making insights available to the right users at the right time.
Announcing Spark on Google Cloud, now serverless and integrated
We are excited to announce Spark on Google Cloud, bringing industry’s first autoscaling serverless Spark, seamlessly integrated with the best of Google Cloud and open source tools, so you can effortlessly power ETL, data science, and data analytics use cases at scale. Google Cloud has been running large scale business critical Spark workloads for enterprise customers for 6+ years, using open source Spark in Dataproc. Today, we are furthering our commitment by enabling customers to:
- Eliminate time spent managing Spark clusters: With serverless Spark, users submit their Spark jobs, and let them do auto-provision, and autoscale to finish.
- Enable data users of all levels: Connect, analyze, and execute Spark jobs from the interface of users’ choice including BigQuery, Vertex AI or Dataplex, in 2 clicks, without any custom integrations.
- Retain flexibility of consumption: No one size fits all. Use Spark as serverless, deploy on Google Kubernetes Engine (GKE), or on compute clusters based on the requirements.
With Spark on Google Cloud, we are providing a way for customers to use Spark in a cloud native manner (serverless), and seamlessly with tools used by data engineers, data analysts, and data scientists for their use cases. These tools will help customers on their way to realize the data platform redesign they have embarked on.
“Deutsche Bank is using Spark for a variety of different use cases. Migrating to GCP and adopting Serverless Spark for Dataproc allows us to optimize our resource utilization and reduce manual effort so our engineering teams can focus on delivering data products for our business instead of managing infrastructure. At the same time we can retain the existing code base and knowhow of our engineers, thus boosting adoption and making the migration a seamless experience.”—Balaji Maragalla, Director Big Data Platform, Deutsche Bank
“We see serverless Spark playing a central role in our data strategy. Serverless Spark will provide an efficient, seamless solution for teams that aren’t familiar with big data technology or don’t need to bother with idiosyncrasies of Spark to solve their own processing needs. We’re excited about the serverless aspect of the offering, as well as the seamless integration with BigQuery, Vertex AI, Dataplex and other data services.” —Saral Jain, Director of Engineering, Infrastructure and Data, Snap Inc.
Dataproc Serverless for Spark
Per IDC, developers spend 40% time writing code, and 60% of the time tuning infrastructure and managing clusters. Furthermore, not all Spark developers are infrastructure experts, resulting in higher costs and productivity impact. With serverless Spark, developers can spend all their time on the code and logic. They do not need to manage clusters or tune infrastructure. They submit Spark jobs from their interface of choice, and processing is auto-scaled to match the needs of the job. Furthermore, while Spark users today pay for the time the infrastructure is running, with serverless Spark they only pay for the job duration.
Spark through BigQuery
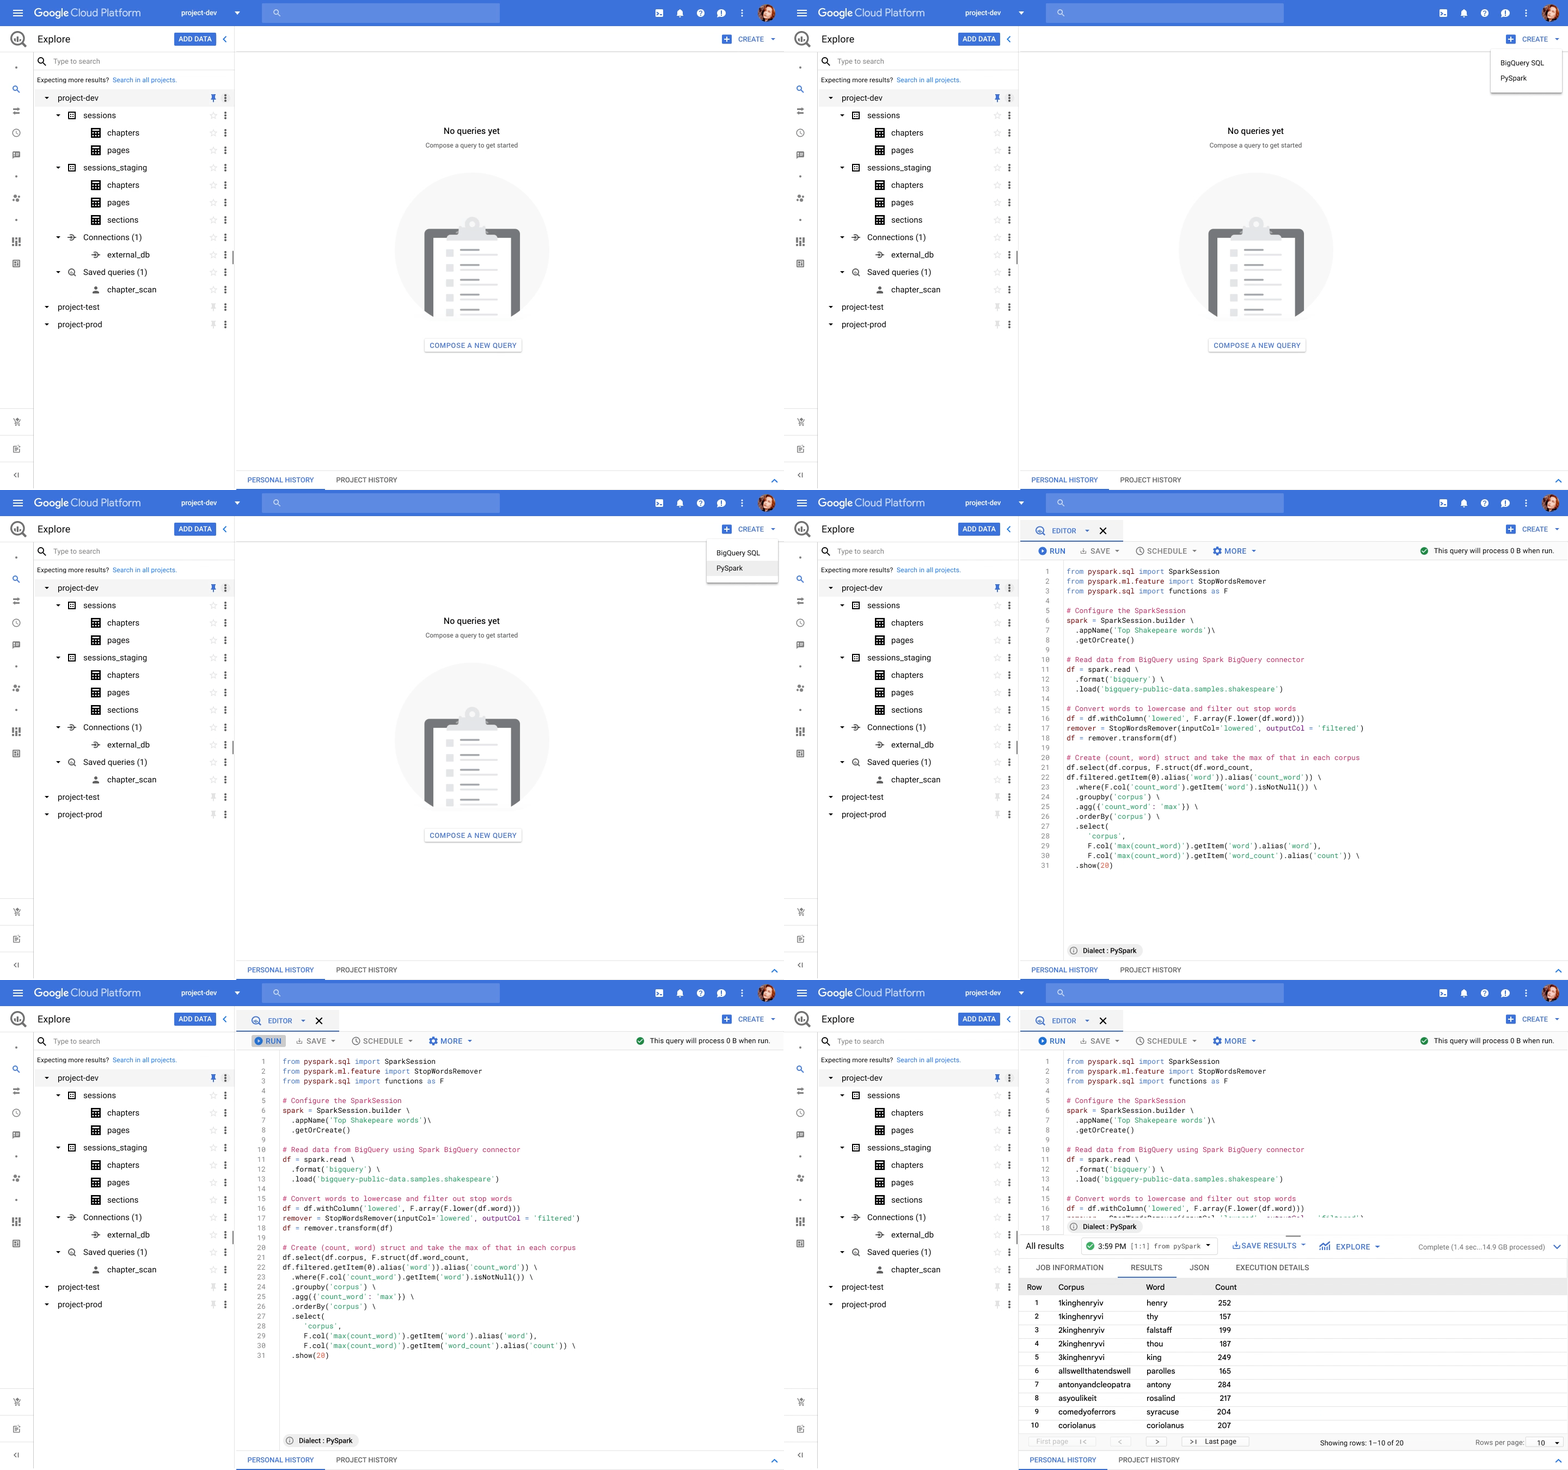
BigQuery, the leading data warehouse, now provides a unified interface for data analysts to write SQL or PySpark. The code is executed using serverless Spark seamlessly, without the need for infrastructure provisioning. BigQuery has been the pioneer for serverless data warehousing, and now supports serverless Spark for Spark-based analytics.
Spark through Vertex AI
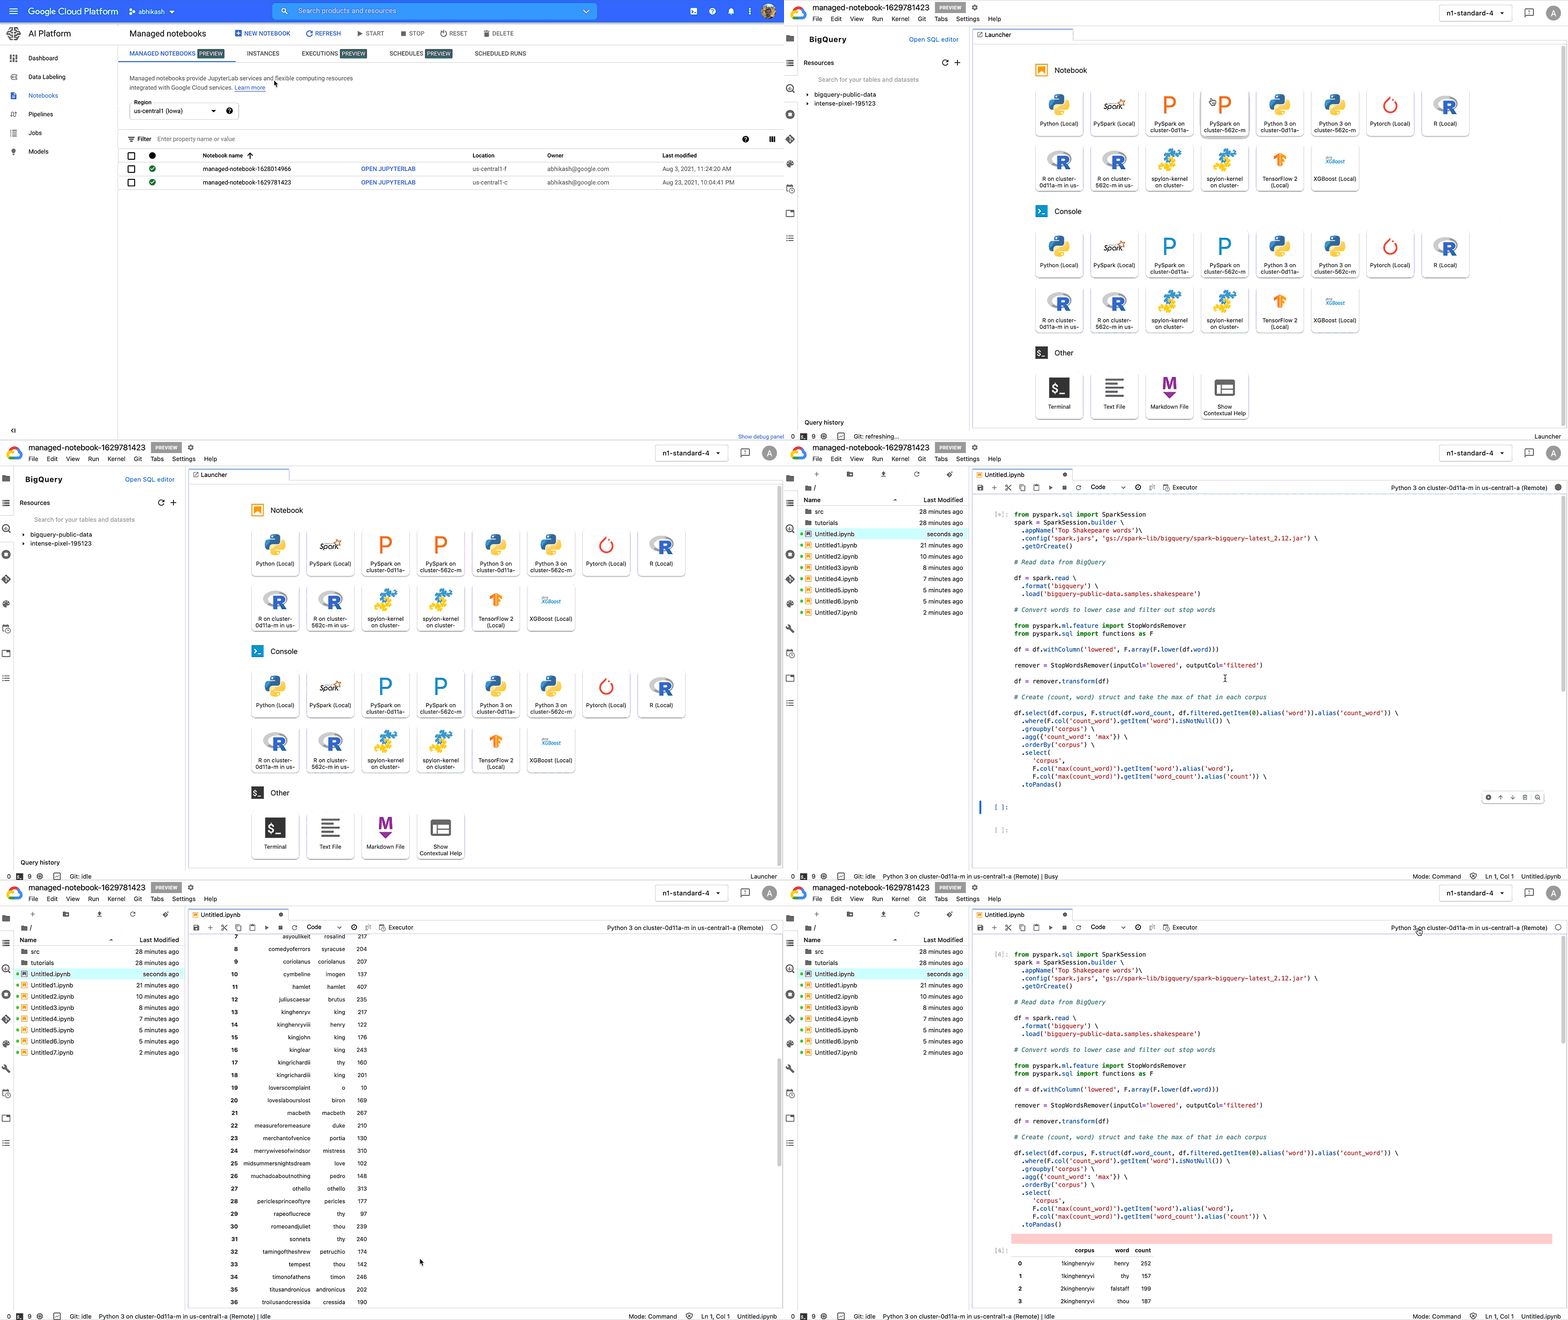
Data scientists no longer need to go through custom integrations to use Spark with their notebooks. Through Vertex AI Workbench, they can connect to Spark with a single click, and do interactive development. With Vertex AI, Spark can easily be used together with other ML frameworks like TensorFlow, Pytorch, Sci-kit learn, and BigQuery ML. All the Google Cloud security, compliance, and IAM are automatically applied across Vertex AI and Spark. Once you are ready to deploy the ML models, the notebook can be executed as a Spark job in Dataproc, and scheduled as part of Vertex AI Pipelines.
Spark through Dataplex
Dataplex is an intelligent data fabric that enables organizations to centrally manage, monitor, and govern their data across data lakes, data warehouses, and data marts with consistent controls, providing access to trusted data and powering analytics at scale. Now, you can use Spark on distributed data natively through Dataplex. Dataplex provides a collaborative analytics interface, with 1-click access to SparkSQL, Notebooks, or PySpark, and the ability to save, share, search notebooks and scripts alongside data.
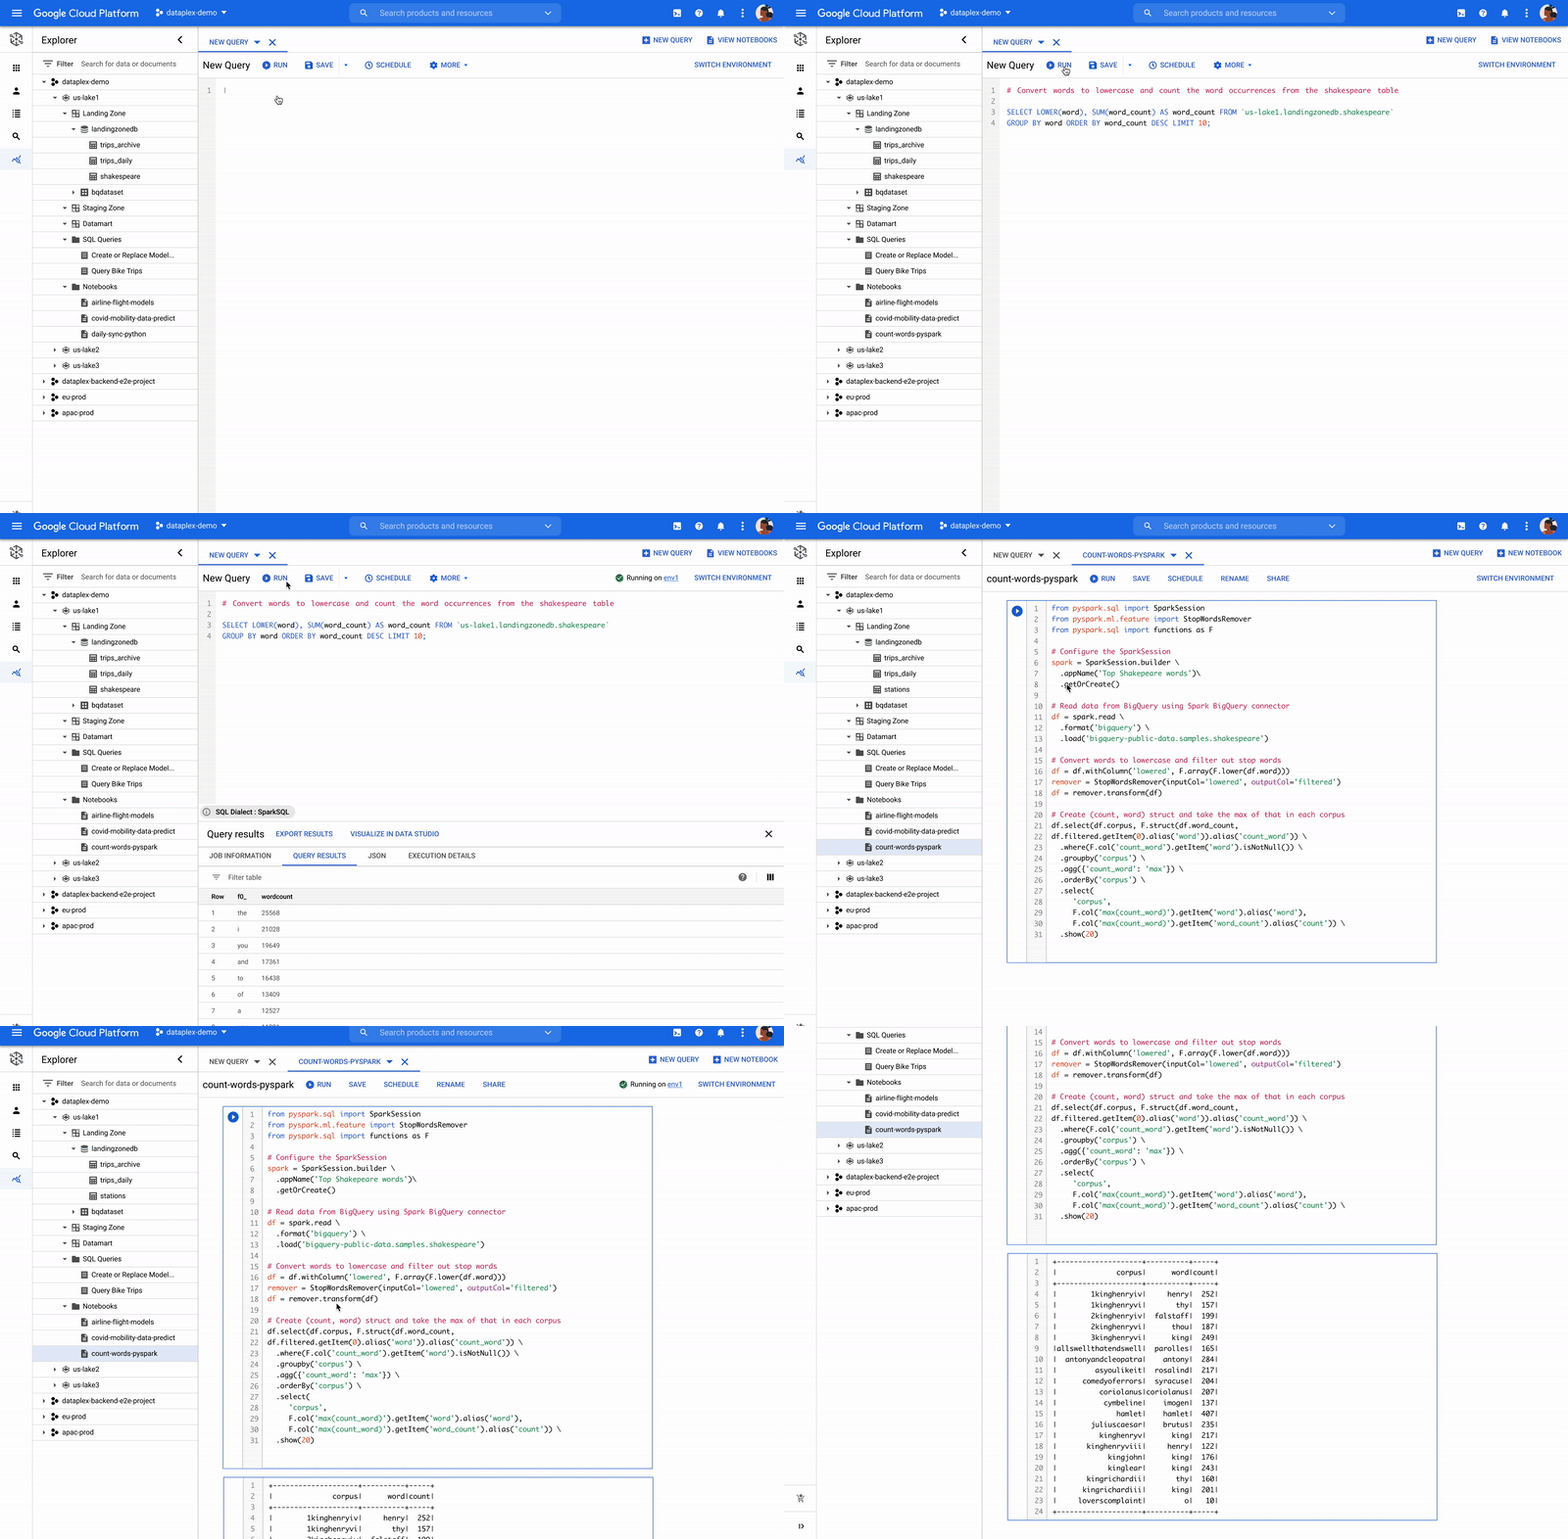
Flexibility of consumption
We understand one size does not fit all. Spark is available for consumption in 3 different ways based on your specific needs. For customers standardizing on Kubernetes for infrastructure management, run Spark on Google Kubernetes Engine (GKE) to improve resource utilization and simplify infrastructure management. For customers looking for Hadoop style infrastructure management, run Spark on Google Compute Engine (GCE). For customers, who’re looking for no-ops Spark deployment, use serverless Spark!
ESG Senior Analyst Mike Leone commented, “Google Cloud is making Spark easier to use and more accessible to a wide range of users through a single, integrated platform. The ability to run Spark in a serverless manner, and through BigQuery and Vertex AI will create significant productivity improvement for customers. Further, Google’s focus on security and governance makes this Spark portfolio useful to all enterprises as they continue migrating to the Cloud.”
Getting started
Dataproc Serverless for Spark will be Generally Available within a few weeks. BigQuery and Dataplex integration is in Private Preview. Vertex AI workbench is available in Public Preview, you can get started here. For all capabilities, you can request for Preview access through this form.
You can work with Google Cloud partners to get started as well.
“We are excited to partner with Google Cloud as we look to provide our joint customers with the latest innovations on Spark. We see Spark being used for a variety of analytics and ML use cases. Google is taking Spark a step further by making it serverless, and available through BigQuery, Vertex AI and Dataplex for a wide spectrum of users.” —Sharad Kumar, Cloud First data and AI Lead at Accenture
For more information, visit our website or the watch announcement video and our conversation with Snap at Next 2021.
Canadian Bank’s SAP Workload Moved to BigQuery Helps Unlock New Business Opportunities

7353
Of your peers have already read this article.
2:00 Minutes
The most insightful time you'll spend today!
When ATB Financial decided to migrate its vast SAP landscape to the cloud, the primary goal was to focus on things that matter to customers as opposed to IT infrastructure. Based in Alberta, Canada, ATB Financial serves over 800,000 customers through hundreds of branches as well as digital banking options. To keep pace with competition from large banks and FinTech startups and to meet the increasing 24/7 demands of customers, digital transformation was a must. To support this new mandate, in 2019, ATB migrated its extensive SAP backbone to Google Cloud. In addition to SAP S/4 HANA, ATB runs SAP financial services, core banking, payment engine, CRM and business warehouse on Google Cloud.
In parallel, changes were needed to ATB’s legacy data platform. The platform had stability and reliability issues and also suffered from a lack of historical data governance. Analytics processes were ad hoc and manual. The legacy data environment was also not set up to tackle future business requirements that come with a high dependency on real-time data analysis and insights.
After evaluating several potential solutions, ATB chose BigQuery as a serverless data warehouse and data lake for its next-generation, cloud-native architecture. “BigQuery is a core component of what we call our data exposure enablement platform, or DEEP,” explains Dan Semmens, Head of Data and AI at ATB Financial. According to Semmens, DEEP consists of four pillars, all of which depend on Google Cloud and BigQuery to be successful:
- Real-time data acquisition: ATB uses BigQuery throughout its data pipeline, starting with sourcing, processing, and preparation, moving along to storage and organization, then discovery and access, and finally consumption and servicing. So far, ATB has ingested and classified 80% of its core SAP banking data as well as data from a number of its third-party partners, such as its treasury and cash management platform provider, its credit card provider, and its call center software.
- Data enrichment: Before migrating to Google Cloud, ATB managed a number of disconnected technologies that made data consolidation difficult. The legacy environment could handle only structured data, whereas Google Cloud and BigQuery lets the bank incorporate unstructured data sets, including sensor data, social network activity, voice, text, and images. ATB’s data enrichment program has enabled more than 160 of the bank’s top-priority insights running on BigQuery, including credit health decision models, financial reporting, and forecasting, as well as operational reporting for departments across the organization. Jobs such as marketing campaigns and month-end processes that used to take five to eight hours now run in seconds, saving over CA$2.24 million in productivity.
- Self-service analytics: Data for self-service reporting, dashboarding, and visualization is now available for ATB’s 400+ business users and data analysts. Previously, bringing data and analytics to the business users who needed it while ensuring security was burdensome for IT, fraught with recurrent data preparation and other highly manual elements. Now, ATB automates much of its data protection and governance controls through the entire data lifecycle management process. Data access is not only open to more team members but it is faster and easier to acquire without compromising security. And it’s not just raw data that users can access. ATB uses BigQuery to define its enterprise data models and create what it calls its data service layer to make it easier for team members to visualize their data.
- AI-assisted analytics and automation: Through Google Cloud and BigQuery, ATB has been able to publish data and ML models that provide alerts and notifications via APIs to customer service agents. These real-time recommendations allow customer service agents to provide more tailored service with contextualized advice and suggested new services. So far, the company has deployed more than 40 ML models to generate over 20,000 AI-assisted conversations per month. Thanks to improved customer advocacy and less churn, the bank has realized more than CA$4 million in operating revenue. During the ongoing COVID crisis, the system was also able to predict when business and personal banking customers were experiencing financial distress so that a relationship manager could proactively reach out to offer support, such as payment deferral or loan restructuring. The AI tools provided by BigQuery are also helping ATB detect fraud that previously evaded rules-based fraud detection by using broader sets of timely and accurate data.
Thanks to the speed and ease of moving data from SAP to BigQuery, ATB is using artificial intelligence (AI) and machine learning (ML) to do things it previously hadn’t thought possible, including sophisticated fraud prevention models, product recommendations, and enriched CRM data that improves the customer experience.
Using the power of Google Cloud and BigQuery, ATB Financial has been able to draw more value from its SAP data while lowering cost and improving security and reliability. Speed to provide data sets and insights to internal team members has improved 30%. The bank also has seen a 15x reduction in performance incidents while improving data governance and security. Dan Semmens projects that the digital transformation strategy built on Google Cloud and BigQuery has both saved millions compared to its on-premises environment and has also realized millions in new business opportunities.
Semmens is looking toward the future that includes initiatives like Open Banking and greater ability to provide real time personalized advice for customers to drive revenue growth. “We see our data platform as foundational to ATB’s 10-year strategy,” he says. “The work we’ve undertaken over the past 18 months has enabled critical functionality for that future.”
Learn more about how ATB Financial is leveraging BigQuery to gain more from SAP data. Visit us here to explore how Google Cloud, BigQuery, and other tools can unlock the full value of your SAP enterprise data.
Become Truly Data-driven with Unified Analytics Platform Built on Google Cloud

3668
Of your peers have already read this article.
2:00 Minutes
The most insightful time you'll spend today!
Every company these days is becoming a data company whether they know it or not. This results in preparing the company to create an ecosystem for data processing. Traditionally, organisations’ data ecosystems consisted of point solutions that used to provide data services. For example, one of the most common questions we get from customers is, “Do I need a data lake, or should I consider a data warehouse? Do you recommend I consider both?” Traditionally, these two architectures have been viewed as separate systems, applicable to specific data types and user skill sets. Increasingly, we are seeing a blurring of lines between data warehouses and data lakes, which provide customers with an opportunity to create a more comprehensive platform that gives them the best of both worlds.
What if we don’t need to compromise? And we create an end-to-end solution compromising the entire data management and processing stages, from data collection to serving. Thus, Data platforms are typically used to store vast amounts of data in varying formats and doing so without compromising on latency. At the same time, providing a platform for all users throughout the data lifecycle.
Emerging Trends
There are data solutions and architectures we’re seeing and anticipating. Emerging concepts include data lakehouses, data meshes, and data vaults. Some are not new and have been around in different shapes and formats, however, all of them work naturally within a Google Cloud environment. Lets look into both ends of the spectrum of enabling data and enabling teams.
Data mesh facilitates a decentralized approach to data ownership, allowing individual lines of business to publish and subscribe to data in a standardized manner, instead of forcing data access and stewardship through a single, centralized team. On the other hand, a data lake house brings raw and processed data closer together, allowing for a more streamlined and centralized repository of data needed throughout the organization. Processing can be done in transit via ELT, reducing the need to copy datasets across systems. This allows for easier data exploration and easier governance. Data vault is designed to separate data driven and model driven parts, so the way data is integrated in the raw vault enables parallel loading so that large implementations can scale out easily.
In Google Cloud, there is no need to keep them separate. In fact, with interoperability among our portfolio of data analytics products, you can easily provide access to data residing in different places, effectively bringing your data lake and data warehouse together on a single platform.
Let’s look at some of the technological innovations that make this reality. BigQuery’s storage API allows treating a data warehouse like a data lake, letting you access the data residing in BigQuery. For example, you can use Spark to access data residing in the data warehouse without it affecting performance of any other jobs accessing it. This is all made possible by the underlying architecture, which separates compute and storage.
We continue to offer specialized products and solutions around data lake and data warehouse functionality but over time we expect to see a significant enough convergence of the two systems that the terminology will change. At Google Cloud, we consider this combination an “analytics data platform”.
Tactical or Strategical
Key differentiators of Google Cloud’s data analytics platform are being open, intelligent, flexible, and tightly integrated. There are many technologies in the market which provide tactical solutions that may feel comfortable and familiar. However, this can be a rather short-term approach that simply lifts and shifts a siloed solution into the cloud. In contrast, an analytics data platform built on Google Cloud provides modern data warehousing and data lake capabilities with close integration to our AI Platform. It also provides built-in streaming, ML, and geospatial capabilities and an in-memory solution for BI use cases. Depending on your organizational data needs, Google Cloud has the set of products, tools, and services to create the right data platform for you.
To become a truly data-driven organization, the first step is to design and implement an analytics data platform that meets your technical and business needs. Whether you want to empower teams to own, publish, and share their data across the organization, or you want to create a streamlined store of raw and processed data for easier discovery, there is a solution that best meets the needs of your company.
To learn more about the elements of a unified analytics data platform built on Google Cloud, and the differences in platform architectures and organizational structures, read our Unified Analytics Platform paper.
How Deutsche Bank used Cloud Composer to orchestrate workloads for financial services

2980
Of your peers have already read this article.
3:30 Minutes
The most insightful time you'll spend today!
Running time-based, scheduled workflows to implement business processes is regular practice at many financial services companies. This is true for Deutsche Bank, where the execution of workflows is fundamental for many applications across its various business divisions, including the Private Bank, Investment and Corporate Bank as well as internal functions like Risk, Finance and Treasury. These workflows often execute scripts on relational databases, run application code in various languages (for example Java), and move data between different storage systems. The bank also uses big data technologies to gain insights from large amounts of data, where Extract, Transform and Load (ETL) workflows running on Hive, Impala and Spark play a key role.
Historically, Deutsche Bank used both third-party workflow orchestration products and open-source tools to orchestrate these workflows. But using multiple tools increases complexity and introduces operational overhead for managing underlying infrastructure and workflow tools themselves.
Cloud Composer, on the other hand, is a fully managed offering that allows customers to orchestrate all these workflows with a single product. Deutsche Bank recently began introducing Cloud Composer into its application landscape, and continues to use it in more and more parts of the business.
“Cloud Composer is our strategic workload automation (WLA) tool. It enables us to further drive an engineering culture and represents an intentional move away from the operations-heavy focus that is commonplace in traditional banks with traditional technology solutions. The result is engineering for all production scenarios up front, which reduces risk for our platforms that can suffer from reactionary manual interventions in their flows. Cloud Composer is built on open-source Apache Airflow, which brings with it the promise of portability for a hybrid multi-cloud future, a consistent engineering experience for both on-prem and cloud-based applications, and a reduced cost basis.
We have enjoyed a great relationship with the Google team that has resulted in the successful migration of many of our scheduled applications onto Google Cloud using Cloud Composer in production.” – Richard Manthorpe, Director Workload Automation, Deutsche Bank
Why use Cloud Composer in financial services
Financial services companies want to focus on implementing their business processes, not on managing infrastructure and orchestration tools. In addition to consolidating multiple workflow orchestration technologies into one and thus reducing complexity, there are a number of other reasons companies choose Cloud Composer as a strategic workflow orchestration product.
First of all, Cloud Composer is significantly more cost-effective than traditional workflow management and orchestration solutions. As a managed service, Google takes care of all environment configuration and maintenance activities. Cloud Composer version 2 introduces autoscaling, which allows for an optimized resource utilization and improved cost control, since customers only pay for the resources used by their workflows. And because Cloud Composer is based on open source Apache Airflow, there are no license fees; customers only pay for the environment that it runs on, adjusting the usage to current business needs.
Highly regulated industries like financial services must comply with domain-specific security and governance tools and policies. For example, Customer-Managed Encryption Keys ensure that data won’t be accessed without the organization’s consent, while Virtual Private Network Service Controls mitigate the risk of data exfiltration. Cloud Composer supports these and many other security and governance controls out-of-the box, making it easy for customers in regulated industries to use the service without having to implement these policies on their own.
The ability to orchestrate both native Google Cloud as well as on-prem workflows is another reason that Deutsche Bank chose Cloud Composer. Cloud Composer uses Airflow Operators (connectors for interacting with outside systems) to integrate with Google Cloud services like BigQuery, Dataproc, Dataflow, Cloud Functions and others, as well as hybrid and multi-cloud workflows. Airflow Operators also integrate with Oracle databases, on-prem VMs, sFTP file servers and many others, provided by Airflow’s strong open-source community.
And while Cloud Composer lets customers consolidate multiple workflow orchestration tools into one, there are some use cases where it’s just not the right fit. For example, if customers have just a single job that executes once a day on a fixed schedule, Cloud Scheduler, Google Cloud’s managed service for Cron jobs, might be a better fit. Cloud Composer in turn excels for more advanced workflow orchestration scenarios.
Finally, technologies based on open source technologies also provide a simple exit strategy from cloud — an important regulatory requirement for financial services companies. With Cloud Composer, customers can simply move their Airflow workflows from Cloud Composer to a self-managed Airflow cluster. Because Cloud Composer is fully compatible with Apache Airflow, the workflow definitions stay exactly the same if they are moved to a different Airflow cluster.
Cloud Composer applied
Having looked at why Deutsche Bank chose Cloud Composer, let’s dive into how the bank is actually using it today. Apache Airflow is well-suited for ETL and data engineering workflows thanks to the rich set of data Operators (connectors) it provides. So Deutsche Bank, where a large-scale data lake is already in place on-prem, leverages Cloud Composer for its modern Cloud Data Platform, whose main aim is to work as an exchange for well-governed data, and enable a “data mesh” pattern.
At Deutsche Bank, Cloud Composer orchestrates the ingestion of data to the Cloud Data Platform, which is primarily based on BigQuery. The ingestion happens in an event-driven manner, i.e., Cloud Composer does not simply run load jobs based on a time-schedule; instead it reacts to events when new data such as Cloud Storage objects arrives from upstream sources. It does so using so-called Airflow Sensors, which continuously watch for new data. Besides loading data into BigQuery, Composer also schedules ETL workflows, which transform data to derive insights for business reporting.
Due to the rich set of Airflow Operators, Cloud Composer can also orchestrate workflows that are part of standard, multi-tier business applications running non-data-engineering workflows. One of the use cases includes a swap reporting platform that provides information about various asset classes, including commodities, credits, equities, rates and Forex. In this application, Cloud Composer orchestrates various services implementing the business logic of the application and deployed on Cloud Run — again, using out-of-the-box Airflow Operators.
These use cases are already running in production and delivering value to Deutsche Bank. Here is how their Cloud Data Platform team sees the adoption of Cloud Composer:
“Using Cloud Composer allows our Data Platform team to focus on creating Data Engineering and ETL workflows instead of on managing the underlying infrastructure. Since Cloud Composer runs Apache Airflow, we can leverage out of the box connectors to systems like BigQuery, Dataflow, Dataproc and others, making it well-embedded into the entire Google Cloud ecosystem.”—Balaji Maragalla, Director Big Data Platforms, Deutsche Bank
Want to learn more about how to use Cloud Composer to orchestrate your own workloads? Check out this Quickstart guide or Cloud Composer documentation today.
More Relevant Stories for Your Company
Data Warehouse Migration Challenges and How to Meet Them
In the last blog post, we discussed why legacy data warehouses are not cutting it any more and why organizations are moving their data warehouses to cloud. At GCP, we often hear that customers feel that migration is an uphill battle because the migration strategy was not deliberately considered. Migrating to

Lending DocAI Shortens Borrowers’ Journey on Roostify
The home lending journey entails processing an immense number of documents daily from hundreds of thousands of borrowers. Currently, home lending document processing relies on some outdated digital models and a high dependency on manual labor, resulting in slow processing times and higher origination costs. Scaling a business that sorts

BigQuery ML for Sentiment Analysis: How to Make the Most of Your Data
Introduction We recently announced BigQuery support for sparse features which help users to store and process the sparse features efficiently while working with them. That functionality enables users to represent sparse tensors and train machine learning models directly in the BigQuery environment. Being able to represent sparse tensors is a

Google Cloud’s Transfer Services Helps Move Nuro’s Petabytes of Data from Edge to the Cloud
Engineers that build last-mile delivery services belong to an elite order, a hallowed subcategory. Delivery customers are incredibly demanding when it comes to speed and convenience, and the services they use must take variables like increased traffic, road conditions, human error, and even driver availability into account every day. Nuro
