





Optimizing Bigtable Performance: Unveiling 20-50% Increase in Single-Row Read Throughput

1273
Of your peers have already read this article.
3:30 Minutes
The most insightful time you'll spend today!
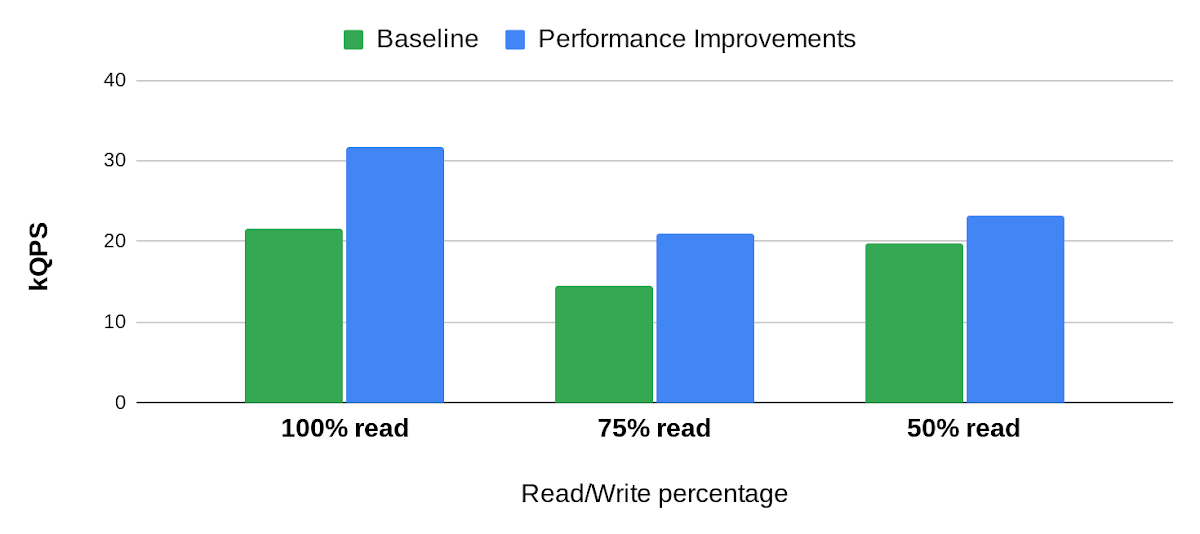
Bigtable is a scalable, distributed, high-performance NoSQL database that processes more than 6 billion requests per second at peak and has more than 10 Exabytes of data under management. Operating at this scale, Bigtable is highly optimized for high-throughput and low-latency reads and writes. Even so, our performance engineering team continually explores new areas to optimize. In this article, we share details of recent projects that helped us push Bigtable’s performance envelope forward, improving single-row read throughput by 20-50% while maintaining the same low latency.
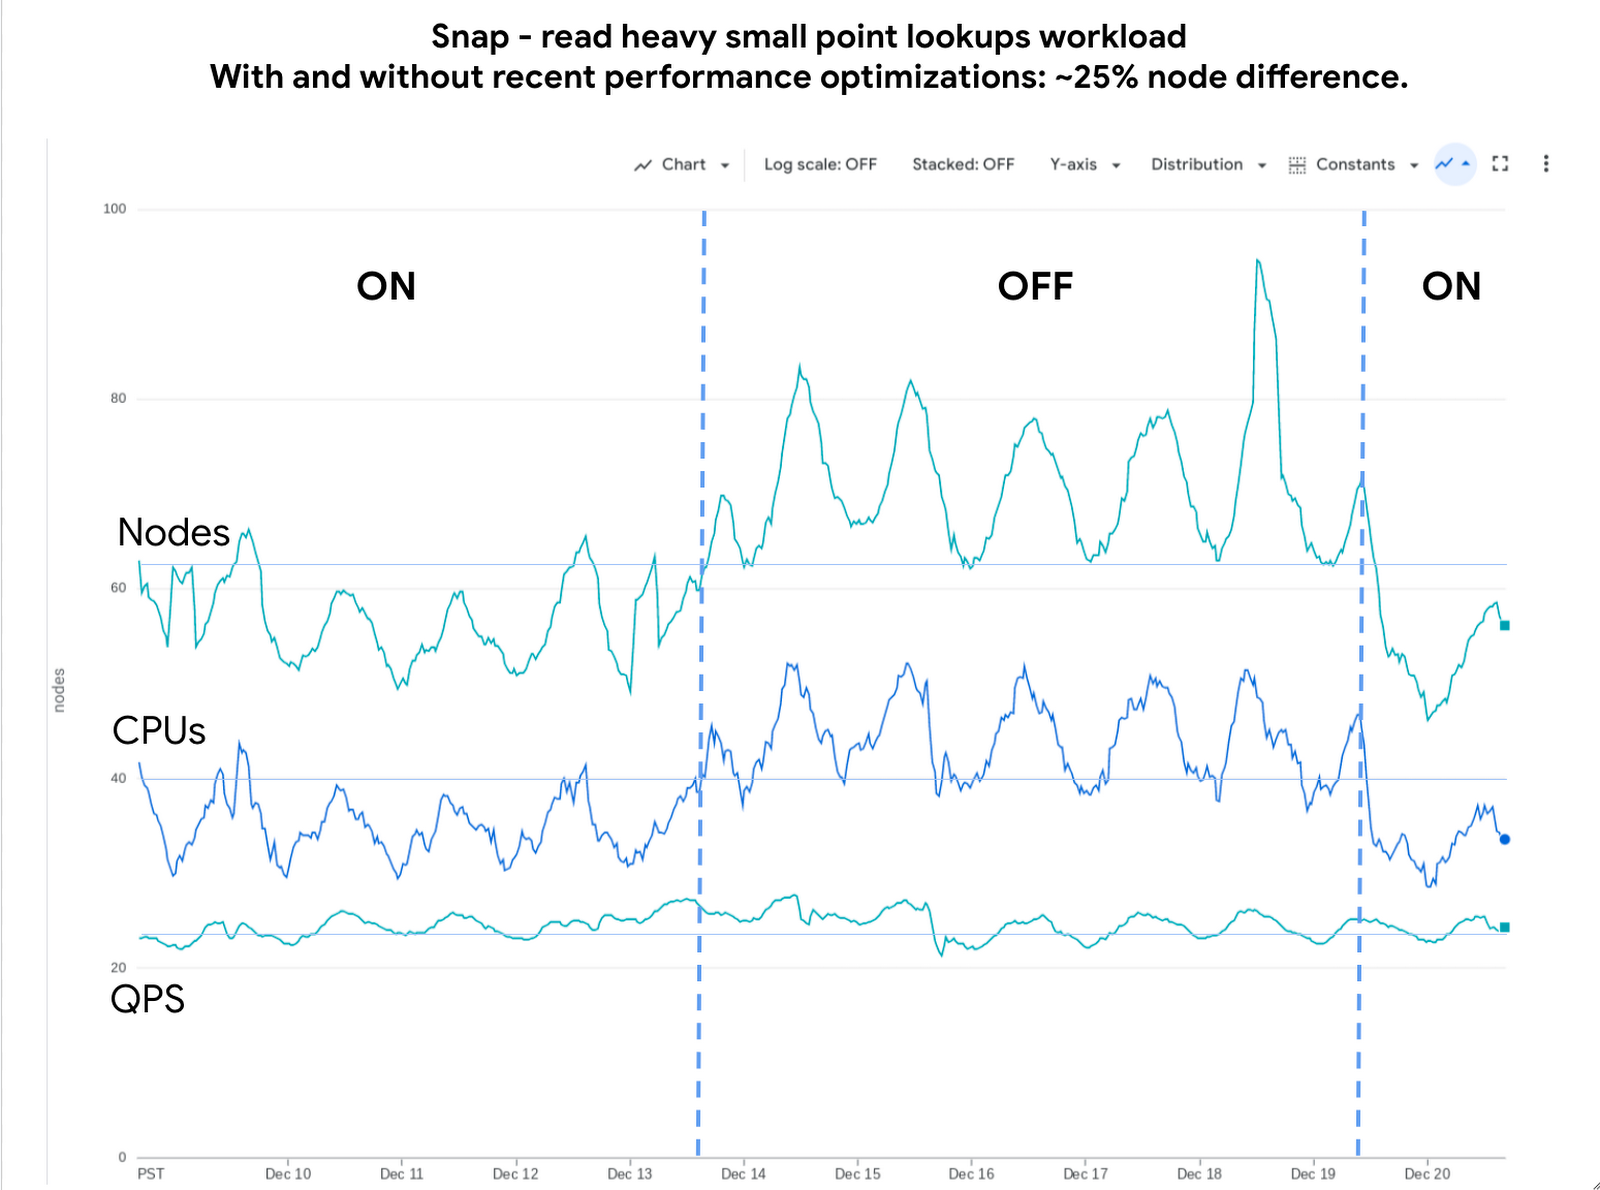
Below is an example of the impact we delivered to one of our customers, Snap. The compute cost for this small-point read-heavy workload reduced by 25% while maintaining the previous level of performance.
Performance research
We use a suite of benchmarks to continuously evaluate Bigtable’s performance. These represent a broad spectrum of workloads, access patterns and data volumes that we see across the fleet. Benchmark results give us a high-level view of performance opportunities, which we then enhance using sampling profilers and pprof for analysis. This analysis plus several iterations of prototyping confirmed feasibility of improvements in the following areas: Bloom filters, prefetching, and a new post-link-time optimization framework, Propeller.
Bloom filters
Bigtable stores its data in a log-structured merge tree. Data is organized into row ranges and each row range is represented by a set of SSTables. Each SSTable is a file that contains sorted key-value pairs. During a point-read operation, Bigtable searches across the set of SSTables to find data blocks that contain values relevant to the row-key. This is where the Bloom filter comes into play. A Bloom filter is a space-efficient probabilistic data structure that can tell whether an item is in a set, it has a small number of false positives (item may be in the set), but no false negatives (item is definitely not in the set). In Bigtable’s case, Bloom filters reduce the search area to a subset of SSTables that may contain data for a given row-key, reducing costly disk access.
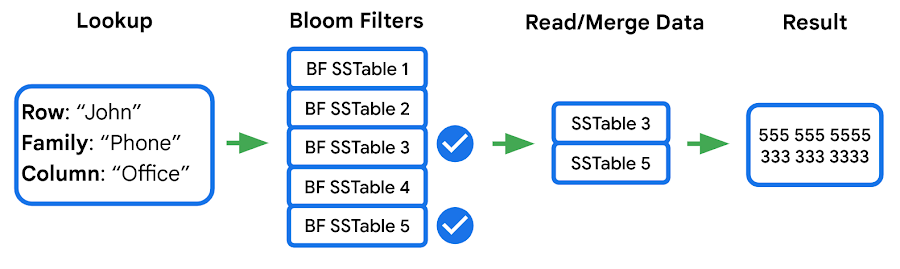
We identified two major opportunities with the existing implementation: improving utilization and reducing CPU overhead.
First, our statistics indicated that we were using Bloom filters in a lower than expected percentage of requests. This was due to our Bloom filter implementation expecting both the “column family” and the “column” in the read filter, while a high percentage of customers filter by “column family” only — which means the Bloom filter can’t be used. We increased utilization by implementing a hybrid Bloom filter that was applicable in both cases, resulting in a 4x increase in utilization. While this change made the Bloom filters larger, the overall disk footprint increased by only a fraction of a percent, as Bloom filters are typically two orders of magnitude smaller than the data they represent.
Second, the CPU cost of accessing the Bloom filters was high, so we made enhancements to Bloom filters that optimize runtime performance:
- Local cache for individual reads: When queries select multiple column families and columns in a single row, it is common that the query will use the same Bloom filter. We take advantage of this by storing a local cache of the Bloom filters used for the query being executed.
- Bloom filter index cache: Since Bloom filters are stored as data, accessing them for the first time involves fetching three blocks — two index blocks and a data block — then performing a binary search on all three. To avoid this overhead we built a custom in-memory index for just the Bloom filters. This cache tracks which Bloom filters we have in our block cache and provides direct access to them.
Overall these changes decreased the CPU cost of accessing Bloom filters by 60-70%.
Prefetching
In the previous section we noted that data for a single row may be stored in multiple SSTables. Row data from these SSTables is merged into a final result set, and because blocks can either be in memory or on disk, there’s a risk of introducing additional latency from filesystem access. Bigtable’s prefetcher was designed to read ahead of the merge logic and pull in data from disk for all SSTables in parallel.
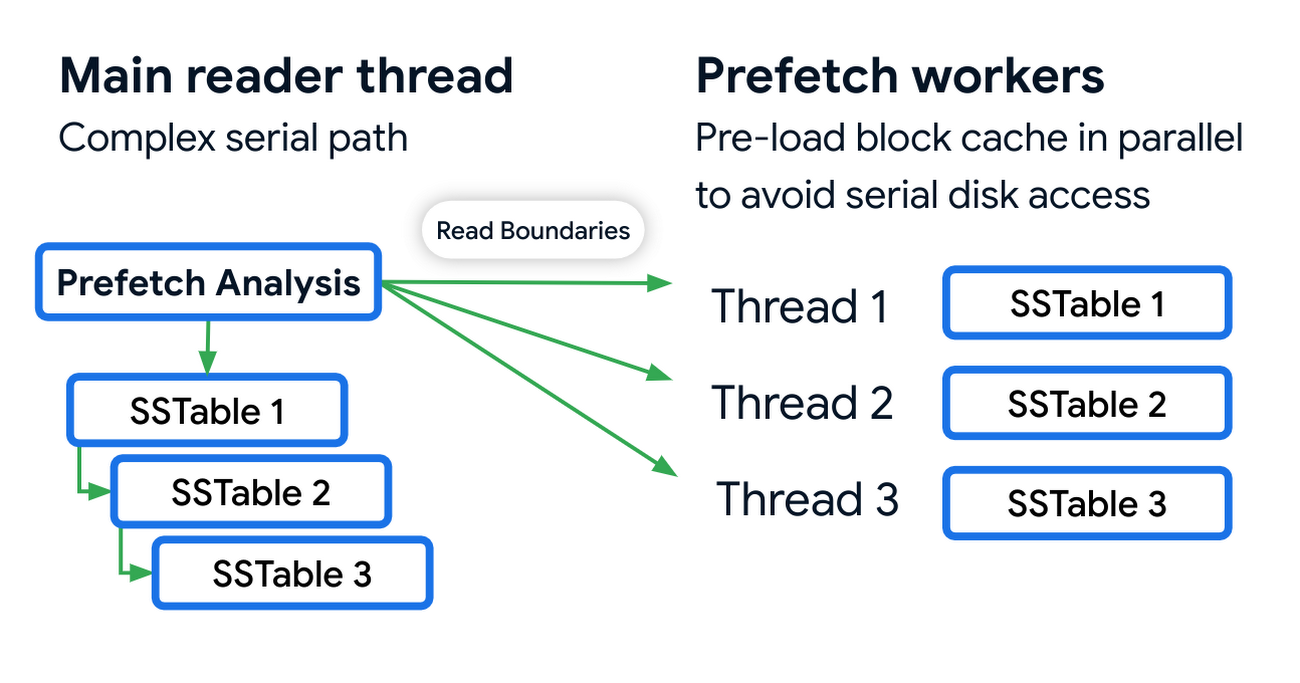
Prefetching has an associated CPU cost due to the additional threading and synchronization overhead. We reduced these costs by optimizing the prefetch threads through improved coordination with the block cache. Overall this reduced the prefetching CPU costs by almost 50%.
Post-link-time optimization
Bigtable uses profile guided optimizations (PGO) and link-time optimizations (ThinLTO). Propeller is a new post-link optimization framework released by Google that improves CPU utilization by 2-6% on top of existing optimizations.
Propeller requires additional build stages to optimize the binary. We start by building a fully optimized and annotated binary that holds additional profile mapping metadata. Then, using this annotated binary, we collected hardware profiles by running a set of training workloads that exercise critical code paths. Finally, using these profiles as input, Propeller builds a new binary with an optimized and improved code layout. Here is an example of the improved code locality.
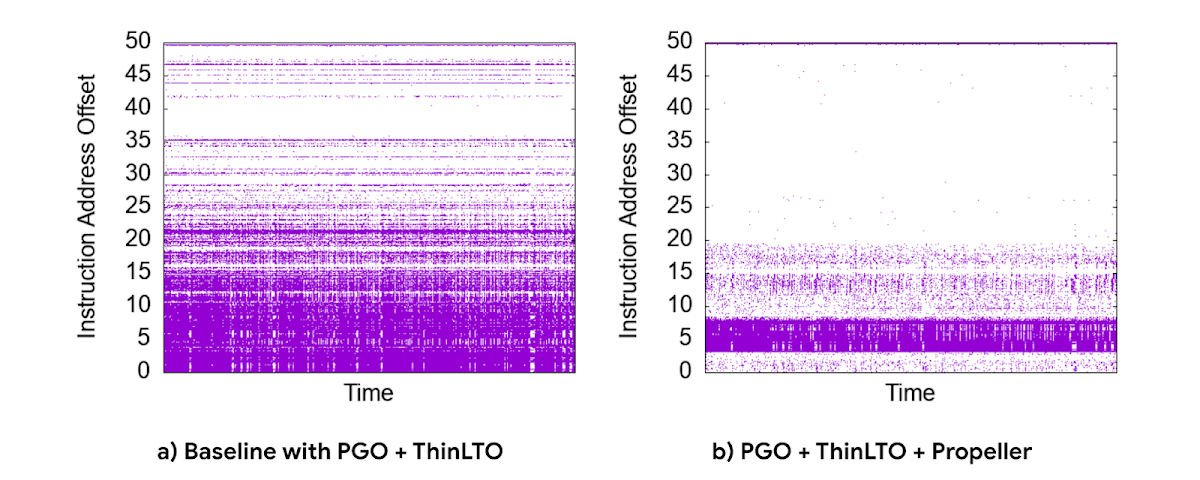
The new build process used our existing performance benchmark suite as a training workload for profile collection. The Propeller optimized binary showed promising results in our tests, showing up to 10% improvement in QPS over baseline.
However, when we released this binary to our pilot production clusters, the results were mixed. It turned out that there was overfitting for the benchmarks. We investigated sources of regression by quantifying profile overlap, inspecting hardware performance counter metrics and applied statistical analysis for noisy scenarios. To reduce overfitting, we extended our training workloads to cover a larger and more representative set of use cases.
The result was a significant improvement in CPU efficiency — reducing fleetwide utilization by 3% with an even more pronounced reduction in read-heavy workloads, where we saw up to a 10% reduction in CPU usage.
Conclusion
Overall, single-row read throughput increased by 20-50% whilst maintaining the same latency profile. We are excited about these performance gains, and continue to work on improving the performance of Bigtable. Click here to learn more about Bigtable performance and tips for testing and troubleshooting any performance issues you may encounter.
Wayfair Writes its Success Story with BigQuery for Internal Analytics

4938
Of your peers have already read this article.
4:00 Minutes
The most insightful time you'll spend today!
Editor’s note: Home-goods and furniture giant Wayfair first partnered up with Google Cloud to transform and scale its storefront—work that proved its value many times over during the unprecedented surge in ecommerce traffic during 2020. Today, we hear how BigQuery’s performance and cost optimization have transformed the company’s internal analytics to create an environment of “yes”.
At Wayfair, we have several unique challenges relating to the scale of our product catalog, our global delivery network, and our position in a multi-sided marketplace that supports both our customers and suppliers. To give you a sense of our scale we have a team of more than 3,000 engineers with tens of millions of customers. We supply more than 20 Million items using more than 16,000 supplier partners.
Serving those constituents generates a lot of analytics work. Wayfair runs over a billion ‘analytic’ database queries a year, from both humans and systems, against multi-petabyte datasets. Scaling our previous environment to meet these challenges required us to maintain dozens of copies of data for different use cases and manage complex data synchronization routines to move trillions of records each day, resulting in long development times and high support costs for our analytics projects.
Centralizing our data using Cloud Storage and BigQuery enabled us to break down existing silos and build unified pipelines for our batch and real-time operations. BigQuery shines by letting us decouple our compute and storage resources and flexibly ingest structured data in streaming and batch modes. We also benefit from the same decoupling for more complicated machine learning (ML) workflows in Dataproc and Cloud Storage. In particular, BigQuery is extremely low maintenance. From ML and easy data integrations to the integrated query cache, many out-of-the-box features have proven valuable for multiple use cases.
Beyond storage and compute, Google Cloud offers multiple tools to maximize the value of our data. For example, we can easily connect Data Studio to BigQuery for lightning-fast dashboarding of enterprise KPI reporting. When we need to dive deeper into a metric, Looker provides an interface and semantic model that empowers more business users to answer important questions — without understanding SQL or our vast dataset and table structure.
The combination of all of Google Cloud’s tools enables every Wayfairian the opportunity to self-serve their data visualization and analysis needs. We are able to support all of the requirements of our internal and external users, from descriptive analytics to alerting and ML, in a platform that blends Google’s proprietary technology with open-source standards.we have seen a greater than 90% reduction in the number of analytic queries in production that take more than one minute to run
As a result, we have seen a greater than 90% reduction in the number of analytic queries in production that take more than one minute to run, which delights our users and increases adoption of our analytics tools across the business.
Higher performance means saying “Yes” more often
We went into the BigQuery experience expecting very strong performance on large, aggregate queries and excellent scalability — the kind of performance that could enable consistent 5-15 minute processing queries and 5-10 second response times for large analytics queries.
We weren’t disappointed — we saw slightly better than linear performance profiles as record counts went up from millions to trillions for a flat resource allocation. BigQuery had the expected high performance for aggregate queries. This made our large data processing pipelines predictable and straightforward to maintain and optimize.
Below is a plot of gigabytes processed by a query against query run time in seconds; outliers are filtered and the axes are pruned to ranges where we had a large sample size. This focuses on longer-duration queries. As an example of the linear performance, a 2 terabyte query averages 5 minutes — 2.5min/terabyte — and an 18 terabyte query (9 times as much data) averages 25s — only 1.4min/terabyte. This is despite the fact that complex queries [sorting and analytic functions are particularly problematic] are more common with large data sizes. We do see increasing variability at large sizes as slot limits and other resource constraints come into play, but these factors are controllable and ultimately a business optimization decision.
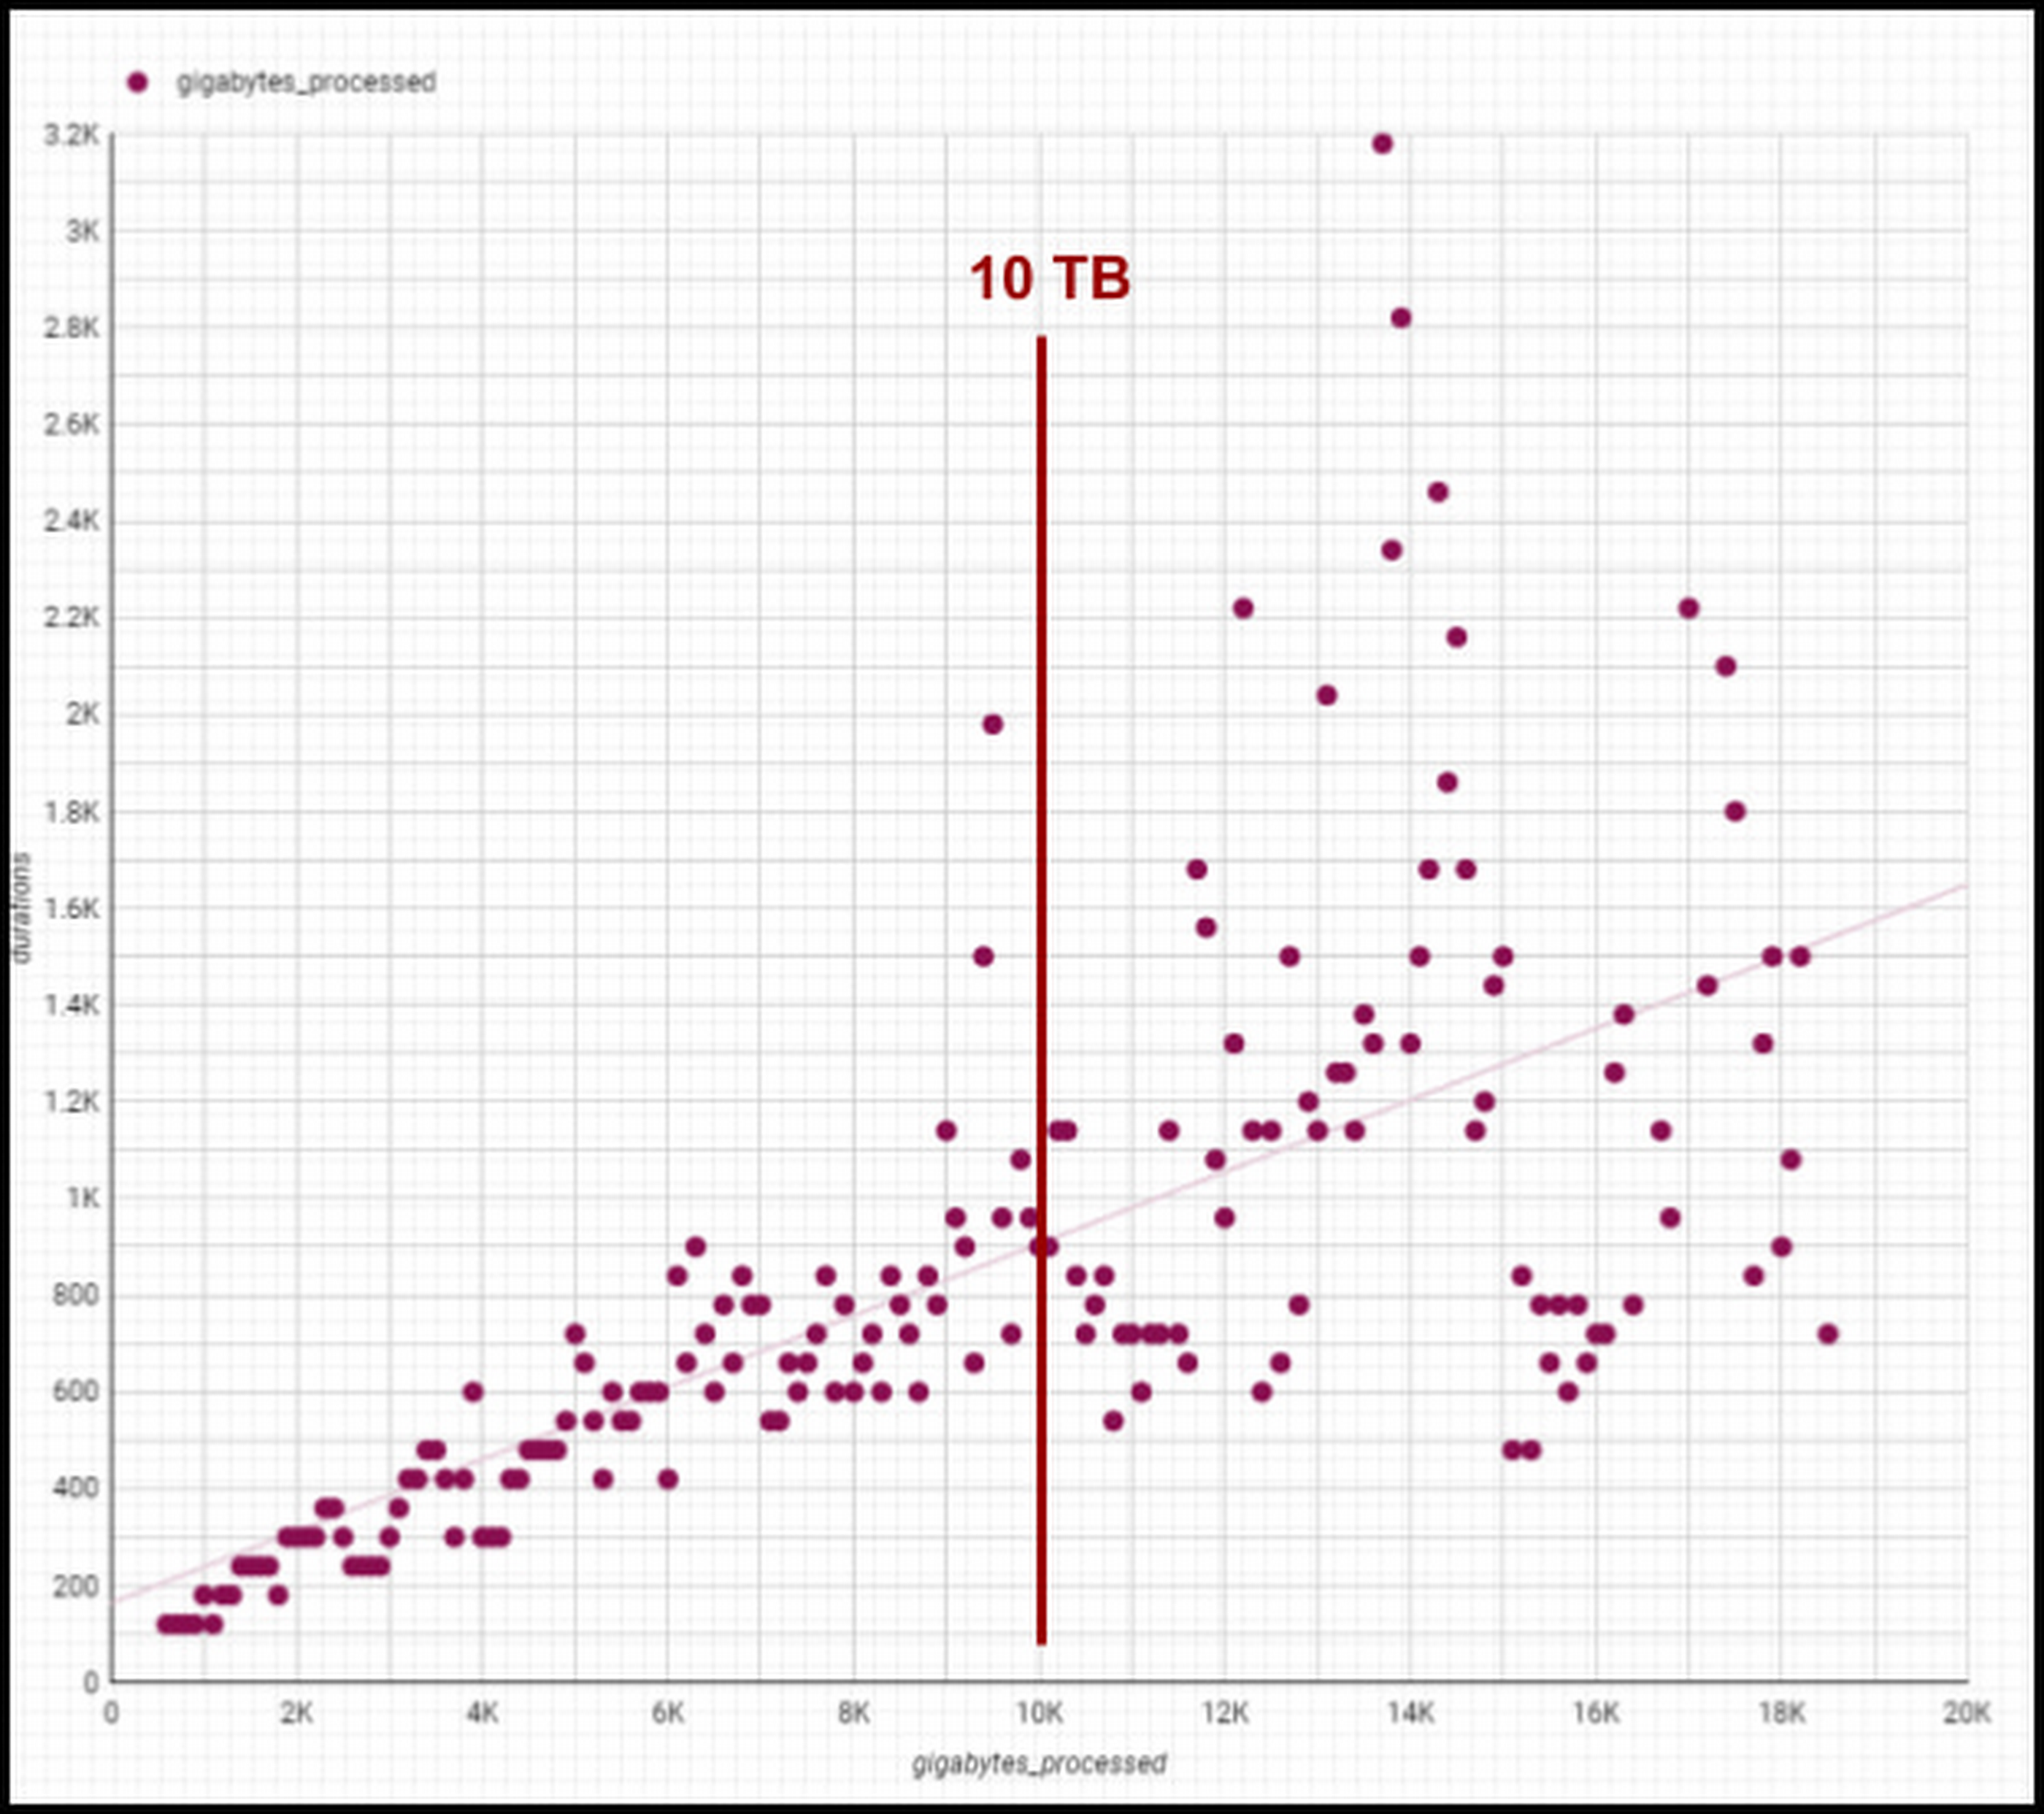
Though individual values vary greatly depending on query complexity [analytic functions/sorting can be computationally expensive], the overall trend line is below 1-1 for bytes versus duration, meaning our BigQuery query runtimes are increasing slower than our data volumes. We are still seeing sub 1:1 threshold runtimes, and we’re already at 100 PB of total data with single queries running on 50PB or more. Going strong!
One unexpected and pleasant surprise has been high performance for smaller queries, such as those required for development, interactive analytics, and internal applications we use for forecasting, segmentation, and other latency-sensitive data workflows. BigQuery’s resource management systems have provided smoother degradation and parallelism profiles than we initially expected for a multi-tenant platform.
We regularly see sub-second p50 query performance for interactive use cases, with p90 performance coming in under 10 seconds for Looker, Data Studio, and AtScale — meeting the threshold we set to avoid analysts losing focus during a business investigation. The chart below shows p50, p90, and p95 timing for core workloads, as well as the number of queries in each bucket and the number of unique users. [Looker and Atscale will use small numbers of service accounts for a large number of users].

This has enabled two important shifts in the way our customers experience analytics services:
- Delivering better user productivity. People no longer have long wait times to get results for a basic query delivering an improved overall user experience.
- Scaling our data transformation. BigQuery has proven, effective data transformation that allows us to embrace the industry shift away towards ELT (extract, load, transform) to transform raw data right within the database.
We no longer have to ask ourselves, “Can we meet the SLA for this data processing task?” The new conversation is, “Of course, we can meet it. What’s the associated cost based on how many resources we assign?” We can make cost and resource trade-offs clear to our users and say “yes” more often to requirements that have measurable business value.
Supporting cost vs. performance decisions
Democratized access to internal analytics is a powerful decision-making tool. With BigQuery’s robust tooling, the decision about how to best allocate computational resources is in the hands of the analytics groups closest to the business decision being made. If they want to spend a sprint optimizing a dashboard, they can show exactly how much money it will save. If they choose not to optimize a report, they can offset the decision with concrete cost savings and other realized value.
Wayfair teams also benefit from visibility into their committed costs by abstracting away the details of the underlying services, including BigQuery slots, the virtual CPUs used to execute SQL queries.
Take a look at this example view consumed by our teams (the metrics for these dashboards are from the BigQuery INFORMATION_SCHEMA (jobs and reservations tables):
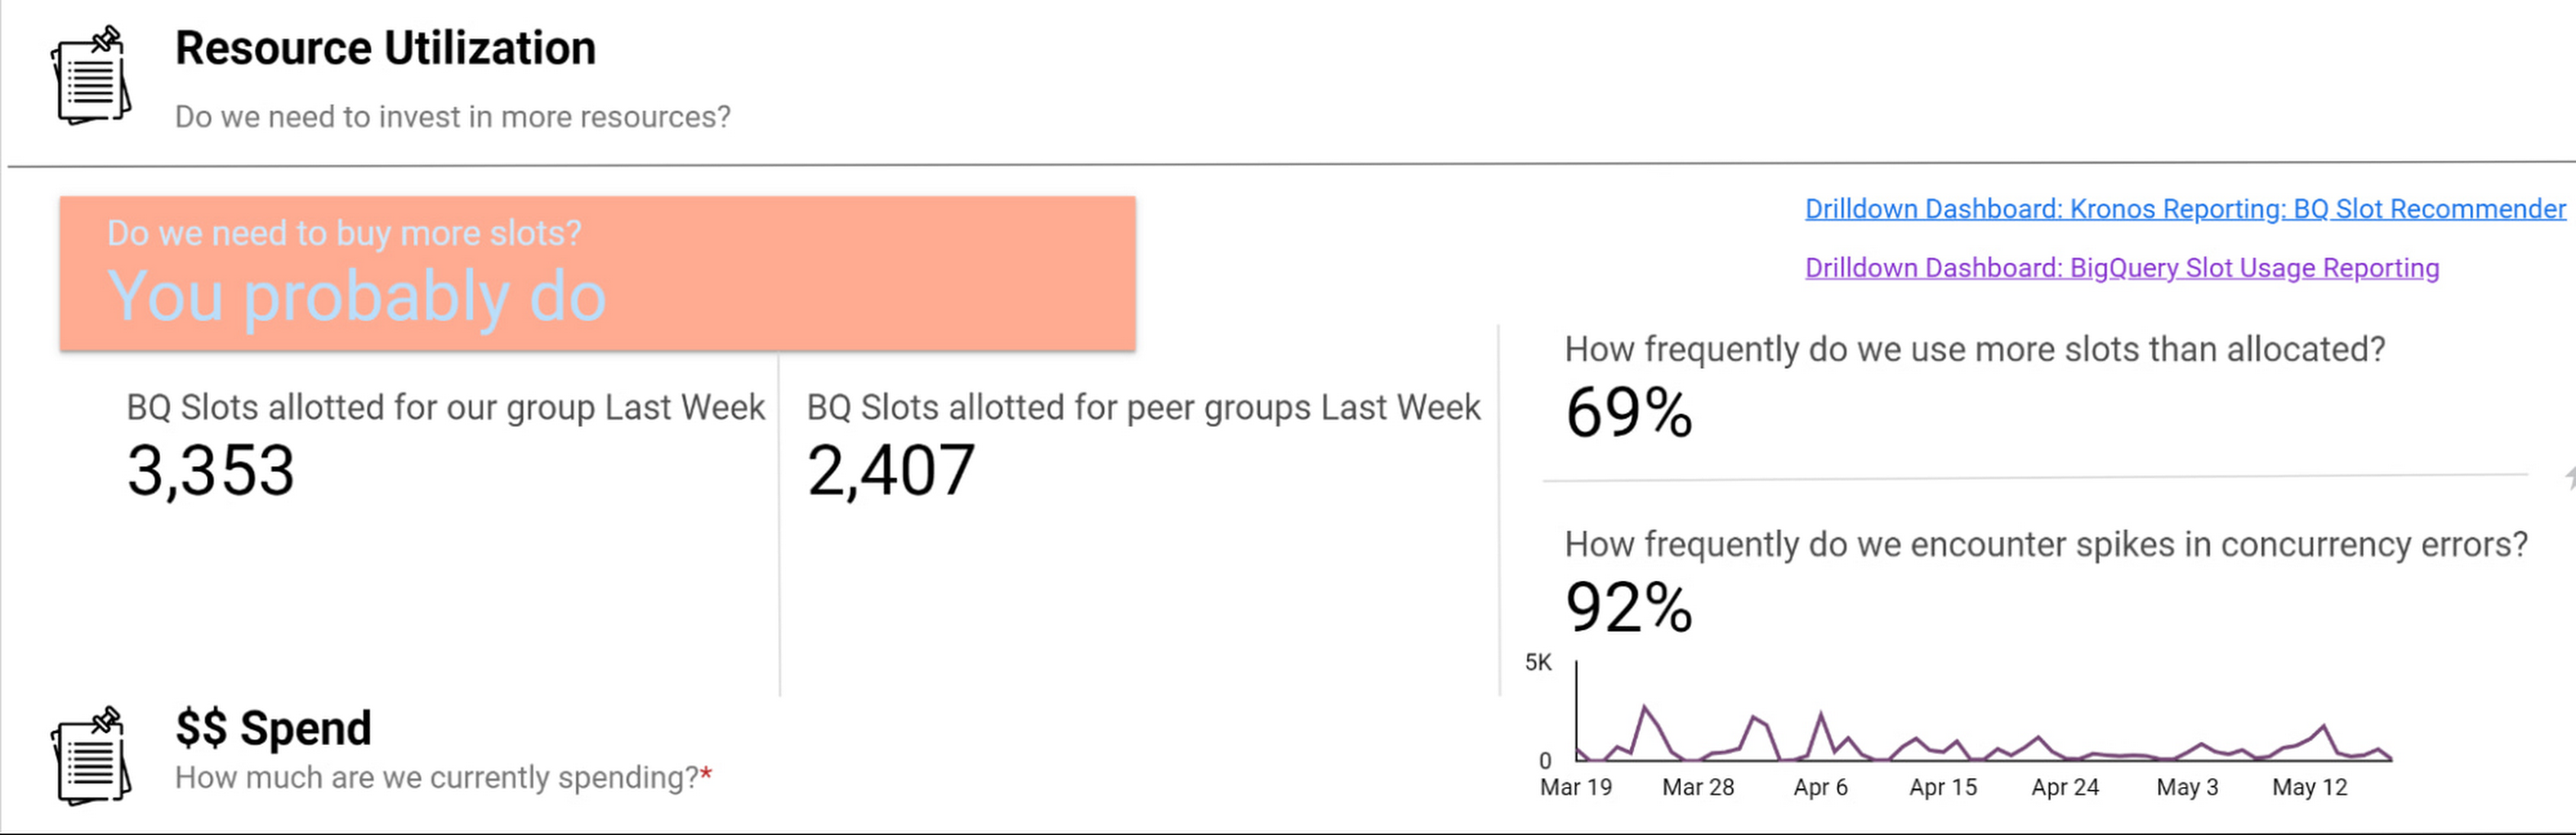
Suppose an organization wants to purchase capacity for a period of time. In that case, we provide an average cost for a slot during that time and charge them based on their slot usage for queries, multiplied by the average price.
Teams can see whether their consumption matches their reservations with a consistent, high-level number. We apply the same approach to tools like Dataproc by aggregating up the costs of component services and providing an organizational cost for those services.
How we use performance signals to improve user efficiency
Instead of overcorrecting for occasional performance fluctuations by allocating excessive resources, we try to align incentives so that people make the right choices for the business. Showback doesn’t work in a vacuum — it requires context and integrated insights. Teams need to show the cost of running a dashboard as well as the ROI is in terms of end user engagement and what peer dashboards with equivalent source datasets might cost.
We want to give users the freedom to do things the way they want and need to while also educating them on achieving their goals and using best practices to reduce their costs and improve their performance. The goal is never for all dashboards to load “less than x seconds” — we believe that any dashboard can load in x seconds when it is properly designed and resourced.
For instance, BigQuery allocates slots for a new workload quickly and efficiently, and queries that are optimized and have dedicated resources consistently complete quickly. When users experience a slowdown, it’s typically because they are sharing resources or inefficiently using their resources. Variable performance is a useful signal to help users discover opportunities to optimize queries and work more productively. We value these signals as we like to focus on the aggregate experience of all users interacting with the tool, not individual interaction.
A natural way to improve user efficiency is to reward ideal behaviors and discourage those that do not align with our analytics strategy. Some examples include splitting out high-demand reporting from ad-hoc exploration to reduce concurrency errors or encouraging people to use materialized tables instead of writing complex custom SQL. For instance, a dedicated reporting project might only include an organization’s Data Studio dashboard if it directly references a table or meets other optimization requirements. Using this approach, we give our users a high degree of freedom and experimentation at the entry-level while providing a well-documented path to scale.
Visibility into query performance improves business performance
The detailed tracking information we get from Google Cloud products is critical — Google’s robust analytics performance has enabled us to scale Data Studio to over 15,000 Wayfarians. Of course, a larger user base always comes with concerns that less sophisticated users may not appropriately optimize their queries or make the best use of the infrastructure.
Evaluating the different Data Studio dashboards helps us identify opportunities to use better query optimization practices, such as reducing custom queries, connecting directly to permanent tables, or using the BI Engine to improve dashboard performance. Recently, our team built new billing projects specific for Data Studio reporting. We can scale up a reservation dedicated to reporting about a major sales event in minutes.
Beyond everyday reporting, holidays and sales events may require higher, guaranteed performance. BigQuery’s flexible capacity commitments allow us to decide at a business level whether an urgent need requires us to reprioritize resources immediately or whether we have the time to optimize queries and rebuild dashboards to be performant. These new billing projects let us evaluate if teams need to scale up resourcing, what areas they can optimize in BigQuery, or if a new reservation is needed to resource that team separately.
Recommendations for achieving high performance at low cost
Are you wondering how to allocate BigQuery slots? Teams must see direct, immediate return on their investment in performance and optimization.
Our first rule of thumb is to align resource utilization with ownership as closely as possible. This makes it easier for teams to secure dedicated resources, even if they start out small. We’re comfortable doing this because BigQuery dynamically reassigns capacity between the targeted reservation and other consumers in milliseconds. We always get the total usage of our slots — there is no wasted capacity even when we break assignments down granularly.
Once a team has a reservation, we provide reporting that consumes various BigQuery information schema views, such as query logs and reservation information, and processes it into aggregated reporting. We look for metrics like the average slots available to a query at a point in time, overall query performance, and how long queries took to execute to pinpoint the overall health of a reservation against our business objectives. Flex slots also let us experiment easily with additional capacity, and BigQuery’s performance is so consistent that we can use straightforward models to estimate return on additional slot investment.
Other key cost optimization tips we have found helpful at Wayfair include:
- Optimize for worst-case performance. Given BigQuery’s ability to share slots, we expect teams will often see much better performance, but we find that thinking it’s more effective when teams think about the most pessimistic case when resourcing their jobs.
- Take advantage of BI Engine reservations. We like to think critically about the data and workload. BI Engine reservations are excellent for workloads that query lots of small dimension tables or a few larger tables loaded into memory. In cases like that, such as with OLAP tools using pre-computed aggregates, we’ve seen BI engine investments drive a 25% reduction in average query time—excellent ROI.
- Leverage Looker for large, longitudinal datasets. Since Looker supports a wide range of use cases, we see a broader range of performance — p50 is still under a second, but p95 can get as high as a minute. For these cases, we recommend modeling user patterns [first of month, first day of week] and dynamically allocating more slots for these periods while deprioritizing batch workloads in the key windows.
- Lean in heavily on the BQ cache for broad-based reporting. To avoid a Monday morning reporting lag, We use the BigQuery cache to avoid Monday morning report loading lags. Up to 30% of our Data Studio queries hit the BQ cache, ensuring our Data Studio p95 consistently stays under 10 seconds.
- Use slots-per-job to improve experience. In our reporting, we find that the most valuable view is slots-per-job. We look for dips in slots available for jobs as this situation often correlates strongly with poor user experiences. For example, our reporting showed us that Looker has the highest volumes of queries and users on Mondays and during each month’s first two business days. We used this information to scale up slots to support these periods of highest demand, delivering on performance SLAs to support business users.

- Get a global picture of usage. We manage slots in a central tool. Teams input their requirements into a calendar to indicate when they want higher or lower capacity to inform our flex slot purchases and annual commitments. It might seem like dozens of relatively inconsistent workloads at the team level, but the picture changes when you look at demand across a week (or our entire business). Understanding global usage makes it easy for us to model baseline capacity recommendations for serving year slots versus flexible demands.
Reaping the rewards of BigQuery
From our first initial undertaking with Google Cloud to transform our storefront, we had a lot of confidence in the underlying technology offerings and the teams that ran them and their ability to meet our unique requirements. But our experience using BigQuery for internal analytics at Wayfair has exceeded our already high expectations.
BigQuery’s fast, dynamic allocation of resources and ability to transform data in place are important to our mission of maintaining consistently high performance for our users while closely managing costs. Moreover, our visibility into query and dashboard performance through BigQuery’s DSP views and other performance metrics have helped us make clearer connections between performance goals and the costs required to meet them — and guide our analysts across the company towards attaining high performance on every project.
A Breakdown of Cloud-based Data Ingestion Practices

8833
Of your peers have already read this article.
3:00 Minutes
The most insightful time you'll spend today!
Businesses around the globe are realizing the benefits of replacing legacy data silos with cloud-based enterprise data warehouses, including easier collaboration across business units and access to insights within their data that were previously unseen. However, bringing data from numerous disparate data sources into a single data warehouse requires you to develop pipelines that ingest data from these various sources into your enterprise data warehouse. Historically, this has meant that data engineering teams across the organization procure and implement various tools to do so. But this adds significant complexity to managing and maintaining all these pipelines and makes it much harder to effectively scale these efforts across the organization. Developing enterprise-grade, cloud-native pipelines to bring data into your data warehouse can alleviate many of these challenges. But, if done incorrectly, these pipelines can present new challenges that your teams will have to spend their time and energy addressing.
Developing cloud-based data ingestion pipelines that replicate data from various sources into your cloud data warehouse can be a massive undertaking that requires significant investment of staffing resources. Such a large project can seem overwhelming and it can be difficult to identify where to begin planning such a project. We have defined the following principles for data pipeline planning to begin the process. These principles are intended to help you answer key business questions about your effort and begin to build data pipelines that address your business and technical needs. Each section below details a principle of data pipelines and certain factors your teams should consider as they begin developing their pipelines.
Principle 1: Clarify your objectives
The first principle to consider for pipeline development is clarify your objectives. This can be broadly defined as taking a holistic approach to pipeline development that encompasses requirements from several perspectives: technical teams, regulatory or policy requirements, desired outcomes, business goals, key timelines, available teams and their skill sets, and downstream data users. Clarifying your objectives clearly identifies and defines requirements from each key stakeholder at the beginning of the process and continually checks development against these requirements to ensure the pipelines built will meet these requirements.This is done by first clearly defining the desired end state for each project in a way that addresses a demonstrated business need of downstream data users. Remember that data pipelines are almost always the means to accomplish your end state, rather than the end state itself. An example of an effectively defined end-state is “enabling teams to gain a better understanding of our customers by providing access to our CRM data within our cloud data warehouse” rather than “move data from our CRM to our cloud data warehouse”. This may seem like a merely semantic difference, but framing the problem in terms of business needs helps your teams make technical decisions that will best meet these needs.
After clearly defining the business problem you are trying to solve, you should facilitate requirement gathering from each stakeholder and use these requirements to guide the technical development and implementation of your ingestion pipelines. We recommend gathering stakeholders from each team, including downstream data users, prior to development to gather requirements for the technical implementation of the data pipeline. These will include critical timelines, uptime requirements, data update frequency, data transformation, DevOps needs, and security, policy, or regulatory requirements by which a data pipeline must meet.
Principle 2: Build your team
The second principle to consider for pipeline development is build your team. This means ensuring you have the right people with the right skills available in the right places to develop, deploy, and maintain your data pipelines. After you have gathered your pipeline requirements, you can begin to develop a summary architecture that will be used to build and deploy your data pipelines. This will help you identify the human talent you will need to successfully build, deploy, and manage these data pipelines and identify any potential shortfalls that would require additional support from either third-party partners or new team members.
Not only do you need to ensure you have the right people and skill sets available in aggregate, but these individuals need to be effectively structured to empower them to maximize their abilities. This means developing team structures that are optimized for each team’s responsibilities and their ability to support adjacent teams as needed.
This also means developing processes that prevent blockers to technical development whenever possible, such as ensuring that teams have all of the appropriate permissions they need to move data from the original source to your cloud data warehouse without violating the concept of least privilege. Developers need access to the original data source (depending on your requirements and architecture) in addition to the destination data warehouse. Examples of this are ensuring that developers have access to develop and/or connect to a Salesforce Connected App or read access to specific Search Ads 360 data fields.
Principle 3: Minimize time to value
The third principle to consider for pipeline development is minimize time to value. This means considering the long-term maintenance burden of a data pipeline prior to developing and deploying it in addition to being able to deploy a minimum viable pipeline as quickly as possible. Generally speaking, we recommend the following approach to building data pipelines to minimize their maintenance burden: Write as little code as possible. Functionally, this can be implemented by:
1. Leveraging interface-based data ingestion products whenever possible. These products minimize the amount of code that requires ongoing maintenance and empower users who aren’t software developers to build data pipelines. They can also reduce development time for data pipelines, allowing them to be deployed and updated more quickly.
- Products like Google Data Transfer Service and Fivetran allow for managed data ingestion pipelines by any user to centralize data from SaaS applications, databases, file systems, and other tooling. With little to no code required, these managed services enable you to connect your data warehouse to your sources quickly and easily.
- For workloads managed by ETL developers and data engineers, tools like Google Cloud’s Data Fusion provide an easy-to-use visual interface for designing, managing and monitoring advanced pipelines with complex transformations.
2. Whenever interface-based products or data connectors are insufficient, use pre-existing code templates. Examples of this include templates available for Dataflow that allow users to define variables and run pipelines for common data ingestion use cases, and the Public Datasets pipeline architecture that our Datasets team uses for onboarding.
3. If neither of these options are sufficient, utilize managed services to deploy code for your pipelines. Managed services, such as Dataflow or Dataproc, eliminate the operational overhead of managing pipeline configuration by automatically scaling pipeline instances within predefined parameters.
Principle 4: Increase data trust and transparency
The fourth principle to consider for pipeline development is increase data trust and transparency. For the purposes of this document, we define this as the process of overseeing and managing data pipelines across all tools. Numerous data ingestion pipelines that each leverage different tools or are not developed under a coordinated management plan can result in “tech sprawl”, which significantly increases the management overhead of data ingestion pipelines as the quantity of data pipelines increases. This becomes especially cumbersome if you are subject to service-level agreements, or legal, regulatory, or policy requirements for overseeing data pipelines. Preventing tech sprawl is, by far, the best strategy for dealing with it by developing streamlined pipeline management processes that automate reporting. Although this can theoretically be achieved by building all of your data pipelines using a single cloud-based product, we do not recommend doing so because it prevents you from taking advantage of features and cost optimizations that come with choosing the best product for your use case.
A monitoring service such as Google Cloud Monitoring Service or Splunk that automates metrics, events, and metadata collection from various products, including those hosted in on-premise and hybrid computing environments, can help you centralize reporting and monitoring of your data pipelines. A metadata management tool such as Google Cloud’s Data Catalog or Informatica’s Enterprise Data Catalog can help you better communicate the nuances of your data so users better understand which data resources are best fit for a given use case. This significantly reduces your pipeline’s governance burden by eliminating manual reporting processes that often result in inaccuracies or lagging updates.
Principle 5: Manage costs
The fifth principle to consider for pipeline development is manage costs. This encompasses both the cost of cloud resources and the staffing costs necessary to design, develop, deploy, and maintain your cloud resources. We believe that your goal should not necessarily be to minimize cost, but rather maximizing the value of your investment. This means maximizing the impact of every dollar spent by minimizing waste in cloud resource utilization and human time. There are several factors to consider when it comes to managing costs:
- Use the right tool for the job – Different data ingestion pipelines will have different requirements for latency, uptime, transformations, etc. Similarly, different data pipeline tools have different strengths and weaknesses. Choosing the right tool for each data pipeline can help your pipelines operate significantly more efficiently. This can reduce your overall cost, free up staffing time to focus on the most impactful projects, and make your pipelines much more efficient.
- Standardize resource labeling – Implement and utilize a consistent labeling schema across all tools and platforms to have the most comprehensive view of your organization’s spending. One example is requiring all resources to be labeled by the cost center or team at time of creation. Consistent labeling allows you to monitor your spend across different teams and calculate the overall value of your cloud spending.
- Implement cost controls – If available, leverage cost controls to prevent errors that result in unexpectedly large bills.
- Capture cloud spend – Capture your spend on all cloud resource utilization for internal analysis using a cloud data warehouse and a data visualization tool. Without it, you won’t understand the context of changes in cloud spend and how they correlate with changes in business.
- Make cost management everyone’s job – Managing costs should be part of the responsibilities of everyone who can create or utilize cloud resources. To do this well, we recommend making cloud spend reporting more transparent internally and/or implementing chargebacks to internal cost centers based on utilization.
Long-term, the increased granularity in cost reporting available within Google Cloud can help you better measure your key performance indicators. You can shift from cost-based reporting (i.e. – “We spent $X on BigQuery storage last month”) to value-based reporting (i.e. – “It costs $X to serve customers who bring in $Y revenue”).
To learn more about managing costs, check out Google Cloud’s “Understanding the principles of cost optimization” white paper.
Principle 6: Leverage continually improving services
The sixth principle is leverage continually improving services. Cloud services are consistently improving their performance and stability, even if some of these improvements are not obvious to users. These improvements can help your pipelines run faster, cheaper, and more consistently over time. You can take advantage of the benefits of these improvements by:
- Automating both your pipelines and pipeline management: Not only should data pipelines be automated, but almost all aspects of managing your pipelines can also be automated. This includes pipeline/data lineage tracking, monitoring, cost management, scheduling, access management and more. This helps reduce long-term operational costs of each data pipeline that can significantly alter your value proposition and prevent any manual configurations from negating the benefits of later product improvements.
- Minimizing pipeline complexity whenever possible: While ingestion pipelines are relatively easy to develop using UI-based or managed services, they also require continued maintenance as long as they are in use. The most easily maintained data ingestion pipelines are typically the ones that minimize complexity and leverage automatic optimization capabilities. Any transformation in a data ingestion pipeline is a manual optimization of the pipeline that may struggle to adapt or scale as the underlying services improve. You can minimize the need for such transformations by building ELT (extract, load, transform) pipelines rather than ETL (extract, transform, load) pipelines. This pushes transformations down to the data warehouse that is use a specifically optimized query engine to transform your data rather than manually configured pipelines.
Next steps
If you’re looking for more information about developing your cloud-based data platform, check out our Build a modern, unified analytics data platform whitepaper. You can also visit our data integration site to learn more and find ways to get started with your data integration journey.
Once you’re ready to begin building your data ingestion pipelines, learn more about how Cloud Data Fusion and Fivetran can help you make sure your pipelines address these principles.
Google Cloud Helped Digitec Galaxus Personalize Over 2 Million Newsletters in a Week

8306
Of your peers have already read this article.
3:00 Minutes
The most insightful time you'll spend today!
Digitec Galaxus AG is the biggest online retailer in Switzerland, operating two online stores: Digitec, Switzerland’s online market leader for consumer electronics and media products, and Galaxus, the largest Swiss online shop with a steadily growing range of consistently low-priced products for almost all daily needs.
Known for its efficient, personalized shopping experiences, it’s clear that Digitec Galaxus understands what it takes to deliver a platform that is interesting and relevant to customers every time they shop.
The problem: Personalizing decisions for every situation
Digitec Galaxus already had established an engine to help them personalize experiences for shoppers when they reached out to Google Cloud. They had multiple recommendation systems in place and were also extensive early adopters of Recommendations AI, which already enabled them to offer personalized content in places like their homepages, product detail pages, and their newsletter.
But those same systems sometimes made it difficult to understand how best to combine and optimize to create the most personalized experiences for their shoppers. Their requirements were threefold:
- Personalization: They have over 12 recommenders they can display on the app, however they would like to contextualize this and choose different recommenders (which in turn select the items) for different users. Furthermore they would like to exploit existing trends as well as experiment with new ones.
- Latency: They would like to ensure that the solution is architected so that the ranked list of recommenders can be retrieved with sub 50 ms latency.
- End-to-end easy to maintain & generalizable/modular architecture: Digitec wanted the solution to be architected using an easy to maintain, open source stack, complete with all MLops capabilities required to train and use contextual bandits models. It was also important to them that it is built in a modular fashion such that it can be adapted easily to other use cases which have in mind such as recommendations on the homepage, Smartags and more .
To improve, they asked us to help them implement a machine learning (ML) contextual bandit based recommender system on Google Cloud taking all the above factors into consideration to take their personalization to the next level.
Contextual bandits algorithms are a simplified form of reinforcement learning and help aid real-world decision making by factoring in additional information about the visitor (context) to help learn what is most engaging for each individual. They also excel at exploiting trends which work well, as well as exploring new untested trends which can yield potentially even better results. For instance, imagine that you are personalizing a homepage image where you could show a comfy living room couch or pet supplies.
Without a contextual bandit algorithm, one of these images would be shown to someone at random without considering information you may have observed about them during previous visits. Contextual bandits enable businesses to consider outside context, such as previously visited pages or other purchases, and then observe the final outcome (a click on the image) to help determine what works best.
Creating a personalization system with contextual bandits
While Digitec Galaxus heavily personalizes their website homepages, they are very very sensitive and also require more cross-team collaboration to update and make changes.
Together with the Digitec Galaxus team, we decided to narrow the scope and focus on building a contextual bandit personalization system for the newsletter first. The digitec Galaxus team has complete control over newsletter decisions and testing various ML experiments on a newsletter would have less chance of adverse revenue impact than a website homepage.
The main goal was to architect a system that could be easily ported over to the homepage and other services offered by Digitec with minimal adaptations. It would also need to satisfy the functional and non-functional requirements of the homepage as well as other internal use cases.
Below is a diagram of how the newsletter’s personalization recommendation system works:

- The system is given some context features about the newsletter subscriber such as their purchase history and demographics. Features are sometimes referred to as variables or attributes, and can vary widely depending on what data is being analyzed.
- The contextual bandit model trains recommendations using those context features and 12 available recommenders (potential actions).
- The model then calculates which action is most likely to enhance the chance of reward (a user clicking in the newsletter) and also minimize the problem (an unsubscribe).
Calculating whether a click was a newsletter or an unsubscribe enabled the system to optimize for increasing clicks and avoid showing non-relevant content to the user (click-bait). This enabled Digitec Galaxus to exploit popular trends while also exploring potentially better-performing trends.
How Google Cloud helps
The newsletter context-driven personalization system was built on Google Cloud architecture using the ML recommendation training and prediction solutions available within our ecosystem.
Below is a diagram of the high-level architecture used:
The architecture covers three phases of generating context-driven ML predictions, including:
ML Development: Designing and building the ML models and pipeline
Vertex Notebooks are used as data science environments for experimentation and prototyping. Notebooks are also used to implement model training, scoring components, and pipelines. The source code is version controlled in Github. A continuous integration (CI) pipeline is set up to automatically run unit tests, build pipeline components, and store the container images to Cloud Container Registry.
ML Training: Large-scale training and storing of ML models
The training pipeline is executed on Vertex Pipelines. In essence, the pipeline trains the model using new training data extracted from BigQuery and produces a trained, validated contextual bandit model stored in the model registry. In our system, the model registry is a curated Cloud Storage.
The training pipeline uses Dataflow for large scale data extraction, validation, processing, and model evaluation, and Vertex Training for large-scale distributed training of the model. AI Platform Pipelines also stores artifacts, the output of training models, produced by the various pipeline steps to Cloud Storage. Information about these artifacts are then stored in an ML metadata database in Cloud SQL. To learn more about how to build a Continuous Training Pipeline, read the documentation guide.
ML Serving: Deploying new algorithms and experiments in production
The training pipeline uses batch prediction to generate many predictions at once using AI Platform Pipelines, allowing Digitec Galaxus to score large data sets. Once the predictions are produced, they are stored in Cloud Datastore for consumption. The pipeline uses the most recent contextual bandit model in the model registry to evaluate the inference dataset in BigQuery and give a ranked list of the best newsletters for each user, and persist it in Datastore. A Cloud Function is provided as a REST/HTTP endpoint to retrieve the precomputed predictions from Datastore.
All components of the code and architecture are modular and easy to use, which means they can be adapted and tweaked to several other use cases within the company as well.
Better newsletter predictions for millions
The newsletter prediction system was first deployed in production in February, and Digitec Galaxus has been using it to personalize over 2 million newsletters a week for subscribers. The results have been impressive, 50% higher than our baseline. However, the collaboration is still ongoing to improve the results even more.
“Working at this level in direct exchange with Google’s machine learning experts is a unique opportunity for us. The use of contextual bandits in the targeting of our recommendations enables us to pursue completely new approaches in personalization by also personalizing the delivery of the respective recommender to the user. We have already achieved good results in our newsletter in initial experiments and are now working on extending the approach to the entire newsletter by including more contextual data about the bandits arms. Furthermore, as a next step, we intend to apply the system to our online store as well, in order to provide our users with an even more personalized experience. To build this scalable solution, we are using Google’s open source tools such as TFX and TF Agents, as well as Google Cloud Services such as Compute Engine, Cloud Machine Learning Engine, Kubernetes Engine and Cloud Dataflow.”—Christian Sager, Product Owner, Personalization ( Digitec Galaxus)
Since the existing architecture and system is also dynamic, it will automatically adapt to new behaviours, trends, and users. As a result, Digitec Galaxus plans to re-use the same components and extend the existing system to help them improve the personalization of their homepage and other current use cases they have within the company. Beyond clicks and user engagement, the system’s flexibility also allows for future optimization of other criteria. It’s a very exciting time and we can’t wait to see what they build next!
Bigtable’s High Performance and Low Opex is Great for Building Personalization

3747
Of your peers have already read this article.
3:00 Minutes
The most insightful time you'll spend today!
Customer expectations have shifted as a result of evolving needs. Across industries, customers expect that you treat them as individuals, and demonstrate how well you understand and serve their unique needs. This concept—personalization—is the idea that you’re delivering a tailored experience to each customer corresponding to their needs and preferences; you’re setting up a process to create individualized interactions that improves the customer’s experience. According to Salesforce, 84% of consumers say being treated like a person, not a number, is very important to winning their business.
Entire industries are undergoing digital transformation to better serve their customers through personalized experiences. For example, retailers are improving engagement and conversion with personalized content, offers, and product recommendations. Advertising technology organizations are increasing the relevance and effectiveness of their ads using customer insights like their specific interests, purchasing intent, and buying behavior. Digital music services are helping their customers discover and enjoy new music, playlists, and podcasts based on their listening behavior and interests.
As customers want more and more personalization, modern technology is making it possible for many more businesses to achieve this. In this post, we’ll look at some common challenges to implementing personalization capabilities and how to solve them with transformative database technologies like Google Cloud’s Bigtable. Bigtable powers core Google services such as Google Maps that supports more than a billion users, and its petabyte scale, high availability, high throughput, and price-performance advantages help you deliver personalization at scale.
Challenges with personalization
Data is at the heart of personalization. To deliver personalization at scale, an application needs to store, manage, and access large volumes of data (a combination of customer-specific data and anonymized aggregate data across customers) to develop a deep understanding of the behavior, needs, and preferences of each customer. Your database needs to very quickly write large volumes of data concurrently for all active customers. You need to continuously capture data on customer behavior because each step potentially informs the next, e.g., adding an item to a shopping cart can be used to trigger new recommendations for related or complementary products. Much of this data needed for personalization is semi-structured and sparse, and therefore requires a database with a flexible data model.
Personalization at scale requires large volumes of data to be read in near real-time so that it can be in the critical serving path to deliver a seamless user experience, often with a total application latency of less than 100ms. This means your requests to the database need to return results with latencies of single-digit milliseconds. You need to ensure that application latencies do not degrade as you onboard more customers. Data needs to be organized efficiently and integrated with other tools so that you can run deep analytical queries and use machine learning (ML) models to develop personalized recommendations, and store the aggregates in your operational database for serving your customers. You also need the ability to run large batch reads for analytics without affecting the serving performance of your application.
In addition, you need to ensure that your database costs do not explode with the popularity of your application. Your database needs to consistently deliver low total cost of ownership (TCO), and high price-performance as your data volumes and throughput needs grow. Your database needs to scale seamlessly and linearly to deliver consistent, predictable performance to all users around the world. Additionally, your database needs to be easy to manage, so that you can focus on your application instead of managing the complexity of your database.
Why a NoSQL database is the right fit for personalization
Every database reflects a set of engineering tradeoffs. When relational databases were designed 40 years ago, storage, compute, and memory were thousands of times more expensive than they are today. Databases were deployed on a single server to a relatively small number of concurrent users, whose access to the systems tended to be during normal business hours when users had network access. Relational databases were designed with these resources, costs, and use in mind. They work very hard to be storage and memory efficient, and assume a single server for deployments.
As the costs of storage, memory, and compute decreased, and as data and workloads grew to exceed the capacity of commodity hardware, engineers began to reconsider these tradeoffs with different goals in mind. New types of databases later emerged that assumed distributed architectures so they could be easier to scale, especially with cloud infrastructure. With this approach the tradeoff in turn was to forego the sophistication of SQL and much of the data integrity and transactional capabilities developed in relational systems. These systems are commonly called NoSQL databases.
Traditional relational databases assume a fixed schema that will change infrequently over time. While this predictability of data structure allows for many optimizations, it also makes it difficult and cumbersome to add new and varying data elements in your application. NoSQL databases, such as key value stores and document databases, relax the rigidity of the schema and allow for data structures to evolve much more easily over time. Flexible data models speed the pace of innovation in your application, and increase your ability to iterate on your ML models, which is essential for personalization. In addition, the scalability of systems like Cloud Bigtable allow you to deliver personalization to millions of concurrent users while you continue to evolve how you personalize experiences for your customers.
How Cloud Bigtable enables personalization at scale
Cloud Bigtable supports personalization at scale with its ability to handle millions of requests per second, cost-effectively store petabytes of data1, and deliver consistent single-digit millisecond latencies for reads and writes. Bigtable delivers a unique mix of high performance and low operating cost to reduce your TCO.
We’ve heard from Spotify, Segment, and Algolia about how they’ve built personalized experiences for their customers with Bigtable. Check out this presentation to hear Peter Sobot of Spotify describe how they use Bigtable for personalization.
Let’s imagine a scenario where your application takes off like a rocketship, and grows to 250 million users. Let’s assume a peak 1.75 million concurrent users of your application2, with each user sending two requests per minute to your database. This will drive 3.5 million requests per minute to your database, or approximately 58.3K requests per second. Pricing for Bigtable to run this workload will start at under $400 per day3.
Bigtable scales throughput linearly with additional nodes. With separation of compute and storage, Bigtable automatically configures throughput by adjusting the association of nodes and data to provide consistent performance. When a node is experiencing heavy load, Bigtable automatically moves some of the traffic to a node with lower load to improve the overall performance. Bigtable also supports cross-region replication, with local writes in each region. This allows you to manage your data near your customers’ geographic locations, reducing network latency and bringing predictable, low-latency reads and writes to your customers in different regions around the world.
Bigtable is a NoSQL database developed and operated by Google Cloud. Bigtable provides a column family data model that allows you to flexibly store varying data elements for customers associated with their behavior and preferences, store a very large number of such data elements across your customers, and quickly iterate on your application. Bigtable supports trillions of rows with millions of columns. Each row in Bigtable supports up to 256 MB of data, so that you can easily store all personalized data for a customer in a single row. Bigtable tables are sparse, and there is no storage penalty for a column that is not used in a row; you only pay for the columns that store values.
BigQuery ML allows you to create and run ML models directly in BigQuery to develop personalization recommendations that you can bring back to Bigtable. You can easily pipe Bigtable data into BigQuery to run deep analytical queries and develop recommendations. These aggregates, like computed recommendations, are brought back to Bigtable so your application can serve those recommendations to users with low latency and massive scale.
Bigtable integrates with the Apache Beam ecosystem and Dataflow to make it easier for you to process and analyze your data. With application profiles and replication in Bigtable, you can isolate your workloads so that batch reads do not slow down your serving workload that has a mix of reads and writes. This enables your application to perform near real-time reads at scale to develop and train machine learning models in TensorFlow for personalization. Bigtable gives you the right operational data platform to develop personalization recommendations offline or in real-time, and serve them to your customers.

Here’s a look at conceptual schema examples for personalization in ecommerce:

And here’s a quick overview of what personalization use cases require, and how Bigtable addresses them.

Bigtable is fully managed to free you from the complexity of managing your database, so that you can focus on delivering a deeply personalized experience to your customers. Learn more about Bigtable.
1. Storage pricing (HDD) starts at $0.026 per GB/mo (us-central1)
2. Assumes application is used 24 hours a day, average user session is 5 minutes (Android app average), and daily peak is 2x the average. (250 million / (24 hours / 5 minutes) *2 = 1,736,111 peak concurrent users (us-central1 region)
3. Cloud Bigtable pricing for us-central1 region. Assumes 25 TB SSD storage (100 KB per user, for 250 million users) per month, 10 compute nodes per month (with no replication), includes data backup. Bigtable pricing details.
Google Introduces BigQuery Connector for SAP to Power Customers’ Data Analytics Strategy

5475
Of your peers have already read this article.
2:00 Minutes
The most insightful time you'll spend today!
Google Cloud has a genuine passion for solving technology problems that make a difference for our customers. With the release of our BigQuery Connector for SAP, we’re taking a another big step towards solving a major challenge for SAP customers with a quick, easy, and inexpensive way to integrate SAP data with BigQuery, our serverless, highly scalable, and cost-effective multi cloud data warehouse designed for business agility.
Solving for simplified data integration
Like most businesses today, SAP customers are eager to unlock the immediate insights and opportunities within their ever-growing stores of business data. However, many are discovering just how hard it can be to take the first step in any modern, cloud-enabled data analytics strategy: combining SAP data with other cloud-native, and enterprise data sets in real-time and at scale. According to a 2020 SAPInsider study, more than half of SAP customers surveyed said data integration was their top analytics pain point. These companies urgently need a rapid, sustainable, cost-effective and scalable way to integrate SAP data with modern cloud data analytics solutions.
The BigQuery Connector for SAP gives our customers a solution: a fast, simple, cost-effective and massively scalable way to make SAP data fully accessible within BigQuery by leveraging customers’ existing SAP Landscape Transformation Replication Server (SLT) tooling and skill sets. It’s the first SAP SLT direct near real-time connector for BigQuery without the need to set up additional infrastructure or third-party middleware, and can be deployed using a variety of embedded or stand-alone deployment options. In fact, most customers can install the BigQuery Connector for SAP in less than an hour—a remarkably easy way to start working with our industry-leading analytics solution that delivers proven and quantifiable business advantages for customers. Additionally, the BigQuery Connector for SAP is not restricted to customers who have deployed their SAP applications on Google Cloud. Customer’s who are running their SAP applications on-premise, or on any cloud, can also deploy and realize the analytical benefits of the solution.
Designing a solution with customer requirements and investments in mind
When the Google Cloud team started work on an analytics data integration tool for our SAP customers, we began with a set of requirements designed to root out the usual sources of cost and complexity. These included:
- The need for real-time performance with deltas replicated in milliseconds
- The ability to integrate data from almost any SAP Netweaver based application running today, regardless of its deployment location (on premises, any cloud, Google Cloud)
- Automatic BigQuery data type mapping with minimal transformation required
- Generation of target tables in BigQuery directly from source, if required
- Application layer integration that avoids the issues of direct database access
- Leveraging customers’ existing SAP skillsets, change data capture, and infrastructure
An important step towards meeting these requirements came when Alphabet, Google’s parent company, decided to leverage SAP SLT as a foundation for developing direct data replication between SAP and BigQuery for its internal corporate landscape. SLT as part of SAP’s strategic Business Technology Platform, supports real-time replication of data from SAP or third-party systems to SAP HANA, however, one of its limitations was direct integration with targets like BigQuery.
SAP SLT was a logical foundation for developing the connector for several reasons:
- It’s widely adopted among SAP customers who likely already leverage SLT for SAP analytics data integration
- It works with almost every non-SaaS SAP application environment running today
- It supports real-time replication performance at massive scale
It was an obvious choice for the Alphabet engineering team who saw immediate value from integrating SAP with BigQuery.
“The BigQuery Connector for SAP has enabled fast, low latency data replication for billions of records from 500+ tables of our most critical financial and supply chain data. Now in one cost-effective BigQuery data lake, this ERP data can be combined with other data sources for previously impossible real-time analytics and ML use cases. This allows us to drive much deeper strategic insights that support business and operational excellence, management and P&L reporting and more.”—Anil Nagalla, Sr. Engineering Director, Financial Systems, Google
SAP data integration with BigQuery enables new value
By leveraging SAP SLT, the BigQuery Connector for SAP can integrate real-time data streams from any SAP system—while also taking advantage of customers’ existing SAP investments and skillsets.
At the same time, the BigQuery Connector for SAP does a lot of heavy lifting on its own. For example, it automatically handles the complex, multi-step process of transforming SAP data types for use in BigQuery—mapping data-type transitions between the SAP and BigQuery environments, creating a target table schema on BigQuery for the transformed data types, building the target BigQuery table, and even adapting as new data types appear in your SAP environment.
For teams that want to fine-tune the BigQuery Connector for SAP’s automated recommendations, the connector supports additional levels of customization and choice. But if you simply want to get the job done and give your data analytics team greater support for their high-value work, then you’ll love just how quickly and easily the BigQuery Connector for SAP turns the complicated work of data integration and performance to process large volumes of data into a done deal. By integrating enterprise data sets in real time, customers can drive differentiated value and unlock new insights and actions that drive a competitive advantage.
The BigQuery Connector for SAP really shines as an enabling tool that transports and transforms your SAP data to power analytics solutions enabled by accelerators like the Google Cloud Cortex Framework: a comprehensive set of reference architectures, deployment accelerators, and integration services designed to give SAP customers a fast and seamless path to value with their data analytics investments. Simply put, the more SAP data you make available within Google Cloud, the easier it is to get meaningful—and often game-changing—insights from these solutions.
Learn more about the BigQuery Connector for SAP
Ready to get started with your own SAP data analytics strategy on Google Cloud? Install the Google Cloud BigQuery Connector for SAP, and discover a faster, simpler, more sustainable way to power your company’s data analytics strategy.
More Relevant Stories for Your Company

Incorporating Custom Holidays into Your Time-Series Models with BigQuery ML
About three years ago, JCB, one of the biggest Japanese payment companies, launched a project to develop new high-value services with agility. We set up a policy of starting small from scratch without using the existing system, which we call the concept of “Dejima”, where we focused on improving various aspects

PaGaLGuY Turns to Google Cloud Platform to Power Leading India Education Network
Founded in 2006, PaGaLGuY started as a forum that enabled students, typically aged between 20 and 30 to discuss and seek advice on academic issues. By 2011, PaGaLGuY had increased its traffic to about 250,000 page views per month. The business is now one of India’s largest education networks and

Cloud Bigtable brings database stability and performance to Precognitive
At Precognitive, we were able to start with a blank technology slate to support our fraud detection software products. When we started building the initial version of our platform in 2017, we had some decisions to make: What coding language to use? What cloud infrastructure provider to choose? What database

How Data Teams in EdTech Firms Make Most of the Educational Data at All Levels
Education data can inform strategy, enhance both teaching and learning, and help us better understand customer needs. But that data is only as useful as an organization’s ability to access, analyze, and act upon it. Education Technology (EdTech) companies with a strong data warehouse management policy can help to make
