





New Histogram Features in Cloud Logging Make it Easier to Track Log Volumes, Errors and Anomalies!
3396
Of your peers have already read this article.
2:30 Minutes
The most insightful time you'll spend today!
Visualizing trends in your logs is critical when troubleshooting an issue with your application. Using the histogram in Logs Explorer, you can quickly visualize log volumes over time to help spot anomalies, detect when errors started and see a breakdown of log volumes. But static visualizations are not as helpful as having more options for customization during your investigations.
That’s why we’re excited to announce that we recently added three new query controls along with separate colors for log severity to the histogram. These new features make it even easier to refine and analyze your logs by time range. The new histogram controls help find logs before or after the current period, jump to a specific time range represented in a histogram bar and zoom in/out of the current time window in the histogram.
Histogram colors
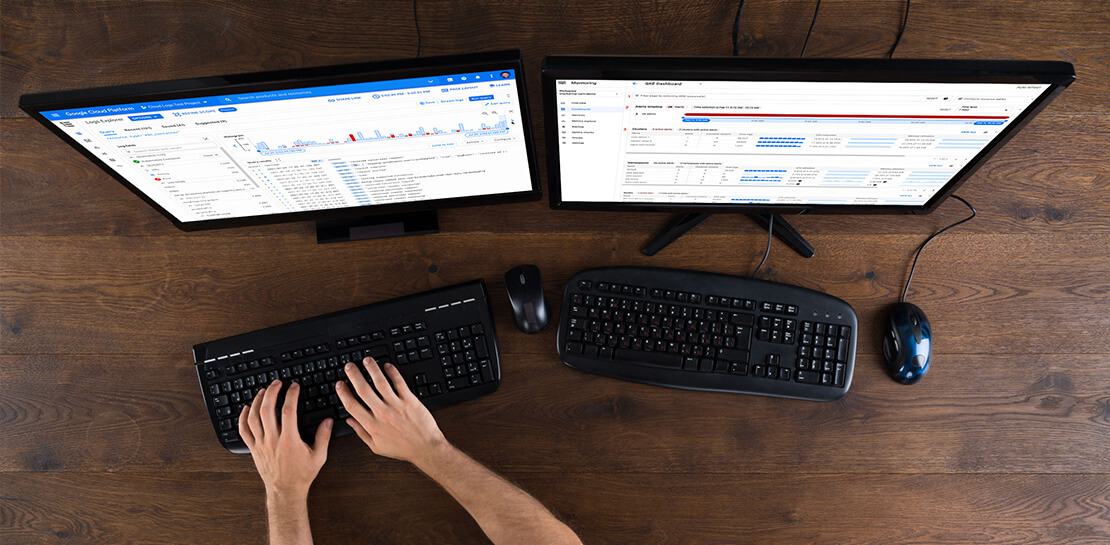
The histogram now makes it easier to view the breakdown of logs by severity with the introduction of color coding. For example, the severity colors make it easy to spot an increasing number of errors even when the volume of requests is relatively constant. Looking at the histogram below, the red vs blue shading makes it clear that there has been an increase in overall log volume and provides a visual breakdown of errors within that log volume.

Pan left/right to scroll through time
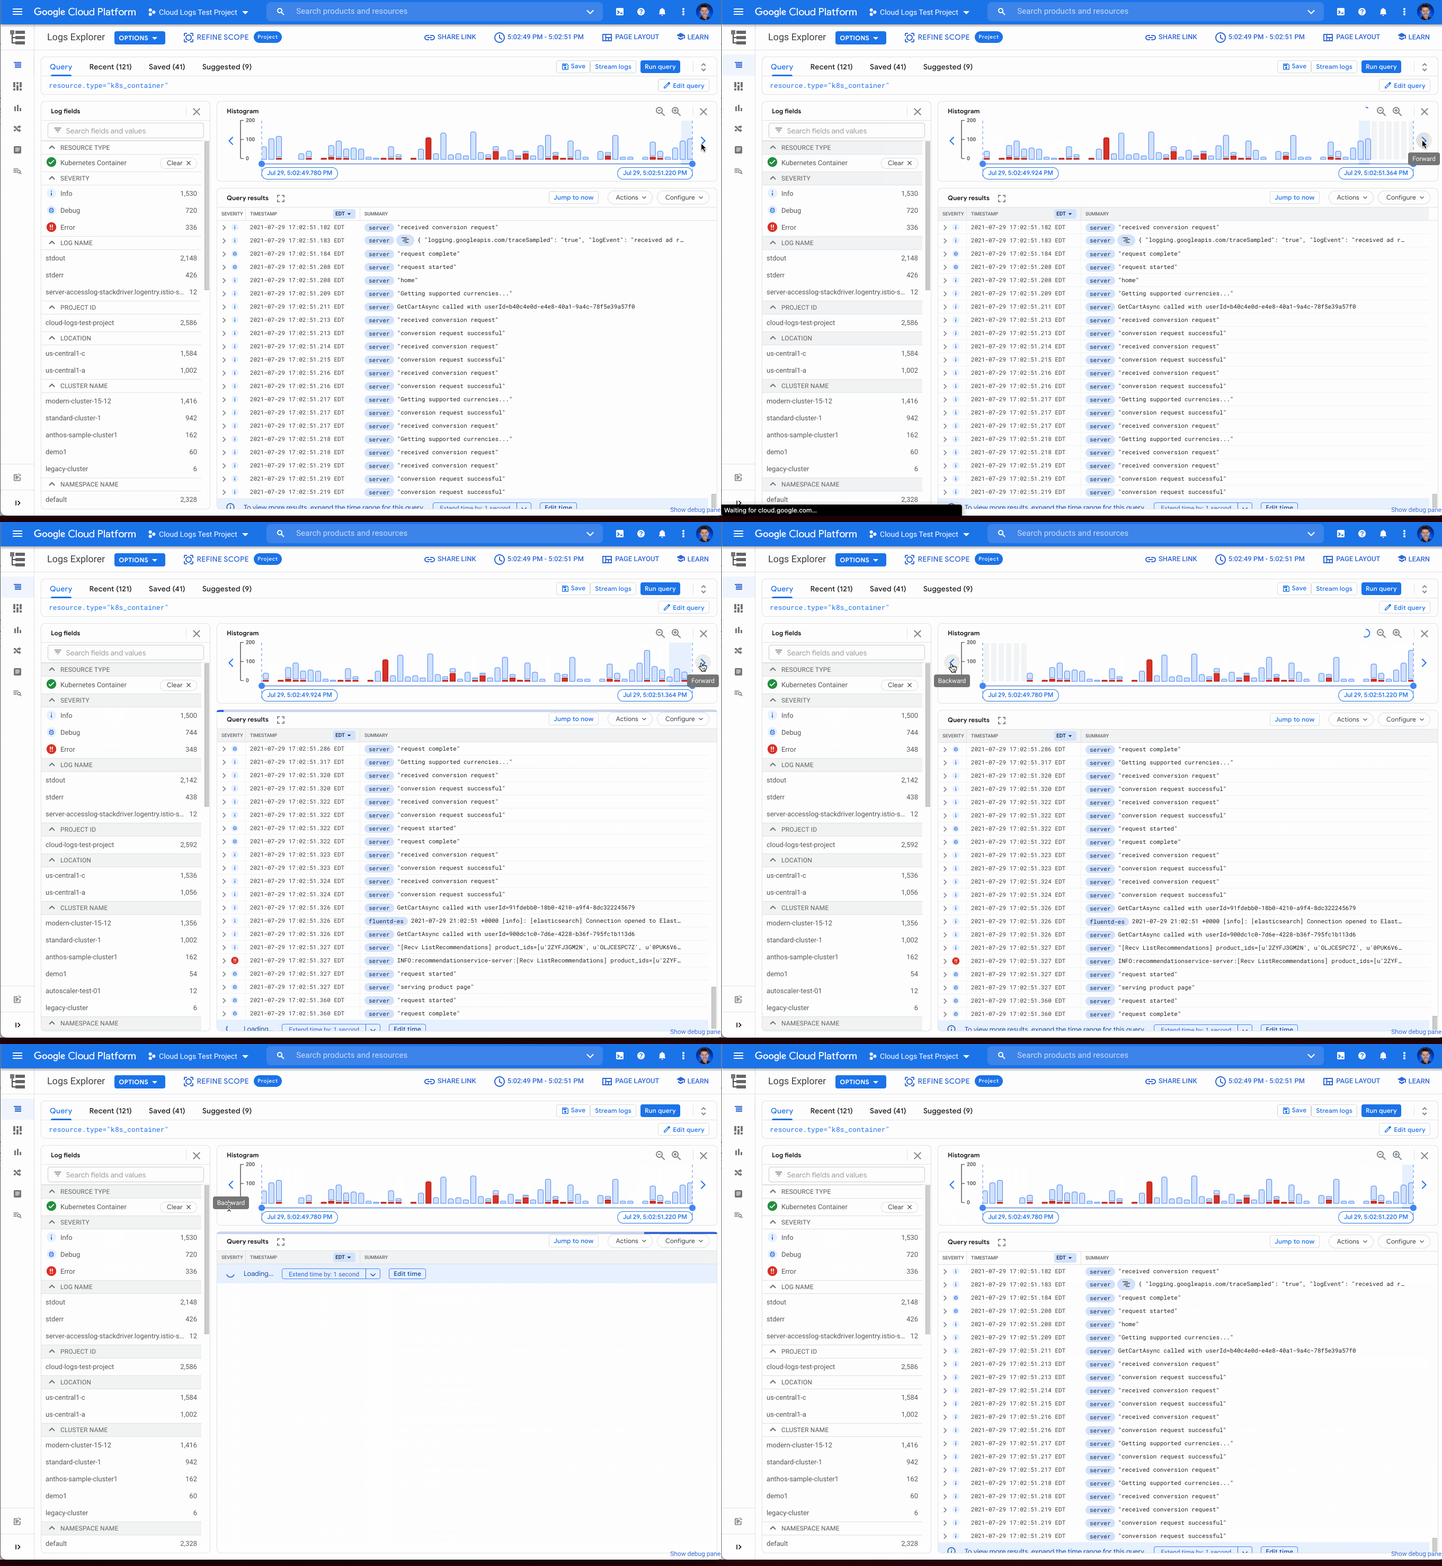
Sometimes in your troubleshooting journey, you may want to look at the logs directly before or after the current set of logs. Perhaps there was an unexpected spike in errors at the beginning of the time range and you need to see the logs in the time period directly preceding the current time range. Pressing the left arrow on the left side of the histogram shifts the time range earlier while the arrow on the right side of the histogram shifts the time range ahead. Either arrow will refine the time range in the query and rerun the query to return the logs in the new time range.
Zooming in or out
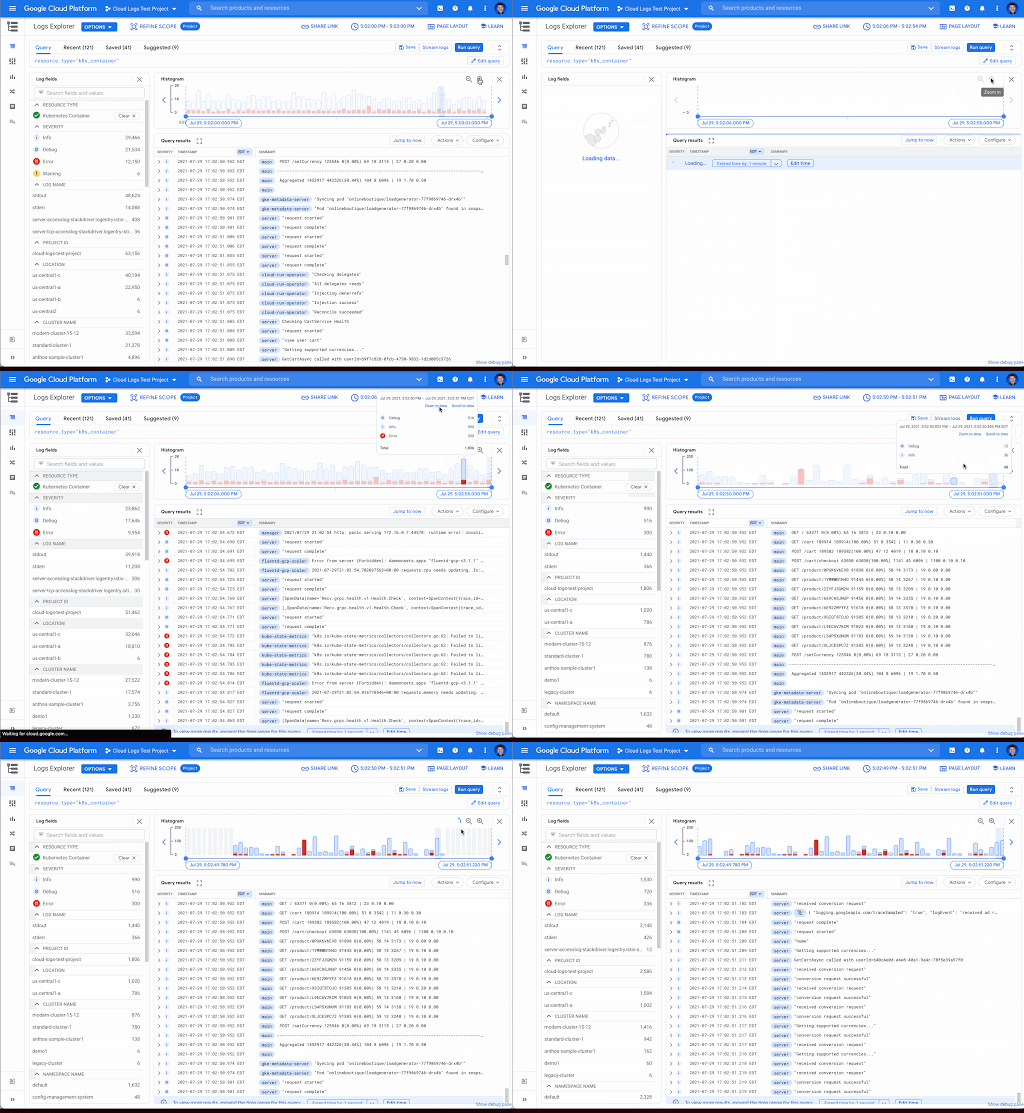
Zooming in or out from a given time range may be useful to visualize fine-grained details or a broader trend Clicking the zoom in or out icons in the upper right corner of the histogram refines the time range in the query and then reruns the query, returning the logs in the newly defined time range.
Scrolling to time
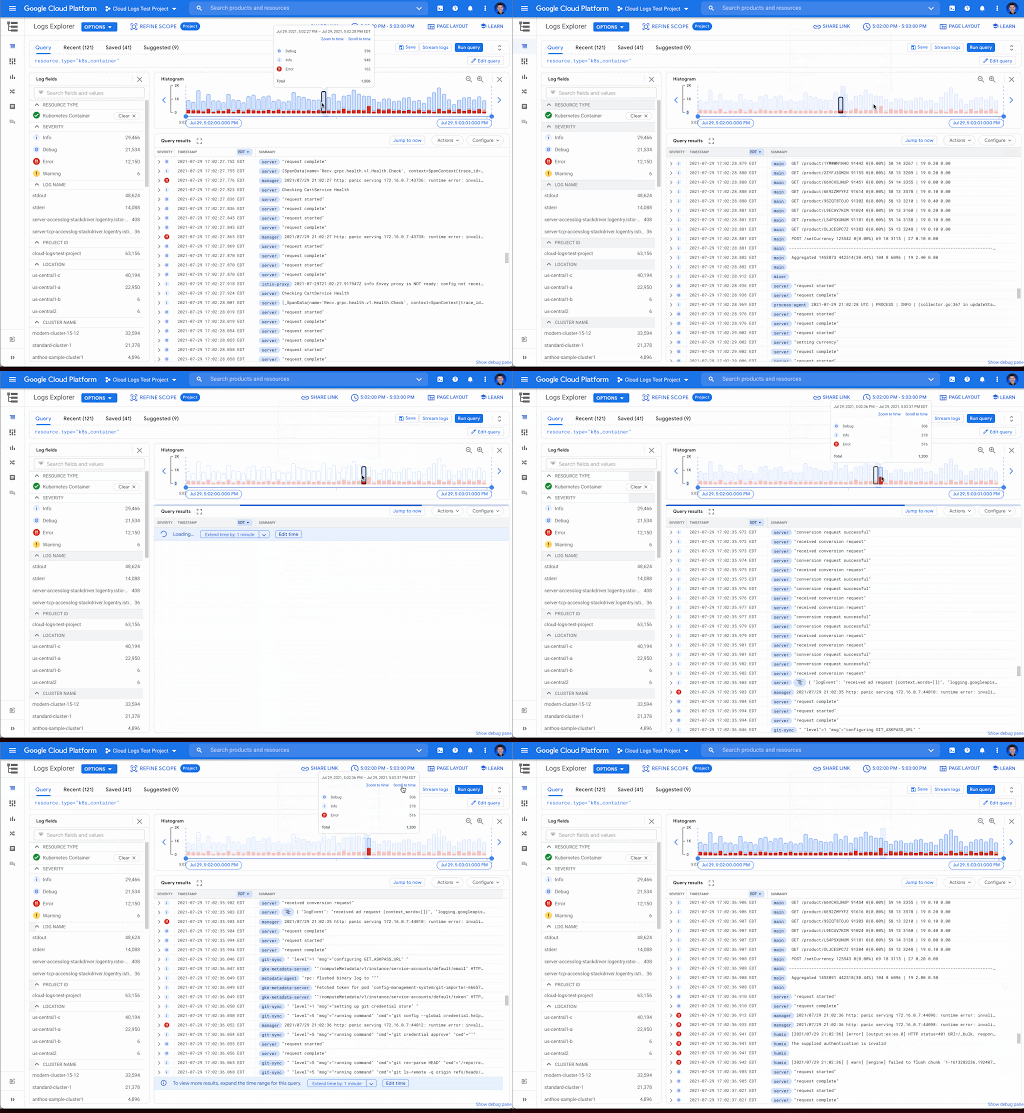
If you see a large spike in logs volume in the histogram, it’s useful to quickly review the logs generated during that spike. Clicking on the histogram bar that contains the spike now scrolls you to the logs generated during that time period.
Where to find the histogram
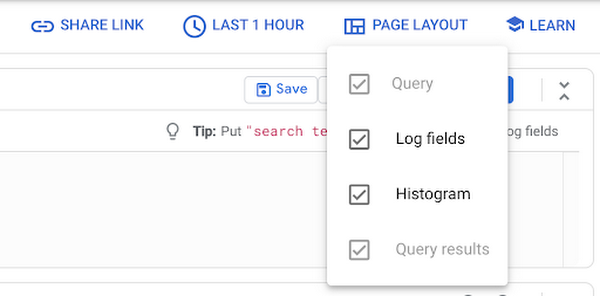
The histogram is a panel in Logs Explorer that can be displayed or hidden using the controls in the Page Layout menu. When you no longer want to display the histogram, click the “X” button in the upper right corner to quickly close it. To open it again, use the same Page Layout menu to enable the histogram display.
Get started with the histogram
These improvements move the histogram from a utility for visualization to an integral part of the troubleshooting journey. We are continuously working to launch new features that make Cloud Logging the best place to troubleshoot your Google Cloud logs. If you are not already a Cloud Logging user, review this getting started documentation or watch a quick video on troubleshooting services on Google Kubernetes Engine (GKE) to learn more. If you have specific questions or feedback, please join the discussion on our Google Cloud Community, Cloud Operations page.
6509
Of your peers have already watched this video.
46:30 Minutes
The most insightful time you'll spend today!
The Inside Story of How Home Depot Migrated to Google BigQuery From an On-prem DW Solution
In the media, you will often hear story of how born-in-the-cloud companies manage with massive infrastructure.
But it is one thing is to be a startup, and build infrastructure with bespoke requirements. And quite another to have a complex, multinational organization with online, with mobile, with brick-and-mortar presence, and hundreds of thousands of SKUs and professional services, and many, many years of technology, innovation, and really smart engineers.
This is the second story. The story of how The Home Depot, the number-one home improvement retailer in the US pulled of that feat.
The Home Depot has over 2,200 stores, over 4 lakh associates, and 2017 revenues of over a $100 billion.
In this video, Rick Ramaker, technology director, data analytics at The Home Depot, and Kevin Scholz, distinguished engineer, The Home Depot, talk about how the company transformed and modernised its data warehousing, the challenges they faced and the benefits they accrued from the project.
It’s a fascinating watch!
Google Cloud Region in Columbus to Accelerate Ohioan Businesses and Tech Transformation

3201
Of your peers have already read this article.
1:30 Minutes
The most insightful time you'll spend today!
Digital tools such as cloud computing are fueling economic transformation across the US, including Ohio. Google continues to invest across cities and communities in Ohio, bringing over 200 jobs to the state, and helping provide $12.85 billion of economic activity for tens of thousands of Ohio businesses, nonprofits, publishers, creators and developers. To further accelerate the transformation of all Ohioan businesses and technologists, we’re thrilled to announce our newest Google Cloud region in Columbus, Ohio is open. The Columbus cloud region brings a second region to the Midwest, the 10th region to North America, and grows our global cloud region count to 33.
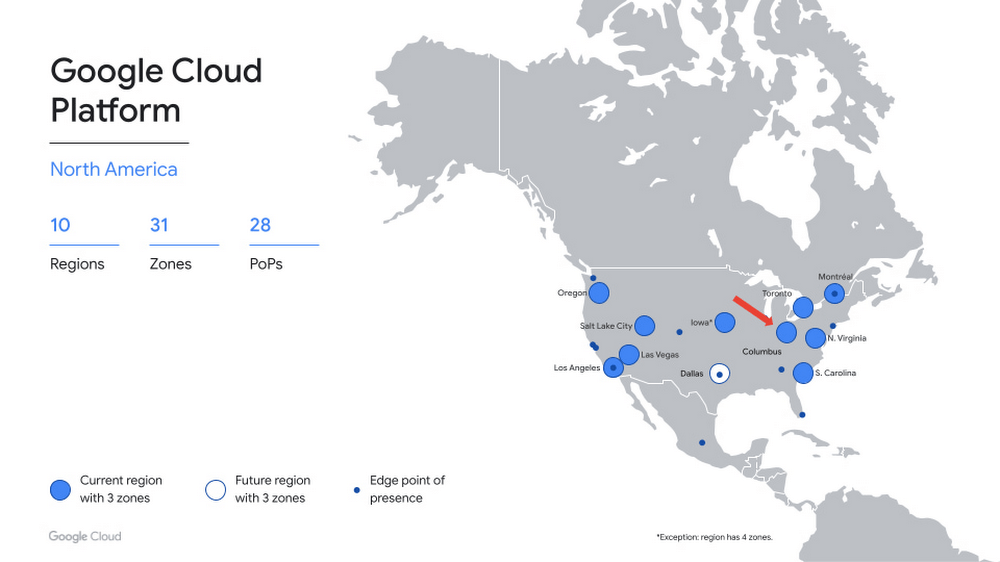
A region for the Buckeye State
Now open to Google Cloud customers, the Columbus region (us-east5) provides you with the speed and availability you need to innovate faster, build high-performing applications, and serve local customers — all on the cleanest cloud in the industry. Additionally, the region gives you added flexibility to distribute your workloads across the central, midwest, and eastern US.
The Columbus region offers immediate access to three zones, for high availability workloads, and our standard set of products, including Compute Engine, Google Kubernetes Engine, Cloud Storage, Persistent Disk, CloudSQL, and Cloud Identity. Our private backbone connects Columbus to our global network more quickly and securely. In addition, you can integrate your on-premises workloads with our new region using Cloud Interconnect. This means that Columbus-based customers can expand globally from their front door, and those based outside the region can more easily reach their users in the Midwest.
What customers are saying
Industries including retail, financial services, and IT are investing in Columbus. Organizations across these verticals have turned to the Google Cloud to innovate faster and help solve their most complex challenges
“As Wendy’s continues to innovate in new ways to create fast, frictionless, and fun interactions that redefine the way customers visit and enjoy our restaurants, our partnership with Google Cloud is a key enabler to delivering on our AI/ML and data analytics strategies. The proximity of the new Google Cloud region to Wendy’s headquarters provides the ability for us to move and scale quickly as business needs evolve. Additionally, Google Cloud’s investment in Columbus positions central Ohio as a true technology hub, which further boosts Wendy’s and other regional employers’ ability to recruit innovative talent,” said Kevin Vasconi, Chief Information Officer, Wendy’s.
“Huntington National Bank’s API Architecture is a central component to our growth and technology strategy. As our business segments grow from an offering and geographic perspective, we must evolve our technology to provide the optimal experience for our customers and our partners. Collaborating directly with Google Cloud on the build out of their cloud region in Central Ohio, provides the access our technology teams need to innovatively scale our infrastructure to meet the demands of our business with increased availability, lower latency, and greater resiliency,” said Geoff Preston, Chief Architect, Huntington National Bank.
“Google Cloud has been instrumental in our ability to scale and optimize data management and compute resources. We prioritize scale, elasticity and resilience in cloud services and Google Cloud delivers all three globally and locally. With Google Cloud security, we can efficiently process the quantities of application data required to accelerate alert detection and reduce response times for the critical infrastructure our customers depend on to enable the continuity of their vital applications.” said Sheryl Haislet, Chief Information Officer at Vertiv, a global provider of critical digital infrastructure and continuity systems headquartered in Columbus, Ohio, that leverages Google Cloud solutions to provide resilience for its operations and to better support customers.
“The addition of the new cloud region in Ohio continues to demonstrate Google Cloud’s commitment to the enterprise space and their presence in the region,” said Chris Delong, Chief Technology Officer, Designer Brands Inc. / DSW
What’s next
We are thrilled to welcome you to our new cloud region in Columbus, and eagerly await to see what you build with our platform. Register here for our Cloud Study Jam in June – an event for local developers to get hands-on training with Google Cloud. Stay tuned for more region announcements and launches this year, including our next U.S. region in Dallas, TX. And for more information, contact sales to get started with Google Cloud today.
Multicloud Mindset: Thinking About Open Source and Security in a Multicloud World

2770
Of your peers have already read this article.
1:30 Minutes
The most insightful time you'll spend today!
There’s never been a better time to talk about multicloud, and the Google Cloud Multicloud Mindset series on Twitter Spaces was created to do just that! This series takes place once every two weeks and features live conversations with top experts about the latest multicloud topics. You can join the 15-minute Q&A to ask your top questions and listen to episodes later offline for up to 30 days after we chat.
If you happened to miss our last few episodes, we recommend checking out our introduction blog to the series for what you missed. Let’s dive into our latest episodes, discussing the impact of open source and novel security challenges in multicloud environments.
Episode #5: ‘The intersection of open source and multicloud’
Open source technology has been an integral part of computing since its earliest era, predating even the birth of technology hubs like Silicon Valley. Open source projects have been responsible for giving us some of the most popular software in the world, such as Mozilla Firefox and the operating system Linux.
In the fifth episode, we sat down with Mike Coleman, Cloud Developer Advocate at Google Cloud, and took a closer look into the history of open source technologies, the role they play in a multicloud world, and the developer perspective on using these technologies to do their work.
The concept of multicloud anchors on the ability to run workloads across clouds and being able to pick the providers that are best suited for specific parts of workloads. Adopting open source technologies and languages empower companies to use the tools they need, regardless of cloud provider, without the fear of getting locked into a specific provider.
“As you think about moving across different environments, whether that be cloud to cloud, or developer desktop to ultimate destination, whether that be your data center or the cloud. Open source software allows you to do that…and multicloud is just an extension of that. This idea that I need to run the same software wherever I go.” — Mike Coleman, Cloud Developer Advocate at Google Cloud
If you’ve ever wanted a developer’s take on the impact of multicloud and the influence of open source in software development and digital transformation trends, you’ll want to tune into this episode.
You can access the full conversation on Twitter Spaces.
Episode #6: ‘Novel challenges in security with multicloud’
In the sixth episode of the series, we chatted with Dr. Anton Chuvakin, Security Advisor at Office of the CISO at Google Cloud, about how security leaders and architects are shifting away from traditional security models, which are increasingly insufficient for multicloud environments.
As more organizations adopt multicloud approaches, the question of how to maintain security in these complex environments and the increasing burden on SecOps teams is top of mind. As Dr. Chuvakin noted, the challenges in the cloud facing more traditional teams range from types of telemetry and logs to volumes and lack of clarity on detection use cases. However, these issues intensify when extended to include multiple clouds, where learning how to do something on one provider may be completely different on another.
“If you end up multicloud, you need to know public cloud and how it works at a better level than you would if you’re going to a single provider. Just like if you’re trying to repair three cars, you need to first learn how to repair cars. You need to have more cloud knowledge to do multicloud, not less. You need to have more powerful superpowers in the public cloud computing area because you can’t just learn one provider and call it a day.” — Dr. Anton Chuvakin, Security Advisor at Office of the CISO at Google Cloud
During the discussion, he offered three tips for tackling multicloud security:
- Learn cloud more, not less if you’re going multicloud. Multicloud requires more cloud knowledge because you can’t learn a single provider and call it a day. You’ll need to understand the differences in order to be able to secure multiple cloud environments.
- Focus on learning cloud identity management and how it compares to your traditional identity management service functions. Start with identifying the differences and similarities in what you see in one cloud and then continue with other clouds you use.
- Explore where your threat areas change in cloud environments when you plan detection and response activities to understand if your detection is covered across clouds.
If your organization is embracing multicloud, this is a great episode to listen and learn more about cloud security, the primary considerations and challenges facing security teams, and some helpful best practices for thinking about security in multicloud environments.
We’ll be sharing the latest topics and episodes with you every month in this blog series. Until next time.
Pacemaker’s Automated Alerts and Alert Reporting: No More Outages for SAP Systems on Google Cloud!

3253
Of your peers have already read this article.
6:00 Minutes
The most insightful time you'll spend today!
When critical services fail, businesses risk losing revenue, productivity, and trust. That’s why Google Cloud customers running SAP applications choose to deploy high availability (HA) systems on Google Cloud.
In these deployments Linux operating system clustering provides application and guest awareness for the application state and automates recovery actions in case of failure — including cluster node, resource or node failover or failed action.
Pacemaker is the most popular software Linux administrators use to manage their HA clusters, which includes automating notifications about events — including failover fencing and node, attribute, and resource events — and reporting on events. With automated alerts and reports, Linux administrators can not only learn about events as they happen, but they can also make sure other stakeholders are alerted to take action when critical events occur. They can even discover past events to assess the overall health of their HA systems.
Here, we break down the steps to setting up automated alerts for HA cluster events and alert reporting.
How to Deploy the Alert Script
To set up event-based alerts, you’ll need to take the following steps to execute the script.
1. Download the script file ‘gcp_crm_alert.sh’ from
https://github.com/GoogleCloudPlatform/pacemaker-alerts-cloud-logging
2. Under root user, add exec flag for the script and execute deployment with:
chmod +x ./gcp_crm_alert.sh./gcp_crm_alert.sh -d
3. Confirm that the deployment runs successfully. If it does, you will see the following INFO log messages:
In the Red Hat Enterprise Linux (RHEL) system:
gcp_crm_alert.sh:2022-01-24T23:48:30+0000:INFO:'pcs alert recipient add gcp_cluster_alert value=gcp_cluster_alerts id=gcp_cluster_alert_recepient options value=/var/log/crm_alerts_log' rc=0
In the SUSE Linux Enterprise Server (SLES):
gcp_crm_alert.sh:2022-01-25T00:13:27+00:00:INFO:'crm configure alert gcp_cluster_alert /usr/share/pacemaker/alerts/gcp_crm_alert.sh meta timeout=10s timestamp-format=%Y-%m-%dT%H:%M:%S.%06NZ to { /var/log/crm_alerts_log attributes gcloud_timeout=5 gcloud_cmd=/usr/bin/gcloud }' rc=0Now, in the event of a cluster node, resource, node failover, or failed action, Pacemaker will start the alert mechanism. For further details on the alerting agent, check out the Pacemaker Explained documentation.
How to Use Cloud Logging for Alert Reporting
Alerted events are published in Cloud Logging. Below is an example of the log record payload, where the cluster alert key-value pairs get recorded in the jsonPayload node.
{
"insertId": "ktildwg1o3fbim", "jsonPayload": { "CRM_alert_recipient": "/var/log/crm_alerts_log", "CRM_alert_attribute_name": "", "CRM_alert_kind": "resource", "CRM_alert_status": "0", "CRM_alert_rsc": "STONITH-sapecc-scs", "CRM_alert_rc": "0", "CRM_alert_timestamp_usec": "", "CRM_alert_interval": "0", "CRM_alert_node_sequence": "21", "CRM_alert_task": "start", "CRM_alert_nodeid": "", "CRM_alert_timestamp": "2022-01-25T00:17:06.515313Z", "CRM_alert_timestamp_epoch": "", "CRM_alert_desc": "ok", "CRM_alert_target_rc": "0", "CRM_alert_version": "1.1.15", "CRM_alert_attribute_value": "", "CRM_alert_node": "sapecc-ers", "CRM_alert_exec_time": "" }, "resource": { "type": "global", "labels": { "project_id": "gcp-tse-sap-on-gcp-lab" } }, "timestamp": "2022-01-25T00:17:09.662557309Z", "severity": "INFO", "logName": "projects/gcp-tse-sap-on-gcp-lab/logs/sapecc-ers%2F%2Fvar%2Flog%2Fcrm_alerts_log", "receiveTimestamp": "2022-01-25T00:17:09.662557309Z" }
To get notified of a resource event — for example, when the HANA topology resource monitor fails — you can use the following filter for the alerting definition:
jsonPayload.CRM_alert_node=("hana-venus" OR "hana-mercury") -jsonPayload.CRM_alert_status="0" jsonPayload.CRM_alert_rsc="rsc_SAPHanaTopology_SBX_HDB00" jsonPayload.CRM_alert_task="monitor" To define an alert for a fencing event, your can apply this filter: jsonPayload.CRM_alert_node=("hana-venus" OR "hana-mercury") jsonPayload.CRM_alert_kind="fencing" The fencing log entry gets recorded with warning severity to give you deeper insight, and this additional information is also helpful for more specific filtering criteria: {   "insertId": "1plznskfjsxt82",   "jsonPayload": {     "CRM_alert_attribute_value": "",     "CRM_alert_recipient": "/var/log/crm_alerts_log",     "CRM_alert_rsc": "",     "CRM_alert_rc": "0",     "CRM_alert_timestamp_usec": "529261",     "CRM_alert_desc": "Operation reboot of hana-mercury by hana-venus for crmd.2361@hana-venus: OK (ref=2a9bf814-9adf-4247-af3f-94ac254fc3ca)", "CRM_alert_target_rc": "",     "CRM_alert_nodeid": "",     "CRM_alert_kind": "fencing",     "CRM_alert_node_sequence": "33",     "CRM_alert_task": "st_notify_fence",     "CRM_alert_status": "",     "CRM_alert_exec_time": "",     "CRM_alert_attribute_name": "",     "CRM_alert_timestamp_epoch": "1643072786",     "CRM_alert_version": "1.1.19",     "CRM_alert_timestamp": "2022-01-25T01:06:26.529261Z",     "CRM_alert_interval": "",     "CRM_alert_node": "hana-mercury"   },   "resource": {     "type": "global",     "labels": {       "project_id": "gcp-tse-sap-on-gcp-lab"     }   },   "timestamp": "2022-01-25T01:06:27.267017052Z",   "severity": "WARNING",   "logName": "projects/gcp-tse-sap-on-gcp-lab/logs/hana-venus%2F%2Fvar%2Flog%2Fcrm_alerts_log", "receiveTimestamp": "2022-01-25T01:06:27.267017052Z"
}
Alerts can be delivered through multiple channels, including text and email. Below is an example of an email notification for our earlier example, when we defined an alert for a HANA topology resource monitor failure:
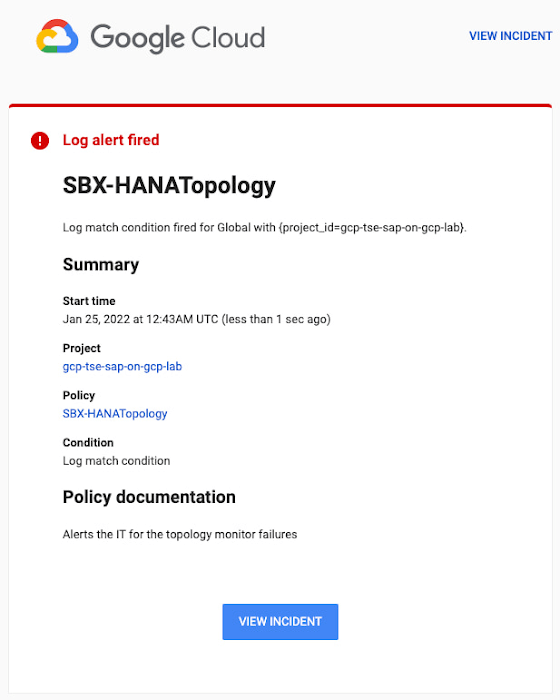
You can write and apply filters to your log-based alerts to isolate certain types of incidents and analyze events over time. For example, the following script will surface a resource event occurring within a two-hour window on a specific date:
timestamp>="2022-01-25T00:00:00Z" timestamp<="2022-01-25T02:00:00Z"
jsonPayload.CRM_alert_kind="resource"
With the ability to analyze these logged alerts over time, determine whether event patterns warrant any action.
[SIDEBAR]
The alert script prints details in the standard output and in the log file /var/log/crm_alerts_log, and this can grow over time. We recommend that the log file is set with the Linux logrotate service in order to limit the file system space. Use the following command to create the necessary logrotate setting for the alerting log file:
cat > /etc/logrotate.d/crm_alerts_log << END-OF-FILE /var/log/crm_alerts_log { create 0660 root root rotate 7 size 10M missingok compress delaycompress copytruncate dateext dateformat -%Y%m%d-%s notifempty } END-OF-FILE [END SIDEBAR]
Tips for Troubleshooting When you first deploy your alert script, how can you tell for certain that you’ve done it correctly? Use the following commands to test it out:
In RHEL:
pcs alert show
In SLES:
sudo crm config show | grep -A3 gcp_cluster_alert
You should see the following if the script is correct:
In RHEL:
Alerts: Alert: gcp_cluster_alert (path=/usr/share/pacemaker/alerts/gcp_crm_alert.sh) Description: "Cluster alerting for hana-node-X" Options: gcloud_cmd=/usr/bin/gcloud gcloud_timeout=5 Meta options: timeout=10s timestamp-format=%Y-%m-%dT%H:%M:%S.%06NZ Recipients: Recipient: gcp_cluster_alert_recepient (value=gcp_cluster_alerts) Options: value=/var/log/crm_alerts_log In SLES:
alert gcp_cluster_alert "/usr/share/pacemaker/alerts/gcp_crm_alert.sh" \ meta timeout=10s timestamp-format="%Y-%m-%dT%H:%M:%S.%06NZ" \ to "/var/log/crm_alerts_log" attributes gcloud_timeout=5 gcloud_cmd="/usr/bin/gcloud" If the commands do not display the alerts properly, re-deploy the script.
In case there is an issue with the script, or if the Cloud Logging records are not presenting as expected, examine the script log file /var/log/crm_alerts_log. The errors and warning can be filtered with:
egrep '(ERROR|WARN)' /var/log/crm_alerts_log
Any Pacemaker alert failures will be recorded in the messages and/or Pacemaker log. To examine recent alert failures, use the following command:
egrep '(gcp_crm_alert.sh|gcp_cluster_alert)' \ /var/log/messages /var/log/pacemaker.log
Keep in mind, though, that the Pacemaker log location may be different in your system from the one in the example above.
From reactive to proactive
Your SAP applications are too critical to risk outages. The most effective way to manage high availability clusters for your SAP systems on Google Cloud is to take full advantage of Pacemaker’s alerting capabilities, so you can be proactive in ensuring your systems are healthy and available.
Learn more about running SAP on Google Cloud.
3294
Of your peers have already watched this video.
1:30 Minutes
The most insightful time you'll spend today!
Fitbit’s Zero-Downtime Migration to GCP
In 2019, Fitbit moved all of its production operations from managed hosting to Google Cloud Platform without any downtime. The Fitbit experience is provided by a monolithic application backed by 200+ data stores, making the task of moving service by service impossible.
So, Fitbit decided to run services in both hosting environments and move user by user. This is the story of Fitbit’s migration to GCP, which was tested and executed mostly in production, without any effects to the users.
The tale starts with a review of goals and requirements for the migration. What should the user experience be during this period? How would we know if we are meeting that benchmark and can push forward? How would we slow or reverse migration if things weren’t going well? Answering these questions led us to a migration plan that started with the movement of internal users, followed by the careful transplant of a small number of real customers, and concluded with a mass migration of the majority of our users.
This migration path required significant new additions to Fitbit’s architecture, including new testing, routing, and caching techniques. As the journey approached its conclusion, we recognized that these methods were not merely allowing us to migrate; they were allowing Fitbit to operate in multiple hosting environments simultaneously. The lessons from this migration have provided the foundation for a mutli-region architecture that will unlock the full potential of life in Google Cloud Platform.
More Relevant Stories for Your Company



Journey to Transformation and Modernization with Google’s Distributed Cloud
Google Cloud has been leading the way of helping businesses make most from their cloud investments to drive digital transformation through modern application platforms that cater to today's customer needs. Watch the video from the Next '21 to explore three areas where companies are supported by Google Cloud throughout their

10 Reasons that Make Google Cloud the Champion of IaaS
When you choose to run your business on Google Cloud you benefit from the same planet-scale infrastructure that powers Google’s products such as Maps, YouTube, and Workspace. We have picked 10 ways in which Google Cloud Infrastructure services outshine alternatives in the market in how they simplify your operations, save

End Security Risks with the Unattended Projects Recommender Feature
In fast-moving organizations, it's not uncommon for cloud resources, including entire projects, to occasionally be forgotten about. Not only such unattended resources can be difficult to identify, but they also tend to create a lot of headaches for product teams down the road, including unnecessary waste and security risks. To

Connected Data is the Lifeblood of Today’s Retailers: IDC’s 2022 Research
For a look ahead at the trends that will animate the retail industry this year, let’s take a look back at the 2022 National Retail Federation (NRF) "Big Show" in NYC. Attendees at January’s event were treated to tangible examples of how retail challenges are being solved today, including new
