





New Capabilities in BigQuery to Ease Anomalies Detection in the Absence of Labeled Data

6318
Of your peers have already read this article.
4:00 Minutes
The most insightful time you'll spend today!
When it comes to anomaly detection, one of the key challenges that many organizations face is that it can be difficult to know how to define what an anomaly is. How do you define and anticipate unusual network intrusions, manufacturing defects, or insurance fraud? If you have labeled data with known anomalies, then you can choose from a variety of supervised machine learning model types that are already supported in BigQuery ML. But what can you do if you don’t know what kind of anomaly to expect, and you don’t have labeled data? Unlike typical predictive techniques that leverage supervised learning, organizations may need to be able to detect anomalies in the absence of labeled data.
Today we are announcing the public preview of new anomaly detection capabilities in BigQuery ML that leverage unsupervised machine learning to help you detect anomalies without needing labeled data. Depending on whether or not the training data is time series, users can now detect anomalies in training data or on new input data using a new ML.DETECT_ANOMALIES function (documentation), with the following models:
- Autoencoder model, now in Public Preview (documentation)
- K-means model, already GA (documentation)
- ARIMA_PLUS time series model, already GA (documentation)
How does anomaly detection with ML.DETECT_ANOMALIES work?
To detect anomalies in non-time-series data, you can use:
- K-means clustering models: When you use
ML.DETECT_ANOMALIESwith a k-means model, anomalies are identified based on the value of each input data point’s normalized distance to its nearest cluster. If that distance exceeds a threshold determined by the contamination value provided by the user, the data point is identified as an anomaly. - Autoencoder models: When you use
ML.DETECT_ANOMALIESwith an autoencoder model, anomalies are identified based on the reconstruction error for each data point. If the error exceeds a threshold determined by the contamination value, it is identified as an anomaly.
To detect anomalies in time-series data, you can use:
- ARIMA_PLUS time series models: When you use
ML.DETECT_ANOMALIESwith an ARIMA_PLUS model, anomalies are identified based on the confidence interval for that timestamp. If the probability that the data point at that timestamp occurs outside of the prediction interval exceeds a probability threshold provided by the user, the datapoint is identified as an anomaly.
Below we show code examples of anomaly detection in BigQuery ML for each of the above scenarios.
Anomaly detection with a k-means clustering model
You can now detect anomalies using k-means clustering models, by running ML.DETECT_ANOMALIES to detect anomalies in the training data or in new input data. Begin by creating a k-means clustering model:
Language: SQL
CREATE MODEL `mydataset.my_kmeans_model`OPTIONS(MODEL_TYPE = 'kmeans',NUM_CLUSTERS = 8,KMEANS_INIT_METHOD = 'kmeans++') ASSELECT* EXCEPT(Time, Class)FROM`bigquery-public-data.ml_datasets.ulb_fraud_detection`;
With the k-means clustering model trained, you can now run ML.DETECT_ANOMALIES to detect anomalies in the training data or in new input data.
To detect anomalies in the training data, use ML.DETECT_ANOMALIES with the same data used during training:
Language: SQL
SELECT*FROMML.DETECT_ANOMALIES(MODEL `mydataset.my_kmeans_model`,STRUCT(0.02 AS contamination),TABLE `bigquery-public-data.ml_datasets.ulb_fraud_detection`);

To detect anomalies in new data, use ML.DETECT_ANOMALIES and provide new data as input:
Language: SQL
SELECT*FROMML.DETECT_ANOMALIES(MODEL `mydataset.my_kmeans_model`,STRUCT(0.02 AS contamination),(SELECT * FROM `mydataset.newdata`));

How does anomaly detection work for k-means clustering models?
Anomalies are identified based on the value of each input data point’s normalized distance to its nearest cluster, which, if exceeds a threshold determined by the contamination value, is identified as an anomaly. How does this work exactly? With a k-means model and data as inputs, ML.DETECT_ANOMALIES first computes the absolute distance for each input data point to all cluster centroids in the model, then normalizes each distance by the respective cluster radius (which is defined as the standard deviation of the absolute distances of all points in this cluster to the centroid). For each data point, ML.DETECT_ANOMALIES returns the nearest centroid_id based on normalized_distance, as seen in the screenshot above. The contamination value, specified by the user, determines the threshold of whether a data point is considered an anomaly. For example, a contamination value of 0.1 means that the top 10% of descending normalized distance from the training data will be used as the cut-off threshold. If the normalized distance for a datapoint exceeds the threshold, then it is identified as an anomaly. Setting an appropriate contamination will be highly dependent on the requirements of the user or business.
For more information on anomaly detection with k-means clustering, please see the documentation here.
Anomaly detection with an autoencoder model
You can now detect anomalies using autoencoder models, by running ML.DETECT_ANOMALIES to detect anomalies in the training data or in new input data.
Begin by creating an autoencoder model:
Language: SQL
CREATE MODEL `mydataset.my_autoencoder_model`OPTIONS(model_type='autoencoder',activation_fn='relu',batch_size=8,dropout=0.2,hidden_units=[32, 16, 4, 16, 32],learn_rate=0.001,l1_reg_activation=0.0001,max_iterations=10,optimizer='adam') ASSELECT* EXCEPT(Time, Class)FROM`bigquery-public-data.ml_datasets.ulb_fraud_detection`;
To detect anomalies in the training data, use ML.DETECT_ANOMALIES with the same data used during training:
Language: SQL
SELECT*FROMML.DETECT_ANOMALIES(MODEL `mydataset.my_autoencoder_model`,STRUCT(0.02 AS contamination),TABLE `bigquery-public-data.ml_datasets.ulb_fraud_detection`);

To detect anomalies in new data, use ML.DETECT_ANOMALIES and provide new data as input:
Language: SQL
SELECT*FROMML.DETECT_ANOMALIES(MODEL `mydataset.my_autoencoder_model`,STRUCT(0.02 AS contamination),(SELECT * FROM `mydataset.newdata`));

How does anomaly detection work for autoencoder models?
Anomalies are identified based on the value of each input data point’s reconstructed error, which, if exceeds a threshold determined by the contamination value, is identified as an anomaly. How does this work exactly? With an autoencoder model and data as inputs, ML.DETECT_ANOMALIES first computes the mean_squared_error for each data point between its original values and its reconstructed values. The contamination value, specified by the user, determines the threshold of whether a data point is considered an anomaly. For example, a contamination value of 0.1 means that the top 10% of descending error from the training data will be used as the cut-off threshold. Setting an appropriate contamination will be highly dependent on the requirements of the user or business.
For more information on anomaly detection with autoencoder models, please see the documentation here.
Anomaly detection with an ARIMA_PLUS time-series model

With ML.DETECT_ANOMALIES, you can now detect anomalies using ARIMA_PLUS time series models in the (historical) training data or in new input data. Here are some examples of when might you want to detect anomalies with time-series data:
Detecting anomalies in historical data:
- Cleaning up data for forecasting and modeling purposes, e.g. preprocessing historical time series before using them to train an ML model.
- When you have a large number of retail demand time series (thousands of products across hundreds of stores or zip codes), you may want to quickly identify which stores and product categories had anomalous sales patterns, and then perform a deeper analysis of why that was the case.
Forward looking anomaly detection:
- Detecting consumer behavior and pricing anomalies as early as possible: e.g. if traffic to a specific product page suddenly and unexpectedly spikes, it might be because of an error in the pricing process that leads to an unusually low price.
- When you have a large number of retail demand time series (thousands of products across hundreds of stores or zip codes), you would like to identify which stores and product categories had anomalous sales patterns based on your forecasts, so you can quickly respond to any unexpected spikes or dips.
How do you detect anomalies using ARIMA_PLUS? Begin by creating an ARIMA_PLUS time series model:
Language: SQL
CREATE OR REPLACE MODEL mydataset.my_arima_plus_modelOPTIONS(MODEL_TYPE='ARIMA_PLUS',TIME_SERIES_TIMESTAMP_COL='date',TIME_SERIES_DATA_COL='total_amount_sold',TIME_SERIES_ID_COL='item_name',HOLIDAY_REGION='US') ASSELECTdate,item_description AS item_name,SUM(bottles_sold) AS total_amount_soldFROM`bigquery-public-data.iowa_liquor_sales.sales`GROUP BYdate,item_nameHAVINGdate BETWEEN DATE('2016-01-04') AND DATE('2017-06-01')AND item_name IN ("Black Velvet", "Captain Morgan Spiced Rum","Hawkeye Vodka", "Five O'Clock Vodka", "Fireball Cinnamon Whiskey");
To detect anomalies in the training data, use ML.DETECT_ANOMALIES with the model obtained above:
Language: SQL
SELECT*FROMML.DETECT_ANOMALIES(MODEL `mydataset.my_arima_plus_model`,STRUCT(0.8 AS anomaly_prob_threshold));

To detect anomalies in new data, use ML.DETECT_ANOMALIES and provide new data as input:
Language: SQL
WITHnew_data AS (SELECTdate,item_description AS item_name,SUM(bottles_sold) AS total_amount_soldFROM`bigquery-public-data.iowa_liquor_sales.sales`GROUP BYdate,item_nameHAVINGdate BETWEEN DATE('2017-06-02')AND DATE('2017-10-01')AND item_name IN ('Black Velvet','Captain Morgan Spiced Rum','Hawkeye Vodka',"Five O'Clock Vodka",'Fireball Cinnamon Whiskey') )SELECT*FROMML.DETECT_ANOMALIES(MODEL `mydataset.my_arima_plus_model`,STRUCT(0.8 AS anomaly_prob_threshold),(SELECT*FROMnew_data));

For more information on anomaly detection with ARIMA_PLUS time series models, please see the documentation here.
Thanks to the BigQuery ML team, especially Abhinav Khushraj, Abhishek Kashyap, Amir Hormati, Jerry Ye, Xi Cheng, Skander Hannachi, Steve Walker, and Stephanie Wang.
Transform Your Marketing Strategy with Tinyclues and Google Cloud CDP

2614
Of your peers have already read this article.
4:00 Minutes
The most insightful time you'll spend today!
Editor’s note: The post is part of a series highlighting our awesome partners, and their solutions, that are Built with BigQuery.
What are Customer Data Platforms (CDPs) and why do we need them?
Today, customers utilize a wide array of devices when interacting with a brand. As an example, think about the last time you bought a shirt. You may start with a search on your phone as you take the subway to work. During that 20 minute ride, you narrow down the type of shirt . Later, as you take your lunch break, you spend a few more minutes refining your search on your work laptop and you are able to find two shirt models of interest. Pressed for time, you add both to your shopping cart at an online retailer to review at a later point. Finally, after you arrive back home and as you are checking your physical mail, you stumble across a sales advertisement for the type of shirt that you are looking for, available at your local brick and mortar store. The next day you visit that store during your lunch break and purchase the shirt.
Many marketers face the challenge of creating a consistent 360 customer view that captures the customer lifecycle, as illustrated in the example above – including their online/offline journey, interacting with multiple data points across multiple data sources.
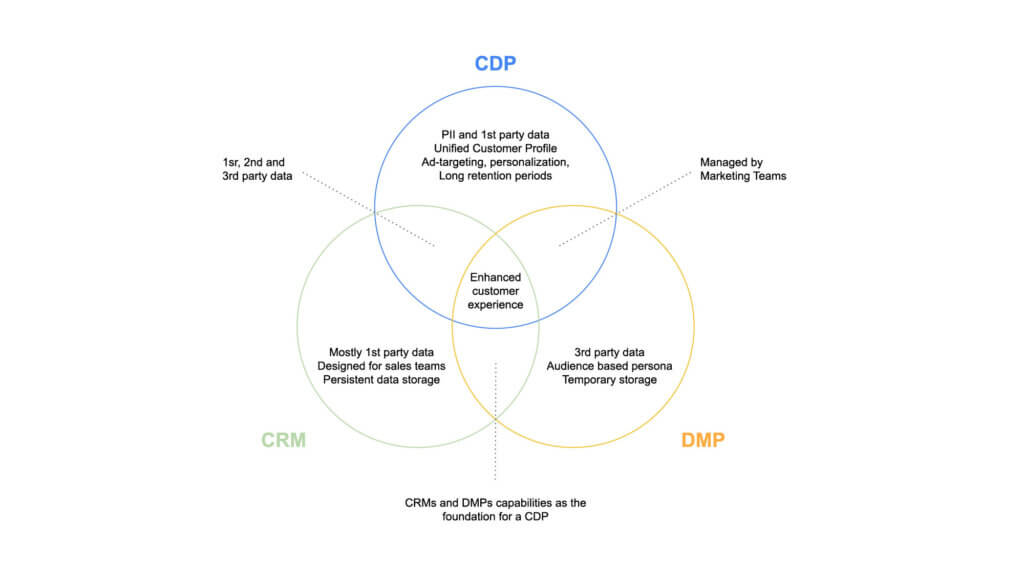
The evolution of managing customer data reached a turning point in the late 90’s with CRM software that sought to match current and potential customers with their interactions. Later as a backbone of data-driven marketing, Data Management Platforms (DMPs) expanded the reach of data management to include second and third party datasets including anonymous IDs. A Customer Data Platform combines these two types of systems, creating a unified, persistent customer view across channels (mobile, web etc) that provide data visibility and granularity at individual level.
A new approach to empowering marketing heroes
Tinyclues is a company that specializes in empowering marketers to drive sustainable engagement from their customers and generate additional revenue, without damaging customer equity. The company was founded in 2010 on a simple hunch: B2C marketing databases contain sufficient amounts of implicit information (data unrelated to explicit actions) to transform the way marketers interact with customers, and a new class of algorithms based on Deep Learning (sophisticated machine learning that mimics the way humans learn) holds the power to unlock this data’s potential. Where other players in the space have historically relied – and continue to rely – on a handful of explicit past behaviors and more than a handful of assumptions, Tinyclues’ predictive engine uses all of the customer data that marketers have available in order to formulate deeply precise models, down even to the SKU level. Tinyclues’ algorithms are designed to detect changes in consumption patterns in real-time, and adapt predictions accordingly.
This technology allows marketers to find precisely the right audiences for any offer during any timeframe, increasing engagement with those offers and, ultimately, revenue; additionally, marketers are able to increase campaign volume while decreasing customer fatigue and opt-outs, knowing that audiences are receiving only the most relevant messages. Tinyclues’ technology also reduces time spent building and planning campaigns by upwards of 80%, as valuable internal resources can be diverted away from manual audience-building.
Google Cloud’s Data Platform, spearheaded by BigQuery, provides a serverless, highly scalable, and cost-effective foundation to build this next generation of CDPs.
Tinyclues Architecture:
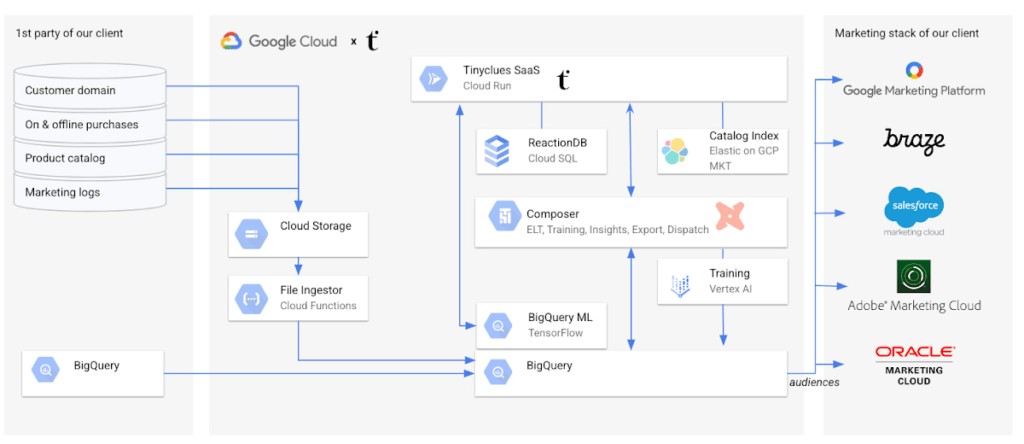
To enable this scalable solution for clients, Tinyclues receives purchase and interaction logs from clients in addition to product and user tables. In most cases, this data is already in the client’s BigQuery instance, in which case they can be easily shared with Tinyclues utilizing BigQuery authorized views.
In cases where the data is not in BigQuery, flat files are sent to Tinyclues via GCS and are ingested in the client’s data set via a lightweight Cloud Function. The orchestration of all pipelines is implemented via Cloud Composer (Google’s managed Airflow). The transformation of data is accomplished by utilizing simple select statements in the Data Built Tool (DBT), which is wrapped inside an airflow DAG that powers all data normalization and transformations. There are several other DAGs to fulfill more functionalities, including:
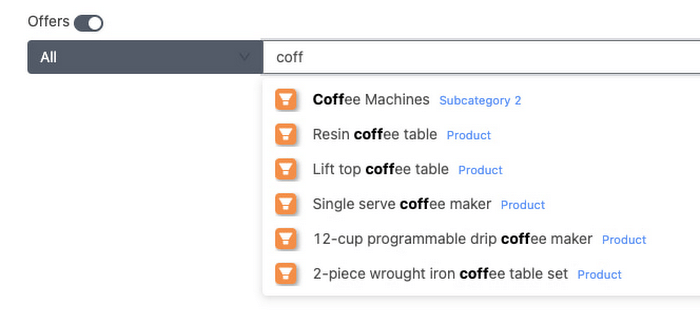
- Indexing the product catalog on Elastic Cloud (Elasticsearch managed service) on GCP to provide auto-complete search capabilities to TCs clients as shown below:
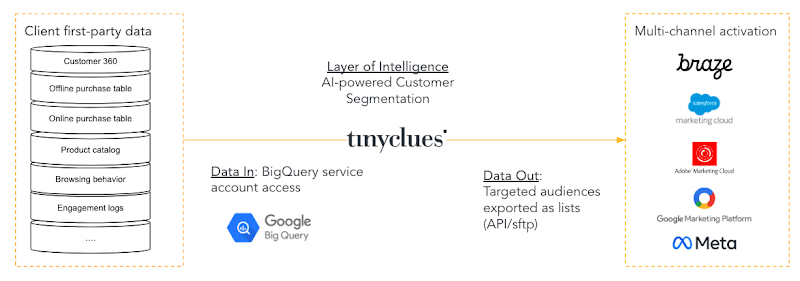
- The export of Tinyclues-powered audiences to the clients’ activation channels, whether they are using SFMC, Braze, Adobe, GMP, or Meta.
Tinyclues AI/ML Pipeline powered by Google Vertex AI
TCs ML Training pipelines are used to train models that calculate propensity scores. They are composed using Airflow DAGs, powered by Tensorflow & Vertex AI Pipelines. BigQuery is used natively, without data movement, to perform as much feature engineering as possible in-place.
TC uses the TFX library to run ML Pipelines in Vertex AI. Building on top of Tensorflow as their main deep learning framework of choice due to its maturity, open source platform, scalability and support for complex data structures (Ragged and Sparse Tensors).
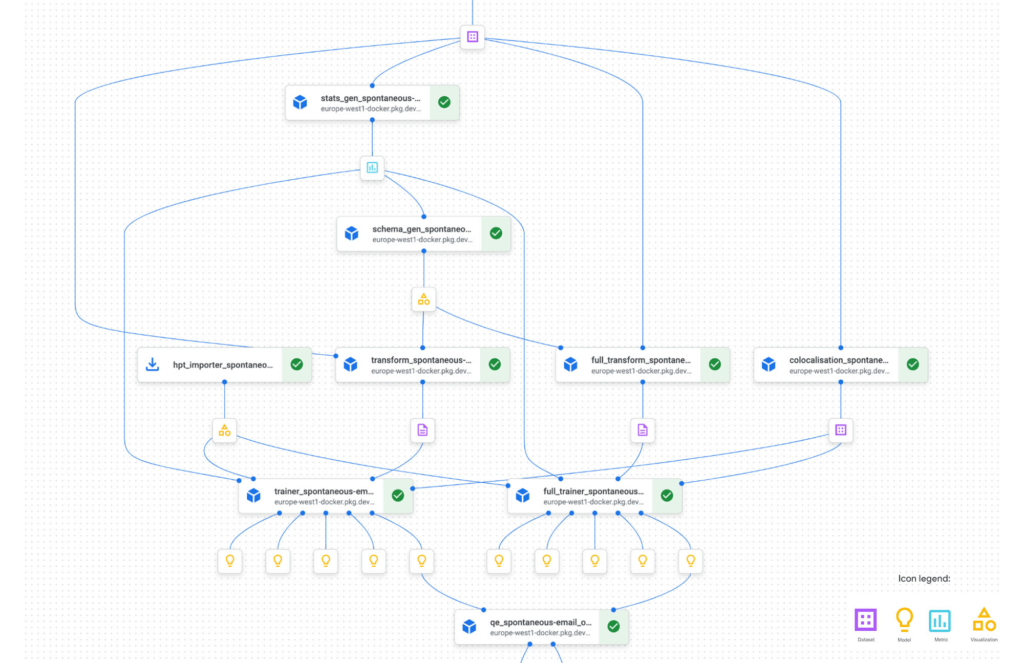
Below is a partial example of TC’s Vertex AI Pipeline graph, illustrating the workflow steps in the training pipeline. This pipeline allows for the modularization & standardization of functionality into easily manageable building blocks. These blocks are composed of TFX components (TC reuses most of the standard components in addition to customizing some such as a proprietary implementation of the Evaluator to compute both ML Metrics (which is part of the standard implementation) but also more Business Metrics like Overlap of clickers etc. The individual components/steps are chained with DSL to form a pipeline that is modular and easily orchestrated or updated as needed.
With the trained Tensorflow models available in GCS, TCs exposes these in BigQuery ML (BQML) to enable their clients to score millions of users for their propensity to buy X or Y within minutes. This would not be possible without the power of BigQuery and also frees TC from previously experienced scalability issues.
As an illustration, TC has the need to score thousands of topics among millions of users. This used to take north of 20 hours on their previous stack, and now takes less than 20 minutes thanks to the optimization work that TC has implemented in their custom algorithm and the sheer power of BQ to scale to any workload accordingly.
Data Gravity: Breaking the Paradigm – Bringing the Model to your Data
BQML enables TC to call pre-trained TensorFlow models within an SQL environment, thus avoiding exporting data in and out of BQ using already provisioned BQ serverless processing power. Using BQML removes the layers between the models and the data warehouse and allows them to express the entire inference pipe as a number of SQL requests. TC no longer has to export data to load it into their models. Instead, they are bringing their models to the data.
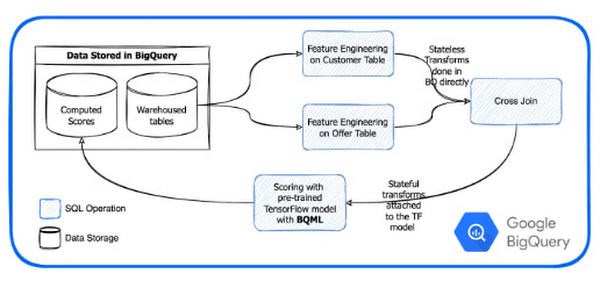
Avoiding the export of data in and out of BQ and the serverless provisioning and start of machines saves significant time. As an example, exporting an 11M lines campaign for a large client previously took 15 min or more to process. Deployed on BQML it now takes minutes with more than half of the processing time attributed to network transfers to our client system.
Inference times in BQML compared to TCs legacy stack:
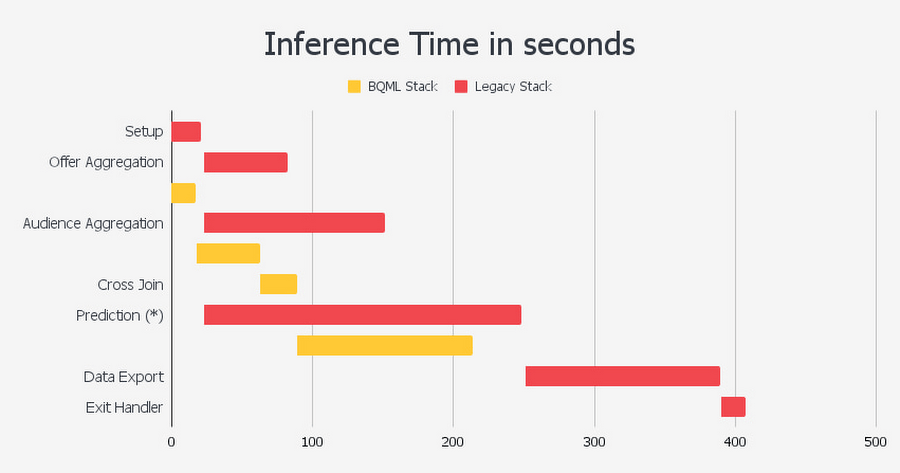
As can be seen, using this approach enabled by BQML, the reduction in the number of steps leads to a 50% decrease in overall inference time, improving upon each step of the prediction.
The Proof is in the pudding
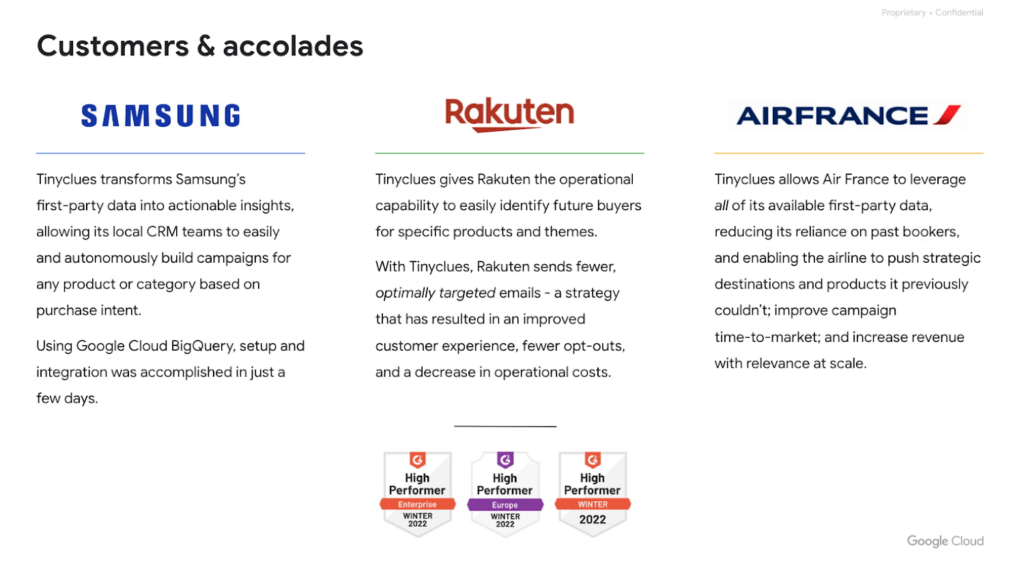
Tinyclues has consistently delivered on its promises of increased autonomy for CRM teams, rapid audience building, superior performance against in-house segmentation, identification of untapped messaging and revenue opportunities, fatigue management, and more, working with partners like Tiffany & Co, Rakuten, and Samsung, among many others.
Conclusion
Google’s data cloud provides a complete platform for building data-driven applications like the headless CDP solution developed by Tinyclues — from simplified data ingestion, processing, and storage to powerful analytics, AI, ML, and data sharing capabilities — all integrated with the open, secure, and sustainable Google Cloud platform. With a diverse partner ecosystem, open-source tools, and APIs, Google Cloud can provide technology companies the portability and differentiators they need to serve the next generation of marketing customers.
To learn more about Tinyclues on Google Cloud, visit Tinyclues. Click here to learn more about Google Cloud’s Built with BigQuery initiative.
We thank the many Google Cloud team members who contributed to this ongoing data platform collaboration and review, especially Dr. Ali Arsanjani in Partner Engineering.
Pindrop and Google Cloud Get Together to Make Way for Next Wave, Voice-first Interfaces!

2951
Of your peers have already read this article.
2:00 Minutes
The most insightful time you'll spend today!
If you’ve ever used only your voice to authenticate a payment, place an order, or check an account over the phone, there is a good chance that Pindrop’s technology made it possible.
Founded in Atlanta in 2011, Pindrop provides software and technology that uses machine learning, voice recognition, and behavioral analytics to help detect and prevent fraud in voice channels like AI-powered call centers and solve the long standing identity problem commonly encountered in customer care and contact center experiences. Demand for Pindrop’s technology has grown considerably over the past decade, as more organizations and people adopt voice as an interface for customer service, transactions, entertainment and more. As that demand has grown, safeguarding these voice interactions from fraud or authentication loops continues to be a unique challenge.
Now, with frictionless voice-driven customer experiences at an all-time high, cybersecurity is more critical than ever. In fact, research shows that fraudsters are able to accurately answer knowledge-based authentication questions 92% of the time, as opposed to only 46% for actual customers. To address this, Pindrop is bringing its products and technology to Google Cloud in order to scale and develop new capabilities that will help enable the next wave of voice-first interfaces and call centers.
The new partnership will enable Pindrop’s teams to accelerate their development of new capabilities to address an ever-shifting landscape – like detecting deep fakes and robocalls, helping banks authenticate transactions, providing retailers with AI-powered call center support, and helping IoT makers optimize for security, speed and simplicity.
More specifically, the partnership will help Pindrop scale its own businesses, and meet ever-growing customer needs in several ways.
First, Pindrop is bringing its SaaS platform to Google Cloud, enabling customers to deploy it at global scale, on secure, sustainable, and highly performant cloud infrastructure. Not only does this give Pindrop the ability to deliver secure voice interactions with low-latency, it also aligns with its mission to enable customer choice when selecting and implementing security technology. And for customers already operating on Google Cloud, getting started with Pindrop can be done directly within their cloud environment, now that the company is making its solutions available on Google Cloud Marketplace.
Second, Pindrop plans to offer its voice secure technology with Google Cloud’s Contact Center AI (CCAI) capabilities to develop new solutions that will enhance call center experiences. CCAI capabilities in understanding, augmenting, and ML-processing conversations allows companies to deliver interactions that are helpful and keep costs low. These capabilities alongside Pindrop’s authentication and anti-fraud solutions will enable the company with the tools and technologies needed to create the next evolution of frictionless experiences in a secure way.
Finally, building on top of Google Cloud will equip Pindrop with multicloud capabilities that will offer new channels to increase revenues through. Using technologies like Google Kubernetes Engine, frequently chosen by startups and tech companies, to quickly launch and scale new ML applications up or down will also support Pindrop’s growth as it adds to its suite of technologies.
Supporting innovative startups and digital native businesses like Pindrop is in Google’s DNA, and we’re delighted to support Pindrops’ growth, and the success of their customers, with Google Cloud infrastructure, Contact Center AI, and go to market expertise.
You can learn more about Pindrop on Google Cloud here, and Google Cloud’s Contact Center AI solution here.
Leave the Tax Filing to ML: Lending Doc AI’s Automation Classifying and Parsing IT Documents

2981
Of your peers have already read this article.
3:00 Minutes
The most insightful time you'll spend today!
In the United States, Tax Season descends upon the country every April, requiring millions of Americans to spend hours deciphering cryptic documents and performing complex math just to figure out what they owe. Wouldn’t it be grand if there was a way for a computer to take all the relevant documents and extract out exactly what the IRS is looking for? Lending Document AI from Google Cloud supports common document types used for Income Tax Filing, such as W-2s and 1099s. These advancements in machine learning technology now makes it possible to alleviate some anxiety leading up to April 15th.
Lending Document AI is a Document Understanding solution that allows for classification and parsing of documents commonly used in the mortgage lending industry. The data in these unstructured files is then converted into a structured format, which can be stored in a database or used for analysis and calculations. You can read more about the product in the announcement blog post. For this tax filing use case, we will focus on automatically classifying and parsing the 2020 editions of the following forms:
W-2
1099-DIV
1099-INT
1099-MISC
1099-NEC
This sample application creates an automated pipeline where the user can bulk upload a collection of PDFs, the Lending Document Splitter & Classifier will classify each document and send each PDF to the appropriate specialized parser to extract the data, which can then be used to calculate an individual tax return and fill out a 1040 Form.
Overview
Let’s explore how this application works. You can check out the sample code in this GitHub Repository.
Here is an outline of the architecture of this application. As you can see, it utilizes Cloud Run and Firestore in Native Mode for the web application in addition to Document AI.
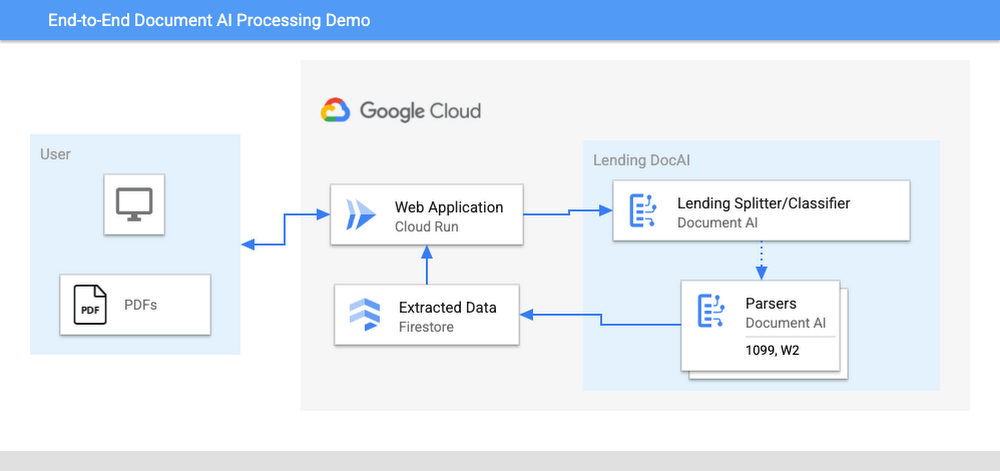
The User uploads multiple PDF files to the web application, hosted on Cloud Run.
An API call is made to the Lending Document Splitter & Classifier for each PDF file.
The output of the classifier (e.g. W-2, 1099-MISC, etc.) is then mapped to an appropriate specialized parser in the Google Cloud Project.
Each document file is sent to the appropriate specialized parser that matches the document type.
The entities are extracted by the parser processor and the data is written to Firestore.
The raw data is now retrieved from Firestore and displayed to the User showing the file classification and extracted values from each form.
The data values from all the forms are used together to calculate an individual income tax return.
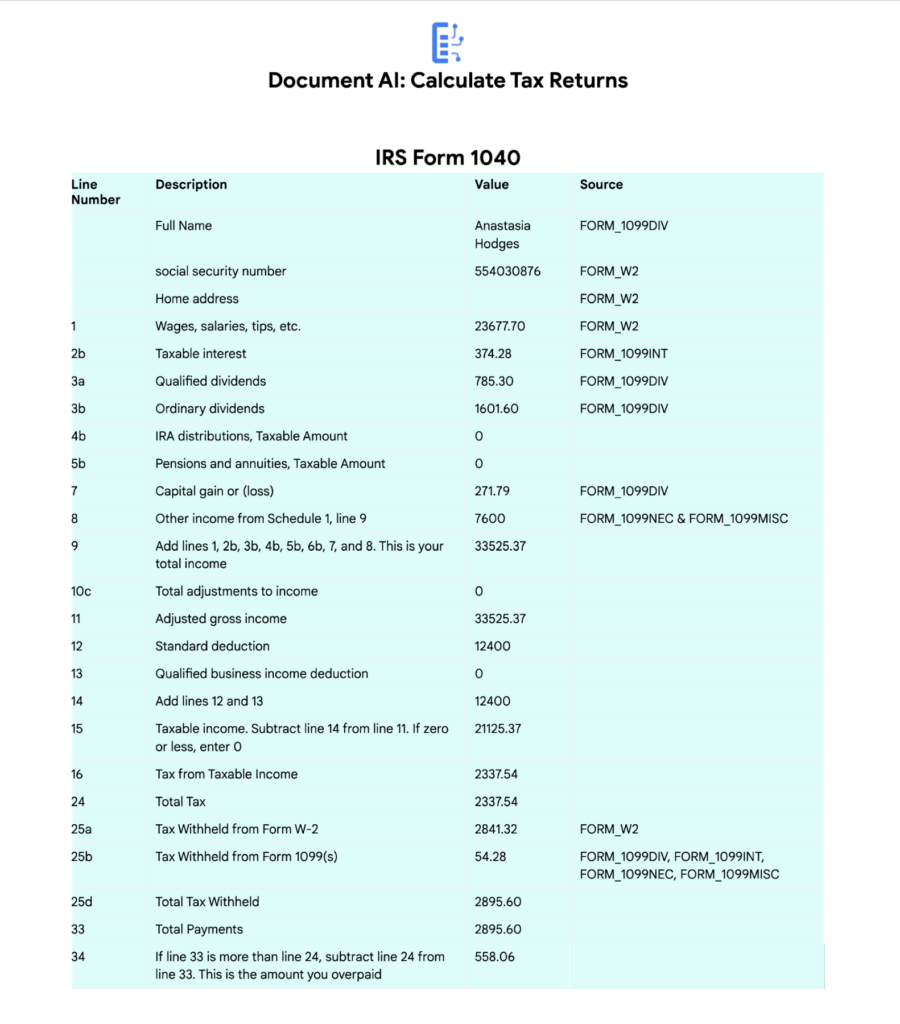
The Calculated Tax Rates/Incomes/Deductions are displayed to the User in a Tabular Format matching the IRS Form 1040. The app also displays which form data was used for each field. (Some output fields use values from multiple forms, such as line 25b.)
Step-by-Step directions
Want to try this out for yourself? Here’s how you can deploy and run this application using a Google Cloud Project. You can run this in Cloud Shell (Quickstart) or on your local machine.
NOTE: The Lending Processors in this Demo are in Limited GA as of March 2022. If you have a business use case for these processors, you can fill out and submit the Document AI limited access customer request form.
Install dependencies
- Clone the GitHub Repository to get the sample code.
git clone https://github.com/GoogleCloudPlatform/document-ai-samples.git
- Enter the directory for the tax pipeline demo
cd document-ai-samples/tax-processing-pipeline-python
- Install Python and the Google Cloud SDK if they aren’t already installed.
- Install the python libraries:
pip install -r requirements.txt
- Create a new Google Cloud project, and enable billing if you don’t already have one.
- Enable the Document AI API:
gcloud services enable documentai.googleapis.com
- Setup application default credentials:
gcloud auth application-default login
Deploy demo application
- Edit the config.yaml file, adding your own Project Details docai_processor_location: us # Document AI Processor Location (us OR eu)
docai_project_id: YOUR_PROJECT_ID # Project ID for Document AI Processors
firestore:
collection: tax_demo_documents # Set with your preferred Firestore Collection Name
project_id: YOUR_PROJECT_ID # Project ID for Firestore Database - Run setup scripts to create the processors and Cloud Run app in your project. python3 setup.py
gcloud run deploy tax-demo –source . - Visit the Deployed Web Page (You should get a link from the deployment command)
Calculate Tax Returns Homepage
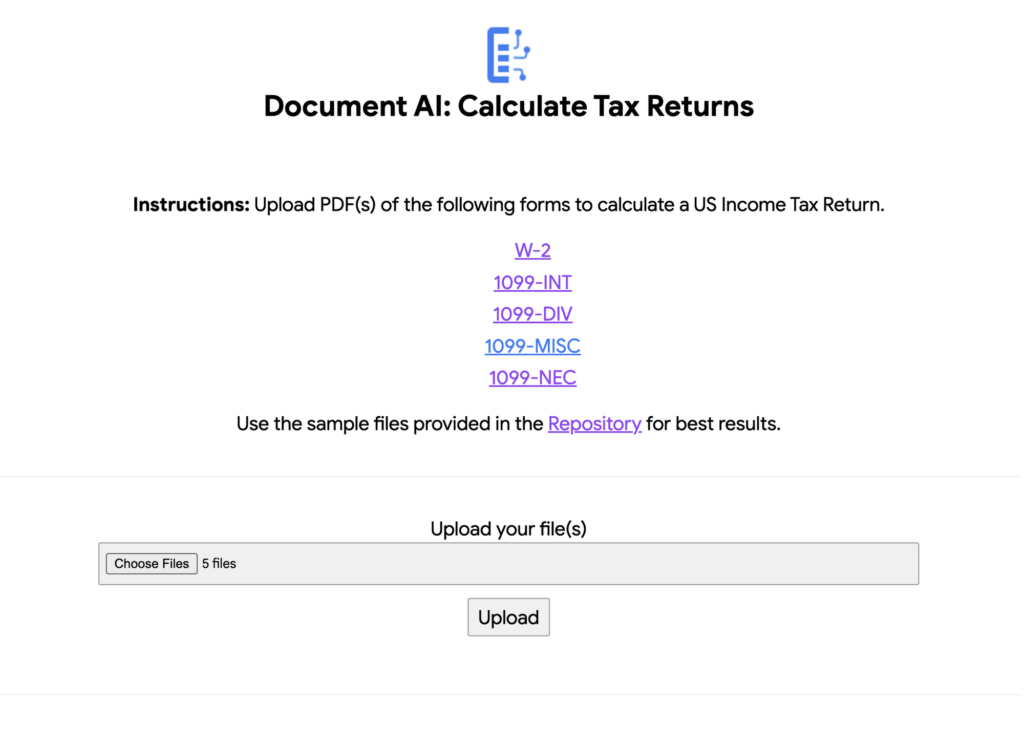
- Upload Documents. I created some sample documents you can download from the sample-docs folder of the repository.
This demo currently supports the following Document Types (2020 Editions)
W-2
1099-DIV
1099-INT
1099-MISC
1099-NEC
- Click “Upload” Button, wait for processing to complete.
The page will display the steps completed for each document file. These are also written to stdout for troubleshooting purposes.
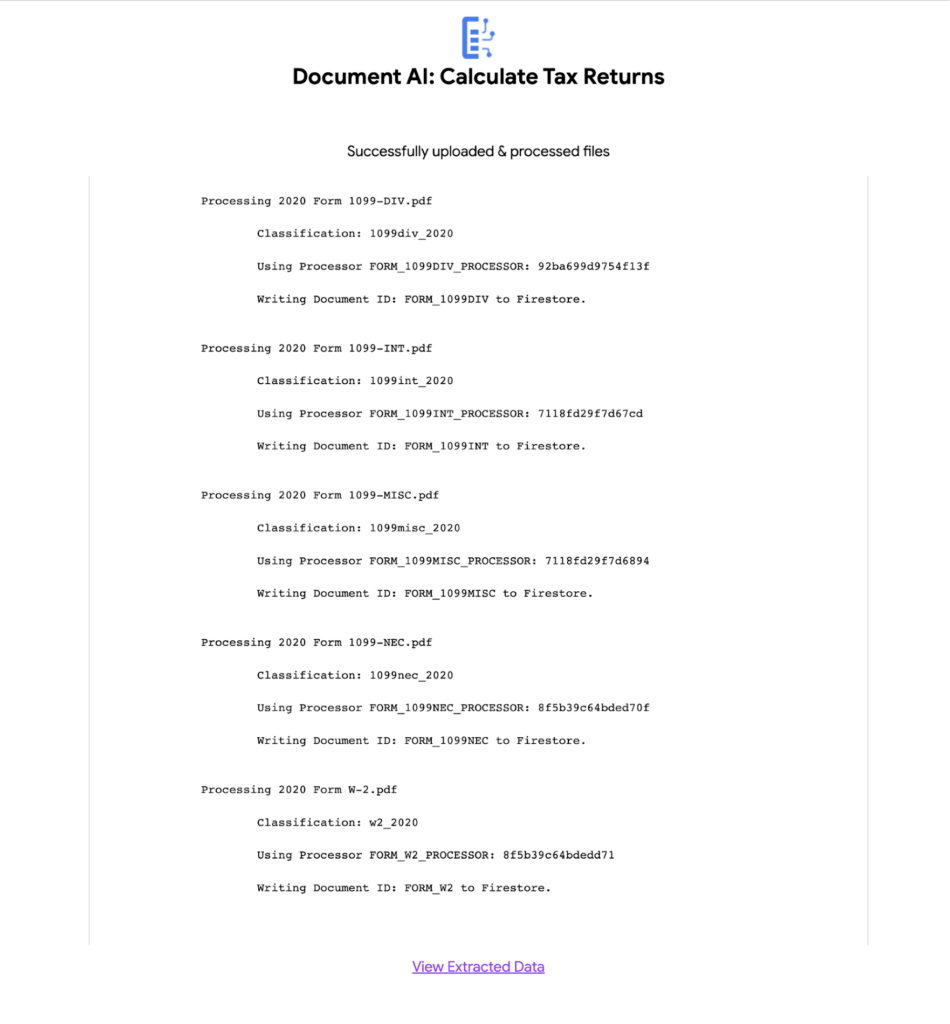
6. View the extracted values from each file.
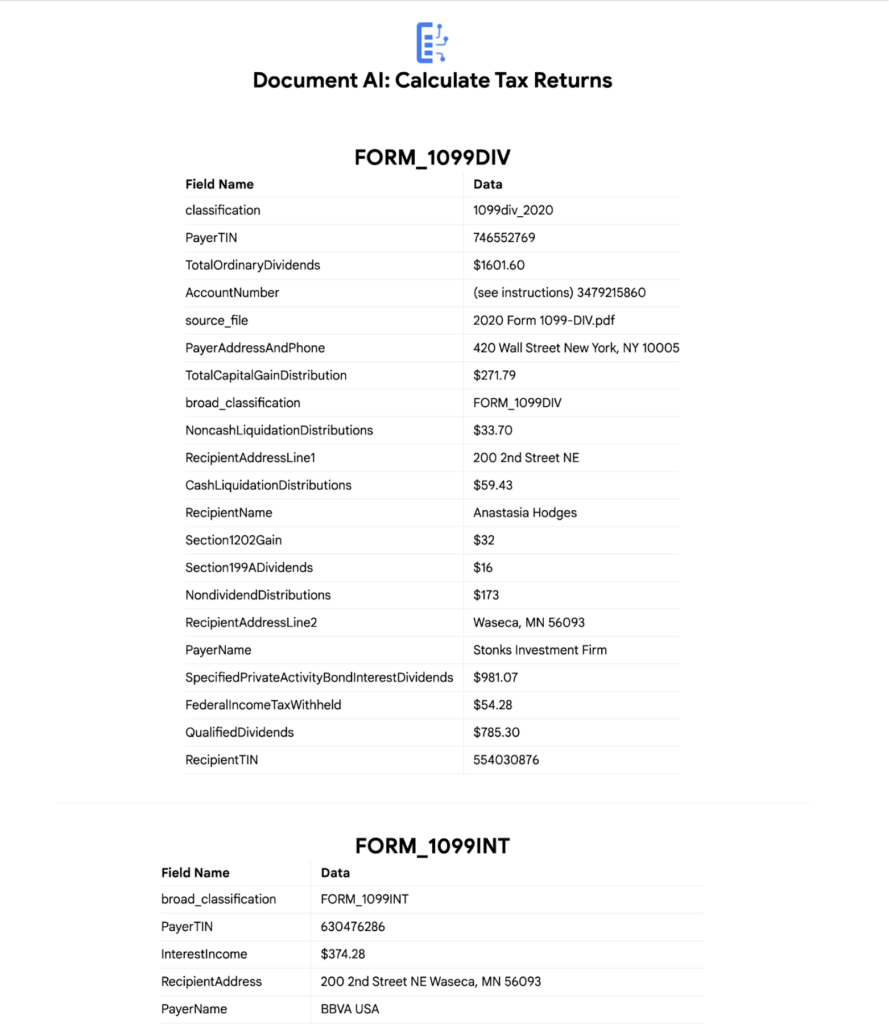
7. Click “Calculate Taxes” to see the tax calculation output
Conclusion
Warning: This is NOT financial advice, for educational purposes only.
Congratulations! You now have a fully functional tax processing application that can also be modified for use with other workflows that require data from multiple specialized documents.
The Document AI API is flexible and modular enough that most of the code in this example can be reused for any specialized processor.
Now tax returns can be filed with minimal manual effort!
If you want to learn more about Document AI, check out the Cloud Documentation and these videos:
- Getting started with the Document AI platform
- Process billions of pages and cut operational costs with DocAI
And if you want more hands-on experience, I recommend following these step-by-step codelabs to get started with the key features of Document AI:
Manipal Group: Delivering High-Quality Patient Care with Google Cloud

6474
Of your peers have already read this article.
4:30 Minutes
The most insightful time you'll spend today!
One of India’s best-known healthcare brands, Manipal Group prides itself on clinical excellence and a patient-centric approach. From humble beginnings in 1953 as a single teaching hospital—the Kasturba Medical College—in a university town in Karnataka, India, Manipal Group has grown to a presence in seven cities in India and operations in Malaysia and Nigeria. “Our founder, Dr T. M. A. Pai, established Kasturba Medical College just six years after India gained independence,” says C. G. Muthana, Chief Operating Officer, Teaching Hospitals, Manipal Health Enterprises Pvt. Ltd, part of Manipal Group.
Manipal Health Enterprises Pvt. Ltd operates 11 corporate, or for-profit, hospitals and five teaching hospitals. “We have about 7,000 beds India-wide, and on that measure, we are the third-largest private-sector healthcare provider in India today,” says Muthana. The organization now employs about 6,000 people in its corporate hospitals and 5,000 people in its teaching hospitals.
Manipal Health Enterprises Pvt. Ltd acquires and operates world-class medical technologies in its teaching and corporate hospitals. However, with 75% of corporate hospital wards allocated to fee-paying private patients—compared to just 25% of the wards in teaching hospitals—the differences in information technology budgets are significant. “In the general wards that comprise most of the wards in teaching hospitals, patients are typically treated for free or at heavily subsidized rates,” explains Muthana. “So revenues and costs of delivery vary between hospitals, while employee costs remain similar.”
Rostering nurses a critical task
Rostering nurses to work shifts is one of the most important tasks at Manipal Group corporate and teaching hospitals. As at all hospitals, nurses administer medications, monitor patients, maintain records, manage intravenous lines, and work with doctors to heal patients. They can also provide advice and support to patients and loved ones, including teaching them how to administer medication outside a hospital setting. If too few nurses are rostered for a particular shift, the quality of patient care may suffer.
Google Cloud results
- Enabled the hospital to correctly size its nursing workforce
- Lowers stress on nurses by delivering more equitable rostering
- Presents opportunity to better manage nurses’ leave and other administration tasks
However, rostering at the group’s hospitals was a time-consuming exercise. Senior nurses on each ward would have to spend up to 45 minutes per day manually amending paper-based rosters to accommodate requested changes to duty shifts for personal or other circumstances. The organization began receiving complaints from patients, doctors, and other hospital staff that, on occasion, too few nurses were rostered on for certain shifts—particularly at its flagship hospital in Bangalore. “We had based our rostering calculations on the number of beds occupied by patients and, when we investigated, we found at a macro level, we were rostering on the correct number of nurses,” says Muthana. “However, on some days, on wards optimally staffed by, say, 10 nurses per shift, we might have 14 nurses rostered on for one shift and seven rostered on for another shift. Those times we had seven, we had a clear shortage.”
In 2012, Muthana asked a consultant to develop algorithms to help automate the rostering. “Unfortunately, there were so many variables, the consultant failed to solve the problem,” he says. The Chief Operating Officer’s next step was to ask the founder and Chief Executive Officer of predictive analytics business Retigence Technologies—already working with the business on a materials management project—to develop an application to manage rostering.
Removing the daily drudgery
“Our plan with the automation project was to relieve our senior nurses of the daily drudgery of amending the rosters and to deliver rosters that were as fair as possible to all our staff,” says Muthana. “We also saw an opportunity to reduce our costs by reducing the overall number of nurses needed to look after our patients.”
Retigence Technologies’ team members then worked with the group’s nurses to capture the variables and requirements for the project. For example, a minimum number of nurses with one year experience or more needs to be rostered on for each shift. Retigence Technologies then started building an application using compute resources available through Compute Engine, a Google Cloud product. “We selected Google primarily because of its pioneering work in artificial intelligence (AI) and machine learning,” says Srinibas Behera, founder and Chief Executive Officer of Retigence Technologies.
With the nurses rostering application developed, Manipal Health Enterprises Pvt. Ltd undertook several pilots to build user acceptance. “Some of our senior nurses took time to accept the fact automation removed their control over rostering assignments, but were finally convinced by the better transparency the product offered,” says Muthana. The organization deployed the application to a smaller hospital and secured user support before rolling out the application to its Bangalore flagship.
Eliminating stress
Deploying the application has enabled Manipal Health Enterprises Pvt. Ltd to remove a buffer of about 100 nurses retained to accommodate the variations in number of nurses rostered for individual shifts. “The savings on those salaries more than paid for the cost of developing the application,” says Muthana.
The application also enabled the organization to reduce the stress on nurses—both the nurses in charge of the rosters and the nurses subject to the rosters. “Night shifts were more equitably distributed among the nurses, while we have been able to reduce the 45 minutes per day required to amend rosters to just 10 minutes,” says Muthana. “In Bangalore alone, we have 51 nurses in charge of rostering—so the combined saving there equates to nearly 30 hours per day.” This is freeing up these senior nurses to complete more important tasks.
The application was subsequently implemented at Kasturba Hospital, Manipal, again reducing the time needed to generate complete nursing rosters to less than 10 minutes.
Managing leave and training
The organization now plans to extend the application to manage leave and training for its nurses and other employees. “I would like to see every employee given an annual leave plan that is added to the roster at the start of the year,” says Muthana. “The flexibility and control afforded by the application would enable us to address challenges such as managing leave across a workforce with high attrition rates.” The organization would also be able to create a calendar to ensure nurses receive all their required training.
“We also plan to keep fine-tuning the application to deploy nurses more efficiently and continue to reduce their stress levels,” adds Muthana. “We also want to create a nursing load indicator tailored to patients’ specific circumstances. For example, a sedated patient may not require much nursing care, whereas a patient who comes in with a broken leg and may be on a ventilator may require assistance from three nurses at once.” The business plans to use Google’s AI and machine learning APIs in the future to improve the value and user experience of the product.
Ahead of the Curve: 5 Data and AI Trends Set to Shape 2023

2241
Of your peers have already read this article.
4:00 Minutes
The most insightful time you'll spend today!
How will your organization manage this year’s data growth and business requirements? Your actions and strategies involving data and AI will improve or undermine your organization’s competitiveness in the months and years to come. Our teams at Google Cloud have an eye on the future as we evolve our strategies to protect technology choice, simplify data integration, increase AI adoption, deliver needed information on demand, and meet security requirements.
Google Cloud worked with* IDC on multiple studies involving global organizations across industries in order to explore how data leaders are successfully addressing key data and AI challenges. We compiled the results in our 2023 Data and AI Trends report. In it, you’ll find the metrics-rich research behind the top five data and AI trends, along with tips and customer examples for incorporating them into your plans.

1: Show data silos the door
Given the increasing volumes of data we’re all managing, it’s no surprise that siloed transactional databases and warehousing strategies can’t meet modern demands. Organizations want to improve how they store, manage, analyze, and govern all their data, while reducing costs. They also want to eliminate conflicting insights from replicated data and empower everyone with fresh data.
A unified data cloud enables the integration of data and insights into transformative digital experiences and better decision making.
Andi Gutmans, GM and VP of Engineering for Databases, Google Cloud
In the report, you can learn how to adopt a unified data cloud that supports every stage of the data lifecycle so that you can improve data usage, accessibility, and governance. Inform your strategy by drawing on organizations’ examples such as a data fabric that improves customer experiences by connecting more than 80 data silos, as well as other unified data clouds that save money and simplify growth.

2: Usher in the age of the open data ecosystem
Data is the key to unlocking AI, speeding up development cycles, and increasing ROI. To protect against data and technology lock-in, more organizations are adopting open source software and open APIs.
Tweet this quote
Understand how you can simplify data integration, facilitate multicloud analytics, and use the technologies you want with an open data ecosystem, as described in the report. Learn from metrics about global open source adoption and public dataset usage. And explore how global companies adopted open data ecosystems to improve patient outcomes, increase website traffic by 25%, and cut operating costs by 90%.

3: Embrace the AI tipping point
Pulling useful information out of data is easier with AI and ML. Not only can you identify patterns and answer questions faster but the technologies also make it easier to solve problems at scale.
We’ve reached the AI tipping point. Whether people realize it or not, we’re already using applications powered by AI—every day. Social media platforms, voice assistants, and driving services are easy examples.
June Yang, VP, Cloud AI and Industry Solutions, Google Cloud
Organizations share how they’re reaching their goals using AI and ML by empowering “citizen data scientists” and having them focus on small wins first. Gain tips from Yang and other experts for developing your AI strategy. And read how organizations achieve outcomes such as a reduction of 7,400 tons per year in carbon emissions and a more than 200% increase in ROI from ad spend by using pattern recognition and other AI capabilities.

4: Infuse insights everywhere
Yesterday’s BI solutions have led to outdated insights and user fatigue with the status quo, based on generic metrics and old information. Research shows that as new tools come online, expectations for BI are changing, with companies revising their strategies to improve decision making, speed up the development of new revenue streams, and increase customer acquisition and retention by providing individuals with needed information on demand.
Organizations are equipping business decision-makers with the tools they need to incorporate required insights into their everyday workflows.
Kate Wright, Senior Director, Product Management, Google Cloud
In the report, you’ll discover why and how data leaders are rethinking their BI analytics strategies and applications to improve users’ trust and use of data in automated workflows, customizable dashboards, and on-demand reports. Global companies also share how they improve decision making with self-service BI, customer experiences with IoT analysis, and threat mitigation with embedded analytics.
5: Get to know your unknown data
Increasing data volumes can make it harder to know where and what data they store, which may create risk. Case in point: If a customer unexpectedly shares personally identifiable information during a recorded customer support call or chat session, that data might require specialized governance, which the standardized storage process may not provide.
If you don’t know what data you have, you cannot know that it’s accurately secured. You also don’t know what security risks you are incurring, or what security measures you need to take.
Anton Chuvakin, Senior Staff Security Consultant, Google Cloud
Check out the report to learn about data security risks that are often overlooked and how to develop proactive governance strategies for your sensitive data. You can also read how global organizations have increased customer trust and productivity by improving how they discover, classify, and manage their structured and unstructured data.
Be ready for what’s next
What’s exciting about these trends is that they’re enabling organizations across industries to realize very different goals using their choice of technologies. And although all the trends depend on each other, research shows you can realize measurable benefits whether you adopt one or all five.
Review the report yourself and learn how you can refine your organization’s data and AI strategies by drawing on the collective insights, experiences, and successes of more than 800 global organizations.
More Relevant Stories for Your Company

How TapClicks’ Google Cloud Migration Makes Life Easy for Marketers
Editor’s note: In this blog post we learn how TapClicks migrated to Google Cloud to offer their marketing customers a unified platform for data management, operations, insights, and analysis. TapClicks is a smart marketing cloud, powered by data, that unifies our customer’s marketing. By choosing to migrate our core applications last

Incorporating Custom Holidays into Your Time-Series Models with BigQuery ML
About three years ago, JCB, one of the biggest Japanese payment companies, launched a project to develop new high-value services with agility. We set up a policy of starting small from scratch without using the existing system, which we call the concept of “Dejima”, where we focused on improving various aspects

Discover Latest Resources on Google Cloud’s Datasets Solution
Editor’s note: With Google Cloud’s datasets solution, you can access an ever-expanding resource of the newest datasets to support and empower your analyses and ML models, as well as frequently updated best practices on how to get the most out of any of our datasets. We will be regularly updating this

Manhattan Associates and Google Cloud: How the Partnership Accelerates Future of Digital Retail
While the shift to digital business and the cloud has been well under way for some years now, organizations today have a new sense of urgency due to COVID-19. Delivering digital transformation is no longer a ‘nice to have’ option, rather, it is an operational imperative. Taking advantage of the
