





Making Streaming Analytics Simpler and More Cost-Effective With Cloud Dataflow

3891
Of your peers have already read this article.
8:30 Minutes
The most insightful time you'll spend today!
Streaming analytics helps businesses to understand their customers in real time and adjust their offerings and actions to better serve customer needs. It’s an important part of modern data analytics, and can open up possibilities for faster decisions.
For streaming analytics projects to be successful, the tools have to be easy to use, familiar, and cost-effective. Since its launch in 2015, Cloud Dataflow, Google’s fully managed streaming analytics service, has been known for its powerful API available in Java and Python. Businesses have almost unlimited customization capabilities for their streaming pipelines when they use these two languages, but these capabilities come at the cost of needing programming skills that are sometimes hard to find.
To advance Google Cloud’s streaming analytics further, Google Cloud is announcing new features available in the public preview for Cloud Dataflow SQL, as well as the general availability of Cloud Dataflow Flexible Resource Scheduling (FlexRS) for a very cost-effective way of batch processing of events. These new features make streaming analytics easier and more accessible to data engineers, particularly those with database experience.
Here’s more detail about each of these new features:
Cloud Dataflow SQL to create streaming (and batch) pipelines using SQL
We know that SQL is the standard for defining data transformations, and that you want more GUI-based tools for creating pipelines. With that in mind, several months ago we launched a public preview of Cloud Dataflow SQL, an easy way to use SQL queries to develop and run Cloud Dataflow jobs from the BigQuery web UI. Today, we are launching several new features in Cloud Dataflow SQL, including Cloud Storage file support and a visual schema editor.
Cloud Dataflow SQL allows you to join Cloud Pub/Sub streams with BigQuery tables and Cloud Storage files. It also provides several additional features:
- Using Streaming SQL extensions for defining time windows and calculating window-based statistics;
- Integration with Cloud Data Catalog for storing the schema of Cloud Pub/Sub topics and Cloud Storage file sets—a key enabler for using SQL with streaming messages;
- A simple-to-use graphical editor available in the BigQuery web UI. If you are familiar with BigQuery’s SQL editor, you can create Cloud Dataflow SQL jobs.
To switch the BigQuery web UI to Cloud Dataflow SQL editing mode, open the BigQuery web UI, go to More>Query settings and select “Cloud Dataflow” as the query engine.
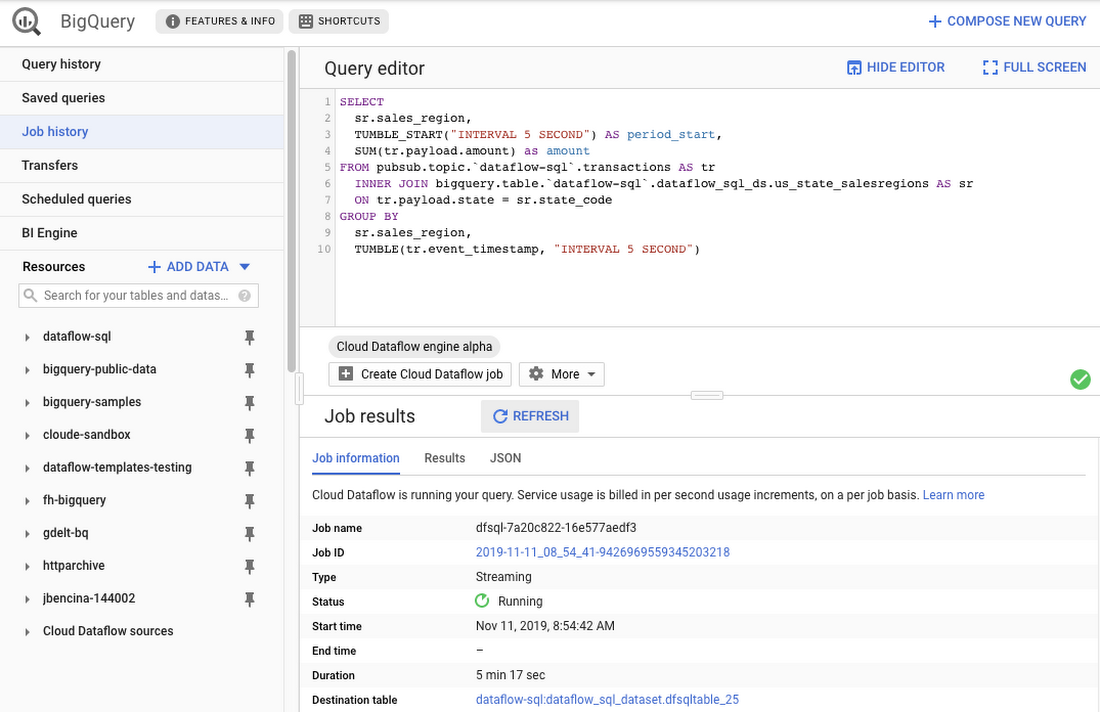
As an example, let’s say you have a Cloud Pub/Sub stream of sales transactions, and you want to build a real-time dashboard for the sales managers of your organization showing them the up-to-date stats of the sales in their regions. You can accomplish this in a few steps: write a SQL statement like the following one, launch a Cloud Dataflow SQL job, direct the output to a BigQuery table, then use one of the many supported dashboarding tools, including Google Sheets, Data Studio, and others, to visualize the results.
SELECTsr.sales_region,TUMBLE_START("INTERVAL 5 SECOND") AS period_start,SUM(tr.payload.amount) as amountFROM pubsub.topic.`dataflow-sql`.transactions AS trINNER JOIN bigquery.table.`dataflow-sql`.dataflow_sql_ds.us_state_salesregions AS srON tr.payload.state = sr.state_codeGROUP BYsr.sales_region,TUMBLE(tr.event_timestamp, "INTERVAL 5 SECOND")
In this example, we are joining the “transactions” Cloud Pub/Sub topic in the “dataflow-sql” project with a metadata table in BigQuery called “us_state_salesregions.” This table contains a mapping between the state codes (present in the “transactions” Cloud Pub/Sub topic) and the sales regions “Region_1”, “Region_2”, .., “Region_N” that are relevant to the sales managers in our example organization. In addition to the join, we’ll do a streaming aggregation of our data, using one of the several windowing functions supported by Cloud Dataflow. In our case, we will use TUMBLE windows, which will divide our stream into fixed five-second time intervals, group all the data in those time windows by the sales_region field, and calculate the sum of sales in the sales region. We also want to preserve the start of each time window, via TUMBLE_START("INTERVAL 5 SECOND"), to plot sales amounts as a time series.
To start a Cloud Dataflow job, click on “Create Cloud Dataflow job” in the BigQuery web UI.
When data starts flowing into the destination table, it will contain three fields: the sales_region, the timestamp of the period start, and the amount of sales.
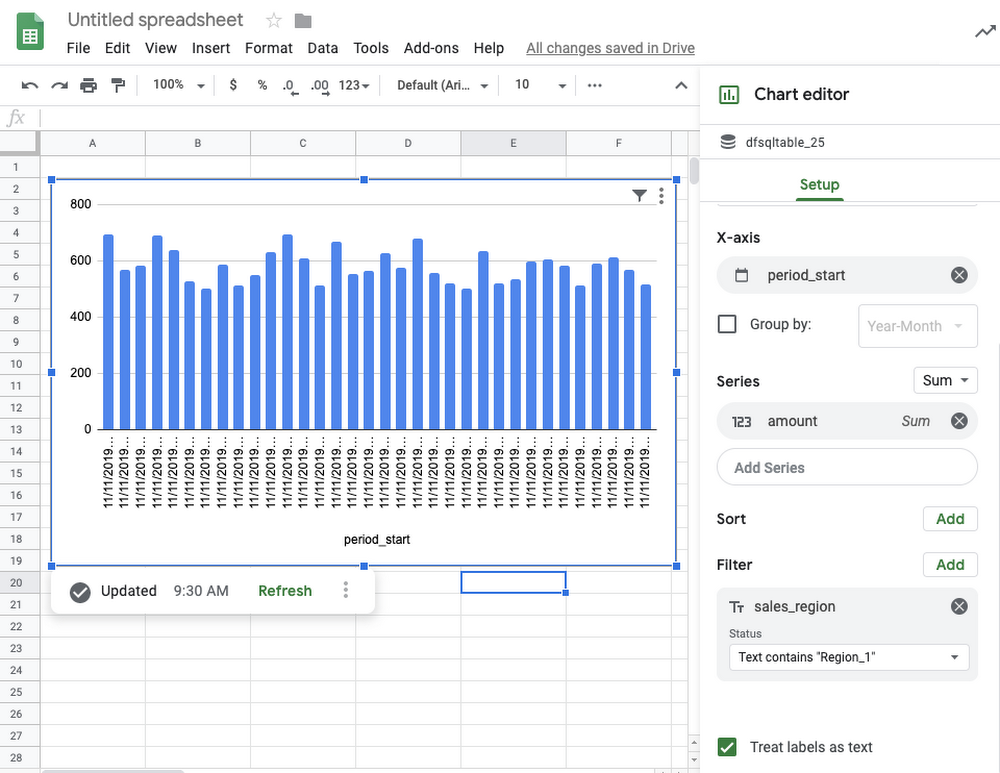
In the next step, we will create a BigQuery Connected Sheet that shows a column chart of sales in “Region_1” over time. Select the destination BigQuery table in the nav tree. In our case, it’s the dfsqltable_25 table.
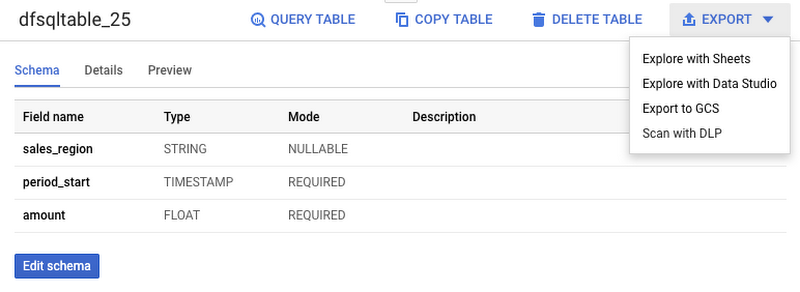
Then, select Export>Explore with Sheets to chart your data. Do it from the tab where your BigQuery table is shown, and not from the tab where your original Cloud Dataflow SQL was. In Sheets, create the column chart using the data connection to BigQuery, and choose period_start for the X-axis, amount as your data series, and add a sales_region filter. This is all you have to do to build a chart in Sheets that visualizes streaming data.
Mixing and joining data in Cloud Pub/Sub and BigQuery helps solve many real-time dashboarding cases, but quite a few customers have also asked for support of their Cloud Storage files to join those files with events in Cloud Pub/Sub or with tables in BigQuery. This is now possible in Dataflow SQL, enabled by our integration with Data Catalog’s Cloud Storage file sets.
In the following example, you’ll see an archive of transactions stored in CSV files in the “transactions_archive” Cloud Storage bucket.
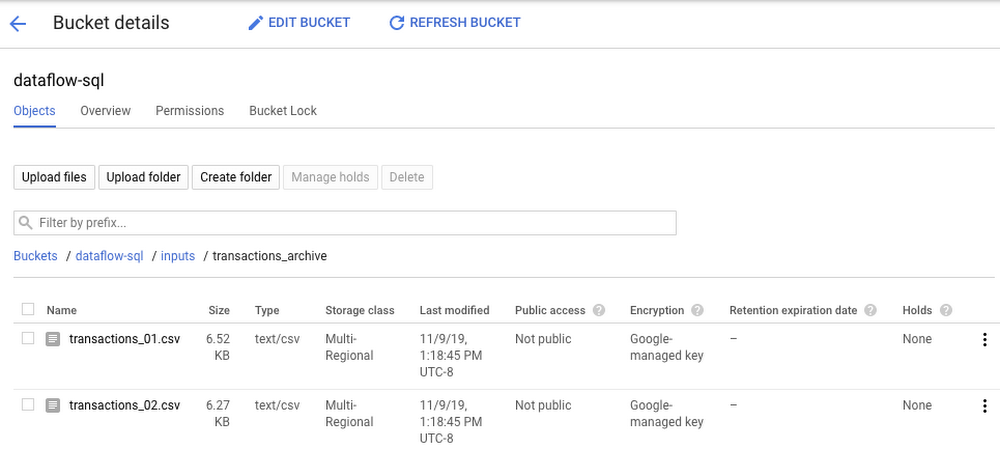
Two gcloud commands can define a Cloud Storage file set and entry group in Data Catalog.
#Create a GCS entrygroupgcloud beta data-catalog entry-groups create transactions_archive_eg --location=us-central1#Create the filesetgcloud beta data-catalog entries create transactions_archive_fs --location=us-central1 --entry-group=transactions_archive_eg --gcs-file-patterns=gs://dataflow-sql/inputs/transactions_archive/*.csv --description="Historical Archive of Transactions"
Notice how we defined the file pattern “gs://dataflow-sql/inputs/transactions_archive/*.csv” as part of the file set entry definition. This pattern is what will allow Cloud Dataflow to find the CSV files once we write the SQL statement that references this file set.
We can even specify the schema of this transactions_archive_fs file set using a GUI editor. For that, go to the BigQuery web UI (make sure it is running in Cloud Dataflow mode), select “Add Data” in the left navigation and choose “Cloud Dataflow sources.” Search for your newly added Cloud Storage file set and add it to your active datasets in the BigQuery UI.
This will allow you to edit the schema of your file set after you select it in the nav tree. The “Edit schema” button is right there on the “Schema” tab. The visual schema editor is new and works for both Cloud Storage file sets as well as for Cloud Pub/Sub topics.
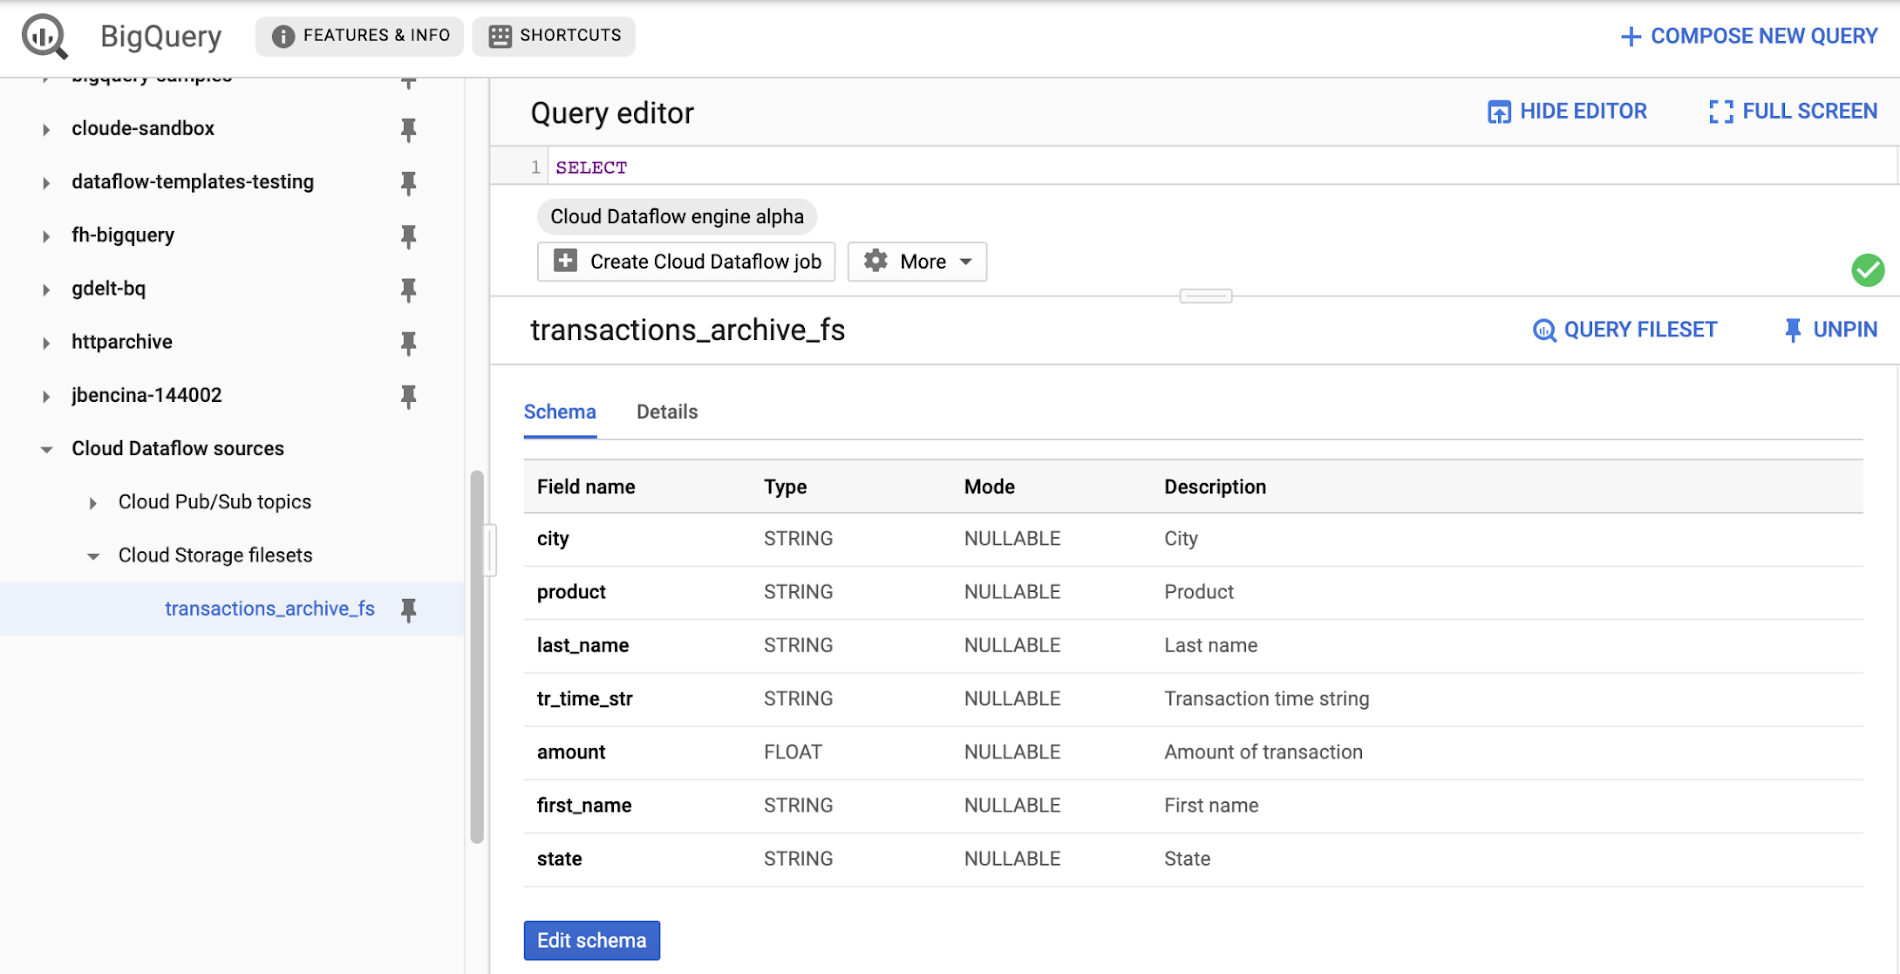
Once you’ve registered the file set in Data Catalog and defined a schema for it, you can query it in Cloud Dataflow SQL. In the next example, we’ll join the transactions archive in Cloud Storage with the metadata mapping table in BigQuery.
SELECTsr.sales_region,TUMBLE_START("INTERVAL 5 SECOND") AS period_start,SUM(tr.amount) as amountFROM datacatalog.entry.`dataflow-sql`.`us-central1`.transactions_archive_eg.transactions_archive_fs AS trINNER JOIN bigquery.table.`dataflow-sql`.dataflow_sql_ds.us_state_salesregions AS srON tr.state = sr.state_codeGROUP BYsr.sales_region,TUMBLE(CAST(tr.tr_time_str AS TIMESTAMP), "INTERVAL 5 SECOND")
Notice how similar this SQL statement is to the one that queries Cloud Pub/Sub. The TUMBLE window function even works on Cloud Storage files, although we will define the windows based on a field “tr_time_str” that is inside the files (the Cloud Pub/Sub SQL statement used the tr.event_timestamp attribute of the Cloud Pub/Sub stream). The only other difference is the reference to the Cloud Storage file set. We accomplish this by specifying datacatalog.entry.`dataflow-sql`.`us-central1`.transactions_archive_eg.transactions_archive_fs AS tr
Because both of the job inputs are bounded (batch) sources, Cloud Dataflow SQL will create a batch job (instead of a streaming job created for the first SQL statement using a Cloud Pub/Sub source) which will join your Cloud Storage files with the BigQuery table, and write the results back to BigQuery.
And now you have both a streaming pipeline feeding your real-time dashboard from a Cloud Pub/Sub topic, as well as a batch pipeline capable of onboarding historical data from CSV files. Check out the SQL Pipelines tutorial to start applying your SQL skills for developing streaming (and batch) Cloud Dataflow pipelines.
FlexRS for cost-effective batch processing of events
While real-time streaming processing is an exciting use case that’s growing rapidly, many streaming practitioners know that every stream processing system needs a sprinkle of batch processing (as you saw in the SQL example). When you bootstrap a streaming pipeline, you usually need to onboard historical data, and this data tends to reside in files stored in Cloud Storage. When streaming events need to be reprocessed due to changes in business logic (i.e., time windows get readjusted, or new fields are added), this reprocessing is also better done in batch mode.
The Apache Beam SDK and the Cloud Dataflow managed service are well-known in the industry for their unified API approach to batch and streaming analytics. The same Cloud Dataflow code can run in either mode with just minimal changes (usually replacing the data source from Cloud Pub/Sub to Cloud Storage). Remember our SQL example, where switching the SQL statement from a streaming source to a batch source was no trouble at all? And while it’s easy to go back and forth between streaming and batch processing in Cloud Dataflow, an important factor influencing the processing choice is cost. Customers who gravitate to batch processing have always looked to find the right balance between the speed of execution and costs. In many cases, that may mean you can be flexible with the amount of time it takes to process a dataset if the overall cost of processing is reduced in a significant fashion.
Our new Cloud Dataflow FlexRS feature reduces batch processing costs by up to 40% using advanced resource scheduling techniques and a mix of different virtual machine (VM) types (including the preemptible VM instances) to decrease processing costs while providing the same job completion guarantees as regular Cloud Dataflow jobs. FlexRS uses the Cloud Dataflow Shuffle service, which allows it to handle the preemption of worker VMs better because the Cloud Dataflow service does not have to redistribute unprocessed data to the remaining workers.
Using FlexRS requires no code changes in your pipeline and can be accomplished by simply specifying the following pipeline parameter:
--flexRSGoal=COST_OPTIMIZED
Running Cloud Dataflow jobs with FlexRS requires autoscaling, a regional endpoint in the intended region, and specific machine types, so you should review the recommendations for other pipeline settings. While Cloud Dataflow SQL does not yet support FlexRS, it will in the future.
Simultaneously with launching FlexRS in general availability, we are also extending its availability to five additional regions, covering all regions now where we have regional endpoints and Cloud Dataflow Shuffle:
- us-central1
- us-east1
- us-west1
- europe-west1
- europe-west4
- asia-east1
- asia-northeast1
To learn more about Cloud Dataflow SQL, check out our tutorial and try creating your SQL pipeline using the BigQuery web UI. Visit our documentation site for additional FlexRS usage and pricing information.
Check out other recently launched streaming and batch processing features:
- We deployed Cloud Dataflow Shuffle and Cloud Dataflow Streaming Engine to three additional regions, bringing total availability to seven regions.
- We launched the ability to protect your pipeline state with customer-managed encryption keys.
Python streaming support from Cloud Dataflow is now generally available.
10533
Of your peers have already watched this video.
2:15 Minutes
The most insightful time you'll spend today!
The True Story of How HotStar Broke a World-Record–Thanks to Firebase and Google BigQuery
Hotstar, India’s largest video streaming platform with 150 million monthly active users around the world, provides live-streaming of TV shows, movies, sports, and news on the go.
By using a combination of Firebase products together, Hotstar safely rolled out new features to its watch screen during a major live-streaming event without disrupting users, sacrificing stability, or releasing a new build. They also used Firebase with BigQuery to analyze their event data and reduce app startup time.
“We have an ambitious mission, but our engineering team is only a fraction of the size of most of our competitors. But we are still keeping up, and we are doing it with the help of Firebase,” says Ayushi Gupta, Android Engineer, Hotstar.
Your DW Need Scaling Up? Try What This Company Did: It Can Run 25,000 Events a Second

5076
Of your peers have already read this article.
7:30 Minutes
The most insightful time you'll spend today!
With access to more data than ever before, companies have never been better positioned to adopt precision marketing methods and target the right customers at the right time. Emarsys, a digital marketing platform, enables its clients to collect, analyze, and act on a wide variety of data. From websites to mobile apps to emails, Emarsys’ customers can handle data from all its digital channels on a single, easy-to-use platform. Emarsys also makes sure that customers receive the highest quality data possible, making for smarter decisions and better business practices.
“We were close to the limits of our internal data warehouse, scalability-wise. We didn’t want to get to the point where we’d have to delete data or cancel projects. In Google Cloud we saw a platform that could scale with our ambitions and be optimized for AI and real-time solutions.”
—Levente Otti, Head of Data, Emarsys
Since launching as an email solutions provider in 2000, Emarsys has grown into the world’s largest independent digital marketing platform, with more than 2,500 clients worldwide and reaching more than 1.4 billion people. By 2016, the company felt that its existing data warehouse platform was close to its limits, affecting not just day-to-day operations but also important strategic goals.
“We were close to the limits of our internal data warehouse, scalability-wise. We didn’t want to get to the point where we’d have to delete data or cancel projects,” says Levente Otti, Head of Data at Emarsys. “In Google Cloud, we saw a platform that could scale with our ambitions and be optimized for AI and real-time solutions.”
Minimal maintenance, unlimited scale with Google Cloud
Digital marketing is a highly competitive environment. Emarsys works alongside big players with a huge market share on the one hand and smaller, specialist companies on the other. It has thrived by successfully combining the all-inclusive offerings of the former with the agility of the latter, constantly looking for ways to innovate and improve. In recent years, the company had started to feel that the ability to handle large quantities of data was no longer enough. The next challenge was speed. “We truly believe that in the future, everything will be done in real time, including data processing, analytics, and AI predictive models,” Levente says.
At the start of 2016, Emarsys’ existing data warehouse was a software-as-a-service solution running on-premises, which required hardware and software maintenance in order to keep up with the company’s growing appetite for data-heavy use cases such as prediction and analytics. The existing platform had proven its worth processing large amounts of data in batches, but its real-time capabilities were limited. Moreover, Emarsys had begun to experiment with AI technology, but found that its data warehouse couldn’t scale to accommodate some of the more resource-intensive processes, such as training the predictive models. The company decided that it needed a new, cloud-based data platform.
After evaluating some of the leading cloud providers, Emarsys chose Google Cloud for its mature AI capabilities and its ease of use. “With the other solutions, we still had to rent virtual machines and hardware and be responsible for maintenance. At the time, Google Cloud was the only provider that could take that management overhead away from us, while keeping customers accounted for on every query level,” Levente says.
To implement its new data platform, Emarsys teamed up with Google Cloud Partner Aliz. Over a series of meetings, workshops, and architecture reviews, Aliz helped Emarsys navigate the Google Cloud ecosystem to find the right products for the solution it was looking for. “Aliz really helped us set off in the right direction,” explains Levente.
With Google BigQuery, we can run queries which process terabytes of data, in seconds. We can also develop our own user-defined functions, incorporating Bayesian statistics into our predictive algorithms. That means we can take into account historical data, resulting in much more accurate predictions in a scalable way within seconds.”
—Levente Otti, Head of Data, Emarsys
Emarsys’ new data platform would actually be two: one platform for batch processing data and one for real-time analysis and interactions. Firstly, a proprietary publishing component gathered all the data points from Emarsys’ various channels including the website, mobile, emails, and custom events. With Cloud Pub/Sub and Cloud Dataflow, Emarsys transported and processed the data into BigQuery, which allows for further work and reviews that take into account errors or delayed events. After this, the data was exported to the main batch processing platform, which ran on BigQuery. For the real-time analytics, Emarsys used Cloud Bigtable to access data and Cloud Dataflow to pipeline it into the real-time platform, which could communicate with AI components or interaction components via an API to deliver real-time interactions with customers.
On top of the overall data infrastructure, Emarsys built a new AI platform with Google Cloud components. Training the predictive models had been an issue in the past due to the large number of resources required, so Emarsys chose to use Google Kubernetes Engine clusters, which can scale up and down on demand, without the need for hardware configuration or management. The trained models were held securely in Cloud Storage. From here, they were integrated with BigQuery for power and flexibility, allowing Emarsys to improve not just the speed of its AI predictions but also the quality.
“With Google BigQuery, we can run queries which process terabytes of data, in seconds,” shares Levente. “We can also develop our own user-defined functions incorporating Bayesian statistics into our predictive algorithms. That means we can take into account historical data, resulting in much more accurate predictions in a scalable way within seconds.”
Real-time insight, long-term satisfaction
Google Cloud enabled Emarsys to build a scalable data and AI platform that delivers powerful, actionable insights in real time. According to Levente, the company wanted to spend less time managing overload and more time considering how it should handle data. An immediate result of the new platform has been that data is now available in a scalable way, without hardware additions and management.
“With Google Cloud, we’ve been able to build a truly real-time data platform. The norm used to be daily batch processing of data. Now, if an event happens, marketing actions can be executed within seconds, and customers can react immediately. That makes us very competitive in our market.”
—Levente Otti, Head of Data, Emarsys
The clear and innovative pricing schemes of Google Cloud have also brought a new level of accountability to Emarsys’ costs in a way that wasn’t possible with its on-premises infrastructure. “Now that we only pay for what we use, we can assign costs to specific customers or queries, which has a huge impact on our pricing and product development strategies,” says Levente.
Thanks to the power of BigQuery and the scale at which it can handle data, Emarsys can now apply its analytics and AI tools to their full potential. “It’s very important to enable our clients to create the best possible experience for customers,” says Levente. At the same time, the company has cut its AI platform costs by 70% with Kubernetes while increasing scalability compared to the previous solution. The whole data platform was built to be scalable, and its first big test came during the retail peak of Black Friday, when it comfortably handled 250,000 events per second. “Perhaps the biggest impact on the business came with the real-time nature of the new platform,” says Levente.
“With Google Cloud, we’ve been able to build a truly real-time data platform,” he explains. “The norm used to be daily batch processing of data. Now, if an event happens, marketing actions can be executed within seconds, and customers can react immediately. That makes us very competitive in our market.”
Since implementing the new platform, Emarsys has continued to innovate with it and is about to release a new Real-Time Decision Framework, which will provide customers with even more real-time products and tools. The company continues to work with Aliz and Google Cloud, exploring other products such as Google BigQuery ML and TensorFlow to improve its AI processes. “We had a problem that we wanted to tackle now, and for us, Google Cloud was the best way of doing that,” says Levente. “But it was also about looking ahead. We felt that Google Cloud offered us the best way of future-proofing our platform.”

Principles to Make Organizations Data Engineering Driven

4851
Of your peers have already read this article.
4:00 Minutes
The most insightful time you'll spend today!
In the “What type of data processing organisation” paper, we examined that you can build a data culture whether your organization consists mostly of data analysts, or data engineers, or data scientists. However, the path and technologies to become a data-driven innovator are different and success comes from implementing the right tech in a way that matches a company’s culture. In this blog we will expand the data engineering driven organizations and provide how it can be built from the first principles.
Not all organizations are alike. All companies have similar functions (sales, engineering, marketing), but not all functions have the same influence on the overall business decisions. Some companies are more engineering-driven, others are sales-driven, others are marketing-driven. In practice, all companies are a mixture of all these functions. In the same way, the data strategy can be more focused on data analysts, and others on data engineering. Culture is a combination of several factors, business requirements, organizational culture, and skills within the organization.
Traditionally organizations that focused on engineering mainly came from technology driven digital backgrounds. They built their own frameworks or used programming frameworks to build repeatable data pipelines. Some of this is due to the way the data is received, the shape the data is received and the speed of the data arrival as well. If your data allows it, your organization can be more focused on data analysis, and not so much on data engineering. If you can apply an Extract-Load-Transform approach (ELT) rather than the classic Extract-Transform-Load (ETL), then you can focus on data analysis and might not need extensive data engineering capability. For example, data that can be loaded directly into the data warehouse allows data analysts to also do data engineering work and apply transformations to the data.
This does not happen so often though. Sometimes your data is messy, inconsistent, bulky, and encoded in legacy file formats or as part of legacy databases or systems, with a little potential to be actionable by data analysts.
Or maybe you need to process data in streaming, applying complex event processing to obtain competitive insights in near real time. The value of data decays exponentially with time. Most companies can process data by the next day in batch mode. However, not so many are probably obtaining such knowledge the next second data is produced.
In these situations, you need the talent to unveil the insights hidden in that amalgam of data, either messy or fast changing (or both!). And almost as importantly, you need the right tools and systems to enable that talent too.
What are those right tools? Cloud provides the scalability and flexibility for data workloads that are required in such complex situations. Long gone are the times when data teams had to beg for the resources that were required to have an impact in the business. Data processing systems are no longer scarce, so your data strategy should not generate that scarcity artificially.
In this article, we explain how to leverage Google Cloud to enable data teams to do complex processing of data, in batch and streaming. By doing so, your data engineering and science teams can have an impact when (in seconds) after the input data is generated.
Data engineering driven organizations
When the complexity of your data transformation needs is high, data engineers have a central role in the data strategy of your company, leading to data engineering driven organization. In this type of organization, data architectures are organized in three layers: business data owners, data engineers, and data consumers.
Data engineers are at the crossroads between data owners and data consumers, with clear responsibilities:
- Transporting data, enriching data whilst building integrations between analytical systems and operational systems ( as in the real time use cases)
- Parsing and transforming messy data coming from business units into meaningful and clean data, with documented metadata
- Applying DataOps, that is, functional knowledge of the business plus software engineering methodologies applied to the data lifecycle
- Deployment of models and other artifacts analyzing or consuming data
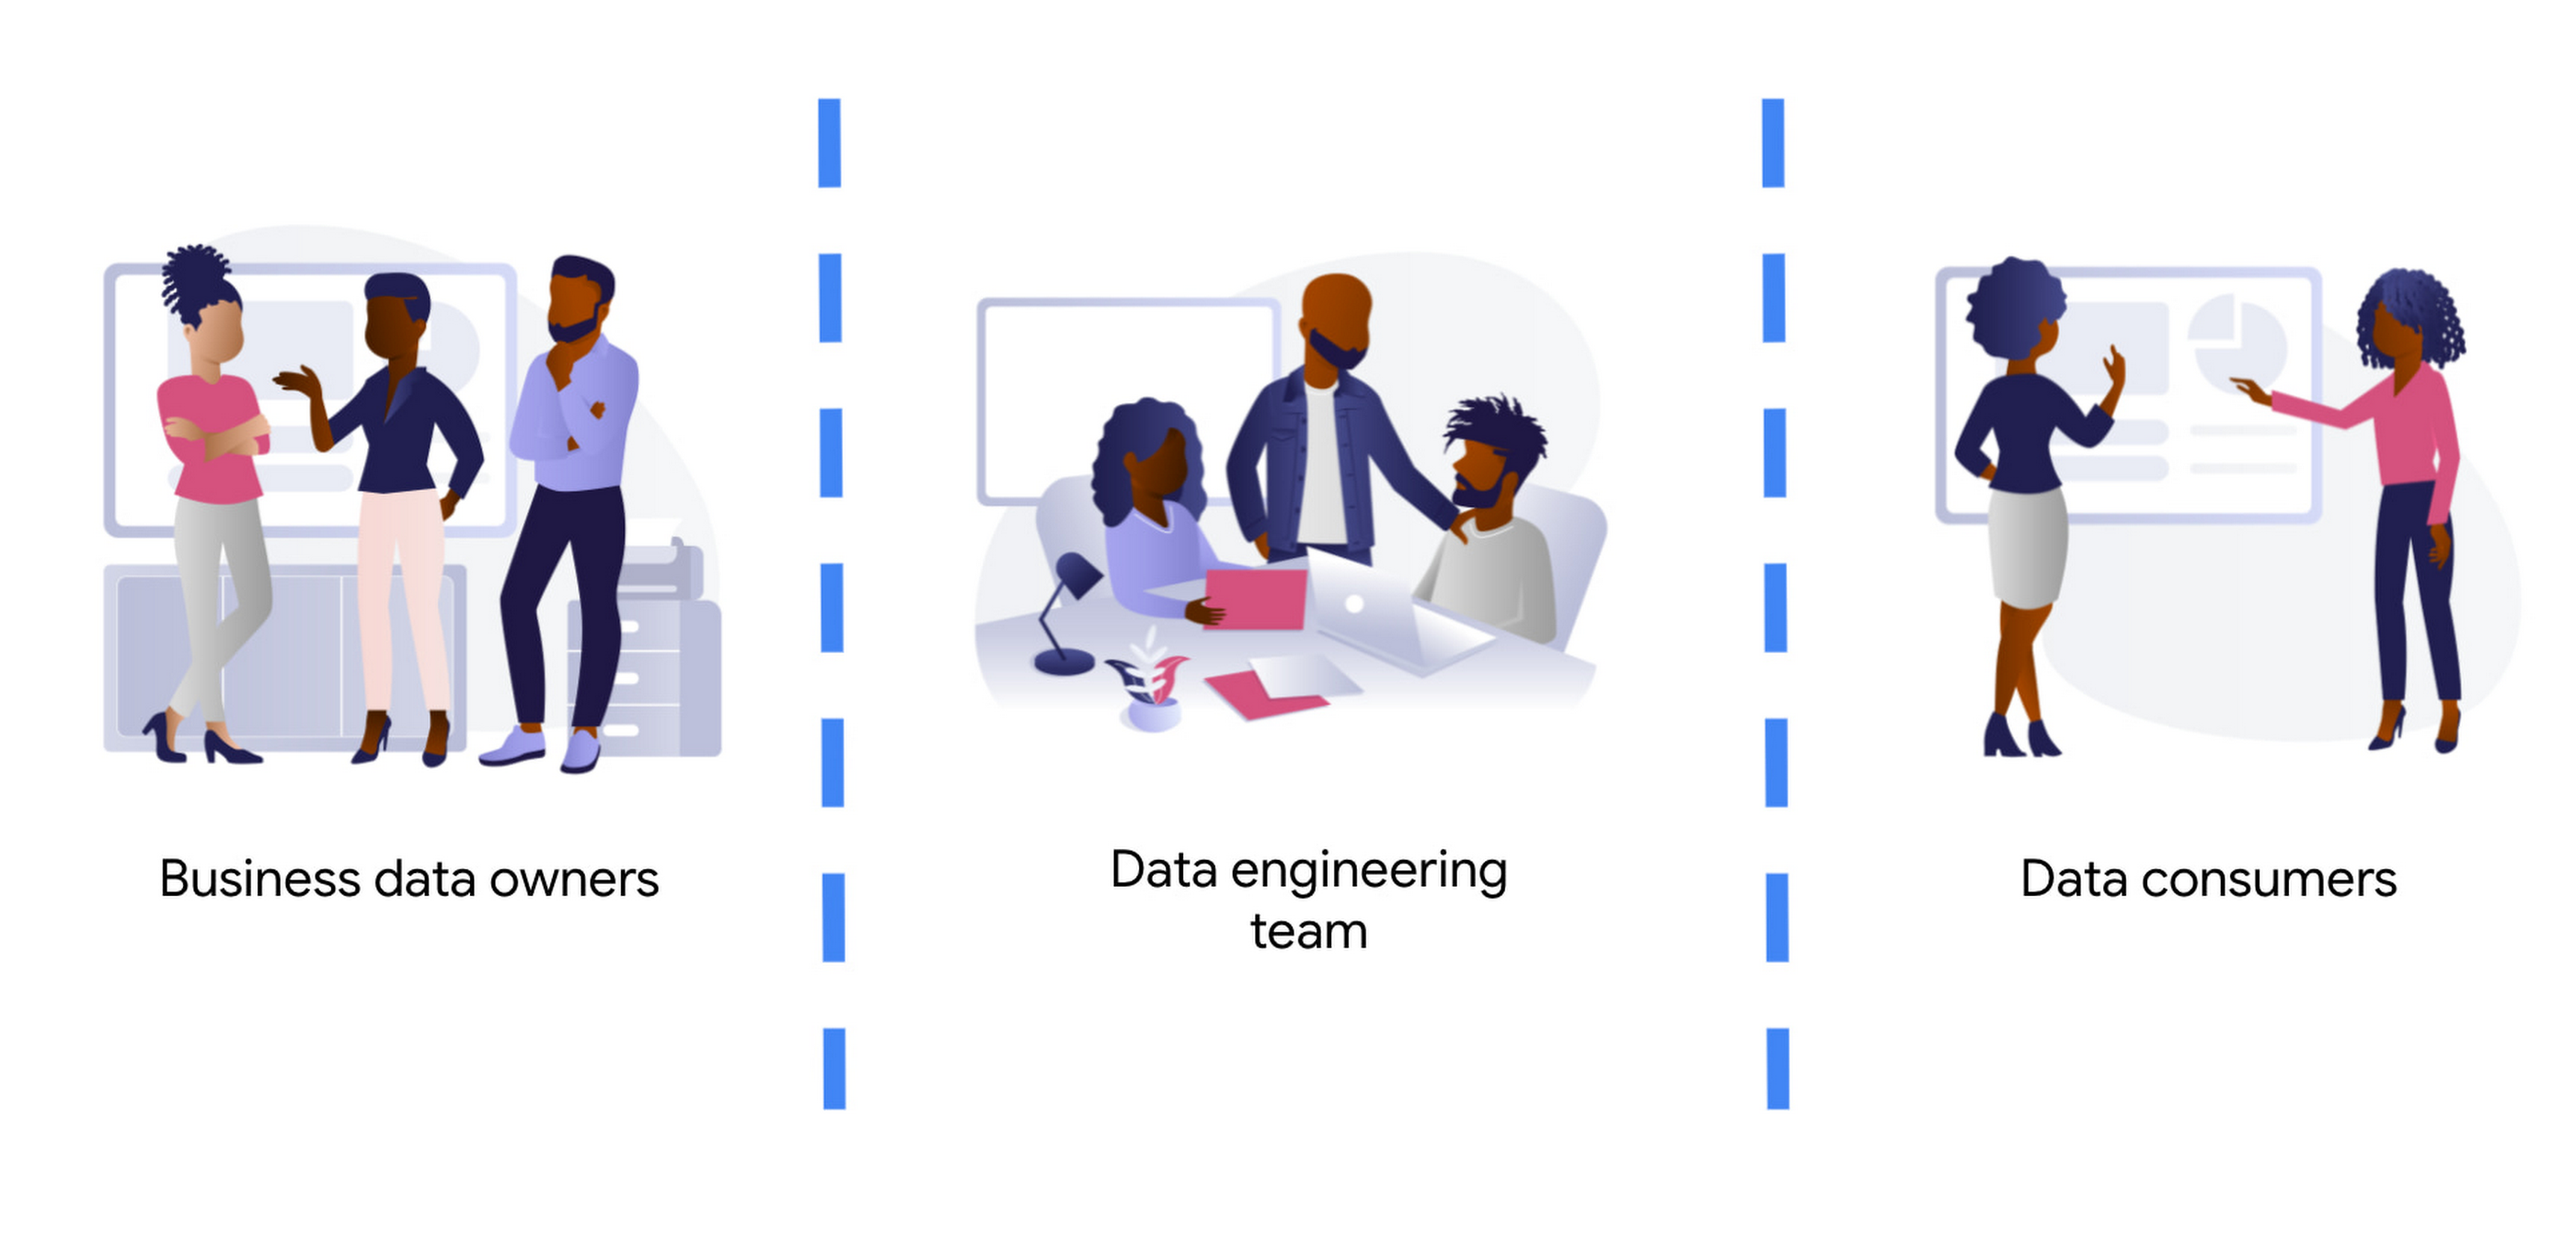
Business data owners are cross-functional domain-oriented teams. These teams know the business in detail, and are the source of data that feeds the data architecture. Sometimes these business units may also have some data-specific roles, such as data analysts, data engineers, or data scientists, to work as interfaces with the rest of the layers. For instance, these teams may design a business data owner, that is the point of contact of a business unit in everything that is related to the data produced by the unit.
At the other end of the architecture, we find the data consumers. Again, also cross-functional, but more focused on extracting insights from the different data available in the architecture. Here we typically find data science teams, data analysts, business intelligence teams, etc. These groups sometimes combine data from different business units, and produce artifacts (machine learning models, interactive dashboards, reports, and so on). For deployment, they require the help of the data engineering team so that data is consistent and trusted.
At the center of these crossroads, we find the data engineering team. Data engineers are responsible for making sure that the data generated and needed by different business units gets ingested into the architecture. This job requires two disparate skills: functional knowledge and data engineering/software development skills. This is often coined under the term DataOps (which evolved from DevOps methodologies developed within the past decades but applied to data engineering practices).
Data engineers have another responsibility too. They must help in the deployment of artifacts produced by the data consumers. Typically, the data consumers do not have the deep technical skills and knowledge to take the sole responsibility for deployment of their artifacts.This is also true for highly sophisticated data science teams. So data engineers must add other skills under their belt: machine learning and business intelligence platform knowledge. Let’s clarify this point, we don’t expect data engineers to become machine learning engineers. Data engineers need to understand ML to ensure that the data delivered to the first layer of a model ( the input ) is correct. They will also become key when delivering that first layer of data in the inference path, as here the data engineering skills around scale / HA etc really need to shine.
By taking the responsibility of parsing and transforming messy data from various business units, or for ingesting in real time, data engineers allow the data consumers to focus on creating value. Data science and other types of data consumers are abstracted away from data encodings, large files, legacy systems, complex message queue configurations for streaming. The benefits of concentrating that knowledge in a highly skilled data engineering team are clear, notwithstanding that other teams (business units and consumers) may also have their data engineers to work as interfaces with other teams. More recently, we even see squads created with members of the business units (data product owners), data engineers, data scientists, and other roles. Effectively creating complete teams with autonomy and full responsibility over a data stream, from the incoming data down to the data driven decision with impact in the business.
Reference architecture – Serverless
The number of skills required for the data engineering team is vast and diverse. We should not make it harder by expecting the team to maintain the infrastructure where they run data pipelines. They should be focusing on how to cleanse, transform, enrich, and prepare the data rather than how much memory or how many cores their solution may require.
The reference architectures presented here are based on the following principles:
- Serverless no-ops technologies
- Streaming-enabled for low time-to-insight
We present different alternatives, based on different products available in Google Cloud:
- Dataflow, the built-in streaming analytics platform in Google Cloud
- Dataproc, the Google Cloud’s managed platform for Hadoop and Spark.
- Data Fusion, a codeless environment for creating and running data pipelines
Let’s dig into these principles.
By using serverless technology we eliminate the maintenance burden from the data engineering team, and we provide the necessary flexibility and scalability for executing complex and/or large jobs. For example, scalability is essential when planning for traffic spikes during mega Friday for retailers. Using serverless solutions allows retailers to look into how they are performing during the day. They no longer need to worry about resources needed to process massive data generated during the day.
The team needs to have full control and write their own code for the data pipelines because of the type of pipelines that the team develops. This is true either for batch or streaming pipelines. In batch, the parsing requirements can be complex and no off the shelf solution works. In streaming, if the team wants to fully leverage the capabilities of the platform, they should implement all the complex business logic that is required, without artificially simplifying the complexity in exchange for some better latency. They can develop a pipeline that achieves a low latency with highly complex business logic. This again requires the team to start writing code from first principles.
However, that the team needs to write code should not imply that they need to rewrite any existing piece of code. For many input/output systems, we can probably reuse code from patterns, snippets, and similar examples. Moreover, a logical pipeline developed by a data engineering team does not necessarily need to map to a physical pipeline. Some parts of the logic can be easily reused by using technologies like Dataflow templates, and use those templates in orchestration with other custom developed pipelines. This brings the best of both worlds (reuse and rewrite), while saving precious time that can be dedicated to higher impact code rather than common I/O tasks. The reference architecture presented has another important feature: the possibility to transform existing batch pipelines to streaming.
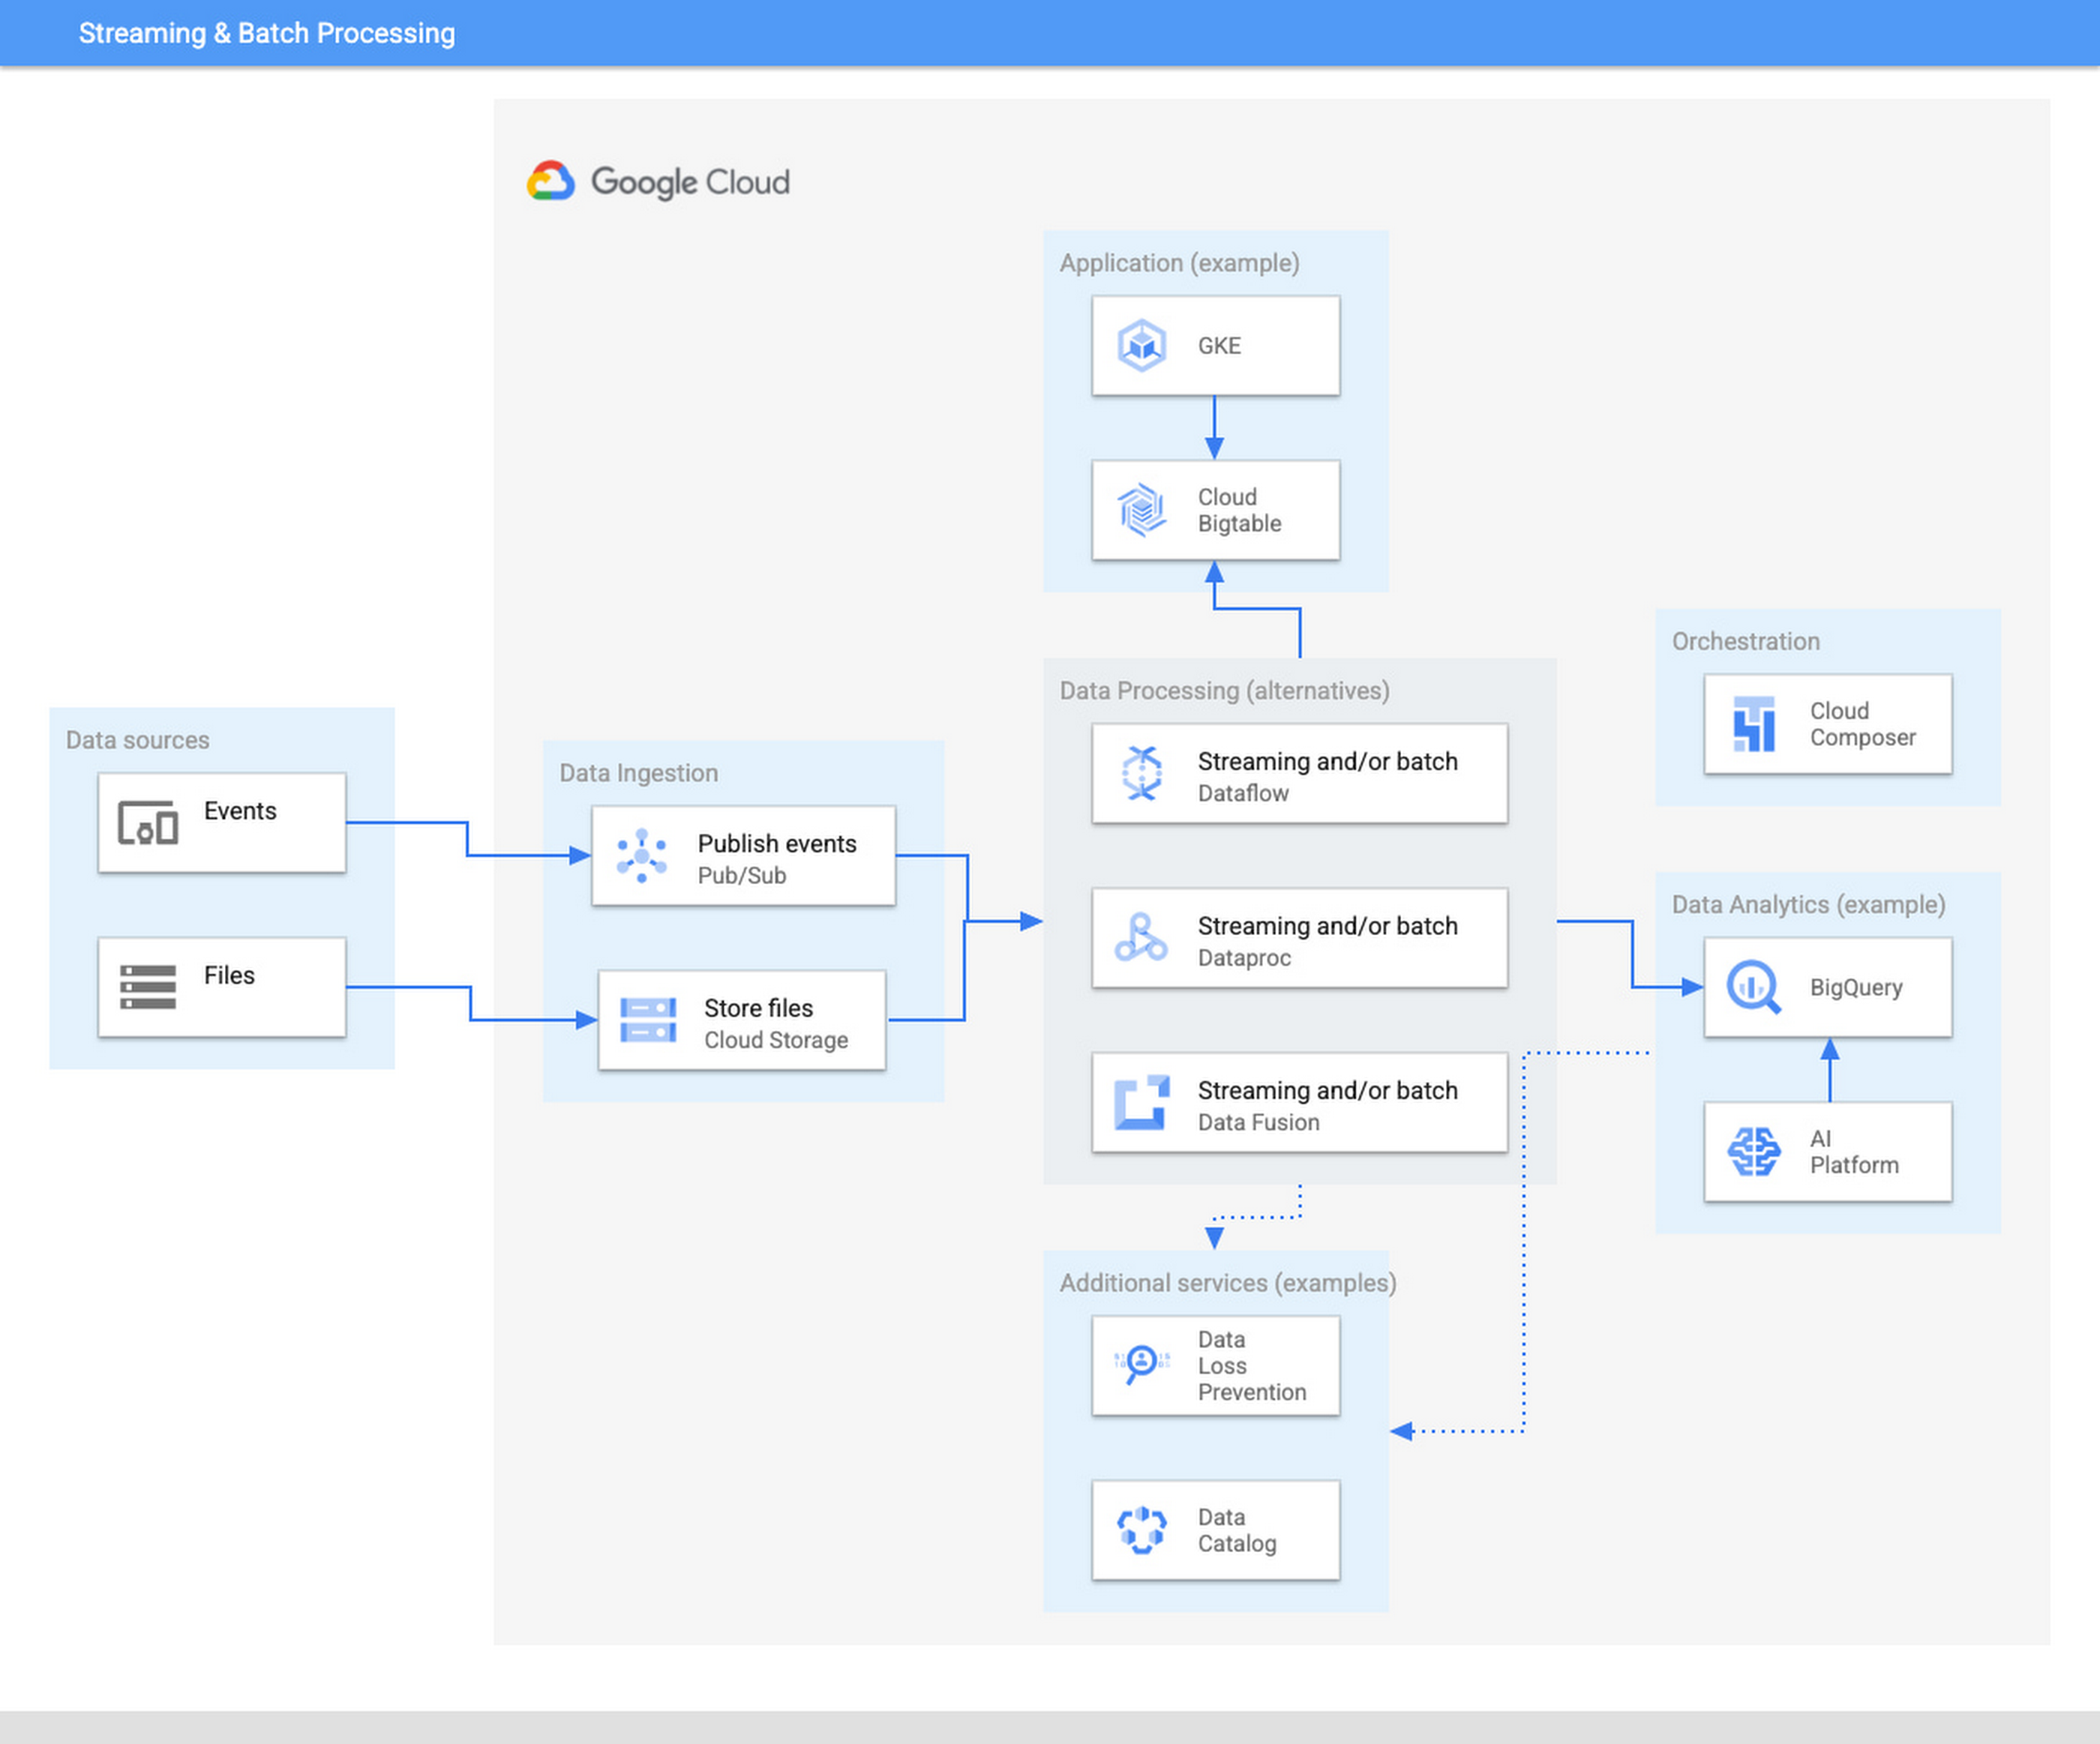
The ingestion layer consists of Pub/Sub for real time and Cloud Storage for batch and does not require any preallocated infrastructure. Both Pub/Sub and Cloud Storage can be used for a range of cases as it can automatically scale up with the input workload.
Once the data has been ingested, our proposed architecture follows the classical division in three stages: Extract, Transform, and Load (ETL). For some types of files, direct ingestion into BigQuery (following an ELT approach) is also possible.
In the transform layer, we primarily recommend Dataflow as the data process component. Dataflow uses Apache Beam as SDK. The main advantage of Apache Beam is the unified model for batch and streaming processing. As mentioned before, the same code can be adapted to run in batch or streaming by adapting input and output. For instance, switching the input from files in Cloud Storage to messages published in a topic in Pub/Sub.
One of the alternatives to Dataflow in this architecture is Dataproc, Google Cloud’s solution for managed Hadoop and Spark clusters. The main use case is for those teams that are migrating to Google Cloud but have large amounts of inherited code in Spark or Hadoop. Dataproc enables a direct path to the cloud, without having to review all those pipelines.
Finally, we also present the alternative of Data Fusion, a codeless environment for creating data pipelines using a drag-and-drop interface. Data Fusion actually uses Dataproc as its Compute Engine, so everything we have mentioned earlier applies also to the case of Data Fusion. If your team prefers to create data pipelines without having to write any code, Data Fusion is the right tool.
So in summary, these are the three recommended components for the transform layer:
- Dataflow, powerful and versatile with a unified model for batch and streaming processing. Straightforward path to move from batch processing to streaming
- Dataproc, for those teams that want to reuse existing code from Hadoop or Spark environments.
- Data Fusion, if your team does not want to write any code.
Challenges and opportunities
Data platforms are complex. Having on top of that data responsibility the duty to maintain infrastructure is a wasteful use of valuable skills and talent. Often data teams end up managing infrastructure rather than focusing on analyzing the data. The architecture presented in this article liberates the data engineering team from having to allocate infrastructure and tweak clusters but instead to focus on providing value through data processing pipelines.
For data engineers to focus on what they do best, you need to fully leverage the cloud. A lift & shift approach from any on-premise installation is not going to provide that flexibility and liberation. You need to leverage serverless technologies. As an added advantage, serverless lets you also scale your data processing capabilities with your needs, and be able to respond to peaks of activity, however large these are.
Serverless technologies sometimes face the doubts of practitioners: will I be locked in with my provider if I fully leverage serverless? This is actually a question that you should be asking when deciding whether to set up your architecture on top of a provider.
The components presented here for data processing are based on open source technologies, and fully interoperable with other open source equivalent components. Dataflow uses Apache Beam, which not only unifies batch and streaming, but also offers a widely compatible runner. You can take your code elsewhere to any other runner. For instance, Apache Flink or Apache Spark. Dataproc is a fully managed Hadoop and Spark based on the vanilla open source components of this ecosystem. Data Fusion is actually the Google Cloud version of CDAP, an open source project.
On the other hand, for the serving layer, BigQuery is based on standard Ansi SQL. Whereas in the case of Bigtable and Google Kubernetes Engine, Bigtable is compatible at API level with HBase, and Kubernetes is an open source component.
In summary, when your components are based on open source, like the ones included in this architecture, serverless does not lock you in. The skills required to encode business logic in the form of data processing pipelines are based on engineering principles that remain stable across time. The same principles apply if you are using Hadoop, Spark, or Dataflow or UI driven ETL tooling. In addition, there are now new capabilities, such as low-latency streaming, that were not available before. A team of data engineers that learn the fundamental principles of data engineering will be able to quickly leverage those additional capabilities.
Our recommended architecture separates the logical level, the code of your applications, from the infrastructure where they run. This enables data engineers to focus on what they do best and on where they provide the highest added value. Let your Dataflow and your engineers impact your business, by adopting the technologies that liberate them and allow them to focus on adding business value. To learn more about building an unified data analytics platform, take a look at our recently published Unified Data Analytics Platform paper and Converging Architectures paper.
Making Mothers’ Day Special: How Google Cloud Migration for 1-800-FLOWERS.COM, Inc Impacts CX

6853
Of your peers have already read this article.
2:30 Minutes
The most insightful time you'll spend today!
Editor’s note: In honor of Mother’s Day, we look at how 1-800-FLOWERS.COM, Inc. migrated to Google Cloud as part of its digital transformation to quickly deploy seamless and convenient customer experiences across multiple brands on Mother’s Day and every day.
As a leading provider of gifts designed to help customers express, connect, and celebrate, 1-800-FLOWERS.COM, Inc. has embraced cloud technologies to grow and transform its business through constant innovation. As part of our digital transformation, we recently completed the migration of our ecommerce platform and other services to Google Cloud. We’ve transitioned from a monolithic to a microservices platform, moved many workloads from our on-premises data centers to our Google Cloud environment, and scaled both horizontally and vertically.
Since our migration, we’ve developed efficient processes to launch new brands, improved the customer experience across all brands, and seen significantly increased site traffic.
Nurturing a more delightful customer journey
Customer delight is at the core of everything we do. Whether it be with a flower bouquet, a sweet treat, or a personalized keepsake, our mission is to deliver smiles. With the rise of the COVID-19 pandemic, we’ve all been challenged to find unique and safe ways to continue honoring the special connections in our lives and celebrating occasions with loved ones. Our customers have adapted by doing things such as sending gifts to isolated loved ones, sharing the same meal together virtually, or using video to engage with others through group activities like flower arranging and building charcuterie boards.
The customer experience is a top priority for us, and we constantly look for innovative ways to enhance the customer journey across our ecommerce platform of more than a dozen brands. As a result, we’ve continued to see a rise in demand as customers enjoy the ease and convenience of our site and discover our full family of brands.
Migrating to a cloud-first mindset
As we’ve continued to innovate and iterate on the customer experience, we knew we wanted to evolve our platform. We wanted to shift to a microservices platform, which would allow our team the opportunity to release updates to our site more often and set up the right continuous integration/continuous deployment (CI/CD) practices.
Working with Google Cloud, we were able to move our ecommerce platform to the cloud and standardize our site and brand deployment by building one release that could then be repeated across all of our brands. We built everything in a modular fashion, including microservices and code libraries, so that sites could be easily constructed and replicated for each brand. And because of this, we were able to launch Shari’s Berries extremely quickly after we acquired the brand in 2019.
Moving our platform to a completely homegrown solution of microservices was a daunting task. But our team handled it beautifully through load-testing, stress-testing, and building new monitoring tools. And with Google Cloud supporting us all along the way, managing the migration process was simple and easy from start to finish.
Arranging a better bouquet of services
Currently, we’ve migrated every customer-facing touchpoint for all of our brands to Google Cloud—whether it’s on the web or mobile, our AI bots, or our chat interfaces.
- We run on Google Kubernetes Engine and Istio.
- We have nearly 200 microservices built to help power our entire ecommerce stack across several cloud services running on Google Cloud.
- We’re utilizing BigQuery for our offline intelligence.
Results are coming up roses
Our new stack on Google Cloud has benefits for both us and our customers. We moved from a session-based to a token-based system, which provides enhanced security as well as a consistent, convenient experience across all our brands. Using service workers and a single-page app, we are able to download all the relevant site content to the browser in under two seconds to create an instant-click experience for each and every customer. We also use Google Analytics to measure our user interactions and provide personalized results to each customer. Our hope is that with this new system, we can learn from customer behavior to offer gift givers a more personalized shopping experience during each visit.
The benefits of our new tech stack have not only helped us enhance the solutions we offer to customers today, they’ve also enabled us to offer new ones at lightning speed. With our legacy system, we used to release new code once a week or once a month. Now, even during our peak periods, we’re able to release 10 to 15 times a day and can deploy and pivot quickly to create new microservices and microsites on the fly—often without having to touch any code.
Efficiencies abound
The benefits of moving our platform to Google Cloud have extended to our internal teams as well. Before the migration, we had only two environments for developing and testing, which made it time-consuming to test updates before they went into production. Now with Google Cloud, we have several different journey teams—which are made up of developers, product owners, and technical owners—all working in several different environments, solving problems, and creating new solutions together.
Everyone is now empowered to be self-sufficient, developing and releasing microservices on their own when they’re ready. This has given our developers more time to take part in continued development and learning opportunities. For example, we offer lunch-and-learn sessions as well as other resources for everyone to take advantage of so they can continue to learn and refine their skills.
Planting the seeds for future growth
As we look to the future and think about how we help our customers express, connect, and celebrate, we’ll continue to collaborate across teams to deliver solutions that spread smiles. Specifically, we’re exploring additional use of AI to help us better serve our customers across all our brands.
We’ve enjoyed the ongoing support we’ve received from the Google Cloud team as they help us build new solutions and design a road map for the future. Their support has helped the 1-800-FLOWERS.COM, Inc. team to realize the power of the cloud and bring the very best experience to our customers.
Learn more about 1-800-FLOWERS.COM, Inc., or check out our recent blog about cloud migration for the real world.
Vodafone Leverages Google Cloud to Aid COVID-19 Frontline with Anonymized Insights on Population Mobility

11204
Of your peers have already read this article.
1:30 Minutes
The most insightful time you'll spend today!
Editor’s note: When Europe’s largest mobile communications company, Vodafone, was asked by the European Commission to help understand population movement across the European Union and the UK to help fight COVID-19, it was able to provide anonymized mobile network-based insights to answer the call. Here’s how Vodafone, with the support of Google Cloud, rapidly mobilized the COVID-19 frontline, while respecting its customers’ privacy.
With the emergence of COVID-19 in early 2020, the European Commission—the executive branch of the European Union (EU)—knew that technology would be instrumental in its fight to control the pandemic. With various lockdowns imposed across its member states, the Commission was keen to predict and prevent the spread of COVID-19 and to manage the related social, political and financial impacts.
Mobile network data helps track COVID-19 across the EU
Mobile networks produce location data, which can be turned into useful anonymous insights to understand population movement within a geographic area. The European Commission, working with mobile industry association GSMA (Groupe Speciale Mobile Association), asked Europe’s major mobile phone operators for help in producing insights to support the fight against COVID-19. As the largest mobile network operator within the EU, Vodafone saw this as a critical opportunity to participate.
Vodafone had previous experience of using mobile network data to support pandemic research. For example, in 2019, Vodafone provided mobility pattern analysis to help track the spread of Malaria in Mozambique. And, during the early stages of the COVID-19 pandemic (prior to working with the European Commission), Vodafone assisted the Italian and Spanish governments in understanding their citizens’ mobility patterns. Vodafone had also previously offered anonymized and aggregated population mobility insights to support public transport and tourism authorities and retail organizations in a number of countries. Consequently, Vodafone was perfectly placed to play a greater role in supporting the European Commission’s response to the pandemic.
When asked to assist the European Commission, Vodafone first considered how it could safely share its data with the governing body without providing details on the individual movements of its customers. It realized it could achieve this through an elaborate set of anonymization and aggregation techniques. Insights are aggregated from a minimum of 50 users and Vodafone only shared these anonymous insights and never the actual raw data with the Commission. As specified by the EU, these insights are then presented onto a large geographical region, typically a city or a county with thousands of people living in that area.
These insights illustrate how people move, helping to determine how lockdowns and self-isolation measures were impacting behaviors.
Using Google Cloud to collate and store population mobility data
In April 2020, Vodafone began migrating its operations, including its mobile data, to Google Cloud on servers in Europe and the UK with elaborate security safeguards, including encryption, building on a previous partnership.
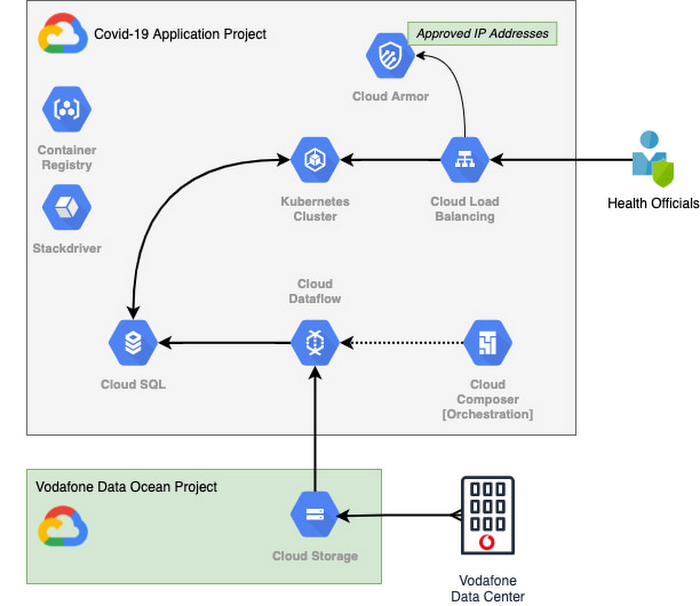
With the data residing in EU and UK data centers and not the United States, Vodafone could then retrieve anonymous insights from Google Cloud Storage instantaneously. Before supplying any information to the European Commission, however, Vodafone used Dataflow to validate the data and run a series of tests to ensure the database had accurate data, before ingesting and archiving the relevant metrics. For instant access, the data was then made available to the European Commission using a Redis database on Google Kubernetes Engine.
To ensure aggregate Vodafone customer data was always safe, secure, and anonymous, all entry points to the front-end were protected behind Google Cloud Armor, where only specific IP addresses were allowed. Using these tools, seamless data pipelines fed in predefined key performance indicators from each specified European market. While data quality measures ensured the definitions for metrics across markets were consistent and could be accurately compared.
The architecture (pictured below) shows how Vodafone integrated and anonymized its data on Google Cloud.
Live interactive dashboard shows population mobility in real-time
With its data integrated on Google Cloud, Vodafone created a live, interactive dashboard to track mobility patterns and share relevant information with the European Commission in real-time.
The European Commission Joint Research Center (JRC) was able to gather valuable information from these insights, which enabled them to see where population mobility was aiding the spread of the disease, when cross-referenced with health data. It could also assess the implications of lockdowns on different populations and forecast cross-country spreading.
Mobile data aids disease modeling for multiple stakeholders
The Vodafone data became instrumental in modeling the likely course of the disease too. For example, the University of Southampton in the UK used it to predict the outcome of different coordinated COVID-19 exit strategies across Europe. This research was published in Science Magazine in September 2020.
The Vodafone data dashboard continues to be used by individual governments, NGOs and organizations to further investigate the impacts of the pandemic and to measure the effectiveness of response strategies alongside the rollout of vaccination programs. The project also helped Vodafone win a DataIQ award for most effective stakeholder engagement.
Using the learnings from this project, Vodafone has been able to adapt its own B2B solution, called Vodafone Analytics, by adaptIng and migrating the code to work in Google Cloud Platform. This solution has been rolled out across Germany, Greece, Portugal and South Africa, and new countries are being onboarded every day. Vodafone Analytics already has more than 100 customers leveraging it for a variety of use cases—Italian fashion retailer OVS, uses it for its smart retail operation, while global real estate company, JLL, uses it to understand the footfall passing through its properties.
Working together, Vodafone and Google Cloud continue to help a range of organizations, governments, and NGOs navigate through the ongoing pandemic, optimize their operations, and help the greater good, without infringing individuals’ fundamental rights to privacy.
To learn more about Google Cloud and Vodafone, watch our full interview here.
More Relevant Stories for Your Company

Mrs. T’s Pierogies Moves SAP Systems to Google Cloud for Faster Analytics Capabilities for its SAP Data
Pierogies might just be the ultimate comfort food. But when Mrs. T’s Pierogies — the leading manufacturer of frozen pierogies in the US — learned it needed to transition its existing on-premises SAP ECC to S/4HANA, the company sought a little comfort for itself. Founded in 1952, Mrs. T’s Pierogies


Hospitals Can Offer Interconnected Patient Experiences Using Google’s Natural Language Services
Machine Learning (ML) in healthcare helps extract data from conversations, medical records, forms, research reports, insurance claims and other documents across the care value-chain to help care providers have a holistic view of their patients to draw insights for diagnoses and treatments. With Natural Language Processing(NLP), healthcare organizations can program
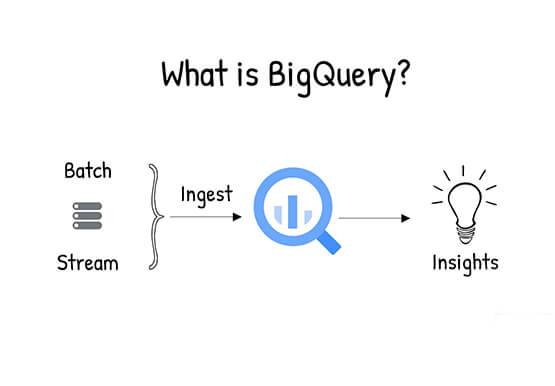
What is BigQuery?
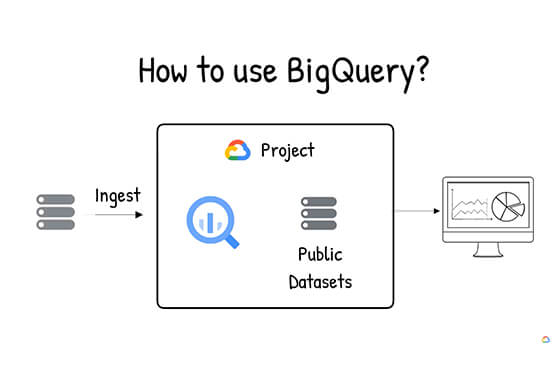
BigQuery is Google Cloud's enterprise data warehouse designed to help you ingest, store, analyze, and visualize big data with ease. Organizations rely on data warehouses to aggregate data from disparate sources, process it, and make it readily available for data analysis that supports their strategic decision-making. You can ingest data

Tools to Simplify Streaming Analytics
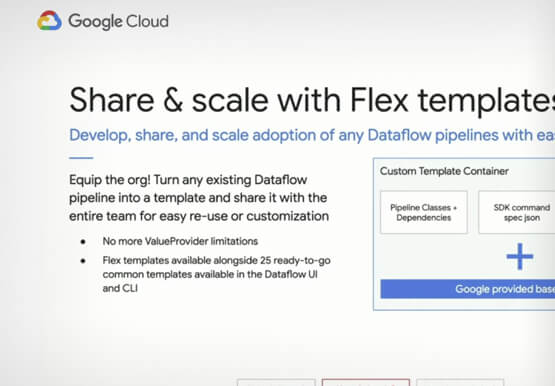
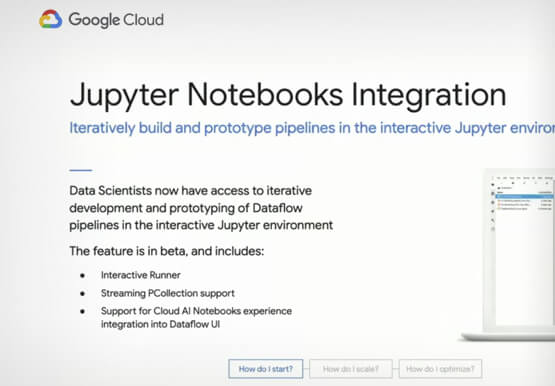
Streaming analytics is transforming how companies interact with their customers and operate with agility. Dataflow supports a number of features to guide you through your journey to adopt streaming, including notebooks for writing your first pipeline, SQL to accelerate your streaming deployments, Flex Templates to scale streaming in your organization,
