





Learn to Access Process Metrics for Full-visibility into Software and Infrastructure behind Your Apps

3397
Of your peers have already read this article.
2:00 Minutes
The most insightful time you'll spend today!
When you are experiencing an issue with your application or service, having deep visibility into both the infrastructure and the software powering your apps and services is critical. Most monitoring services provide insights at the Virtual Machine (VM) level, but few go further. To get a full picture of the state of your application or service, you need to know what processes are running on your infrastructure. That visibility into the processes running on your VMs is provided out of the box by the new Ops Agent and made available by default in Cloud Monitoring. Today we will cover how to access process metrics and why you should start monitoring them.
Better visibility with process metrics
The data gathered by process metrics include CPU, memory, I/O, number of threads, and more, for any running processes and services on your VMs. When the Ops Agent or the Cloud Monitoring agent is installed, these metrics are captured at 60-second intervals and sent to Cloud Monitoring so you can visualize, analyze, track, and alert on them. A single VM may run tens or hundreds of processes, while you may have tens of thousands running across your fleet of VMs.
As a developer, you may only care about seeing inside a single VM to troubleshoot and identify memory leaks or the source of performance issues.
As an operator or IT Admin, you may be interested in aggregate resource consumption, building baseline views of compute, storage, and networking usage across your VM fleet. Then, when those baseline consumption levels break normal behaviors, you will know when to investigate your systems.
Built for scale and ease of use
Cloud Monitoring is built on the same advanced backend that powers metrics across Google. This proven scalability means your metrics ingestion will be supported despite the extremely high cardinality. Additionally, our agents do not require any config file changes to turn on process metric monitoring.
Lastly, our goal is to provide you the observability and telemetry data where, and when, you need it. So, like the rest of the operations suite, we deliver process metrics in the context of your infrastructure, directly in the VM admin console.
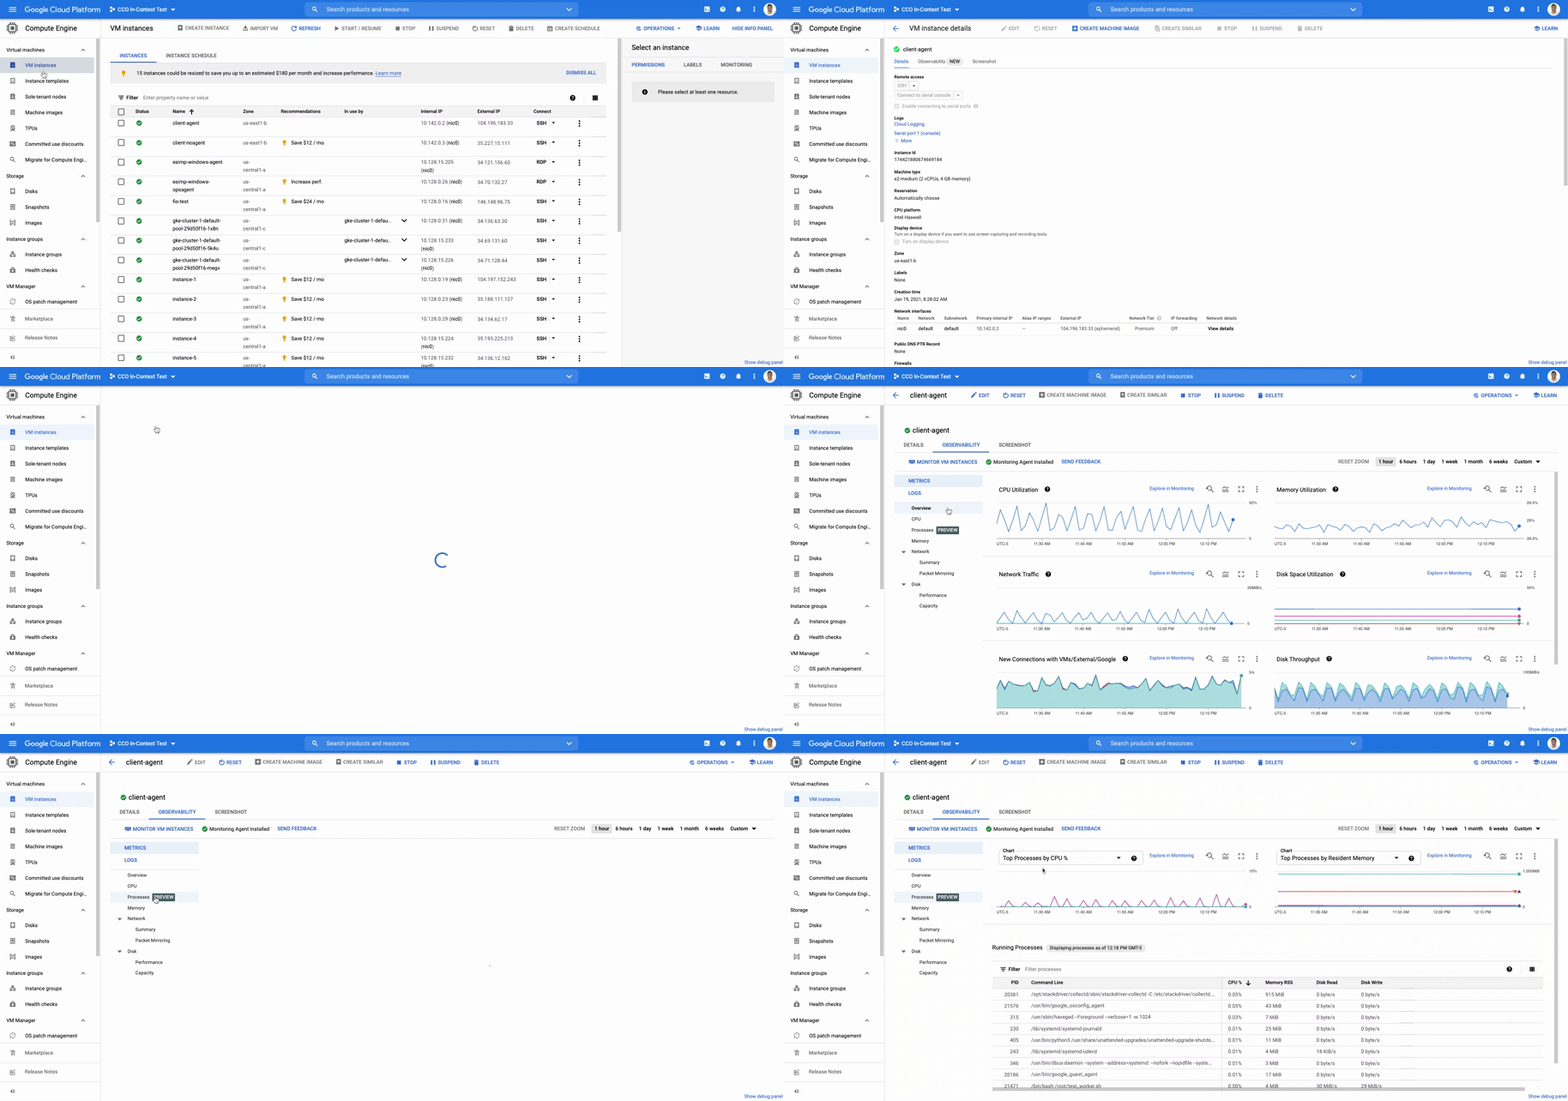
The navigation is simple. Once you have the Ops Agent or the Cloud Monitoring agent installed in your VMs:
- Go to the Compute Engine console page and click on VM Instances
- Select the VM that you want to investigate
- In the navigation menu on the top, click Observability
- Click on Metrics
- Lastly, click on Processes
In the window on the right you will see a chart and a table with all of the processes in your VM. You can also filter by time frame and sort by name or value. You do not need to do anything, other than have the agent installed, for the process to be detected and displayed.
Fleet-wide metrics monitoring
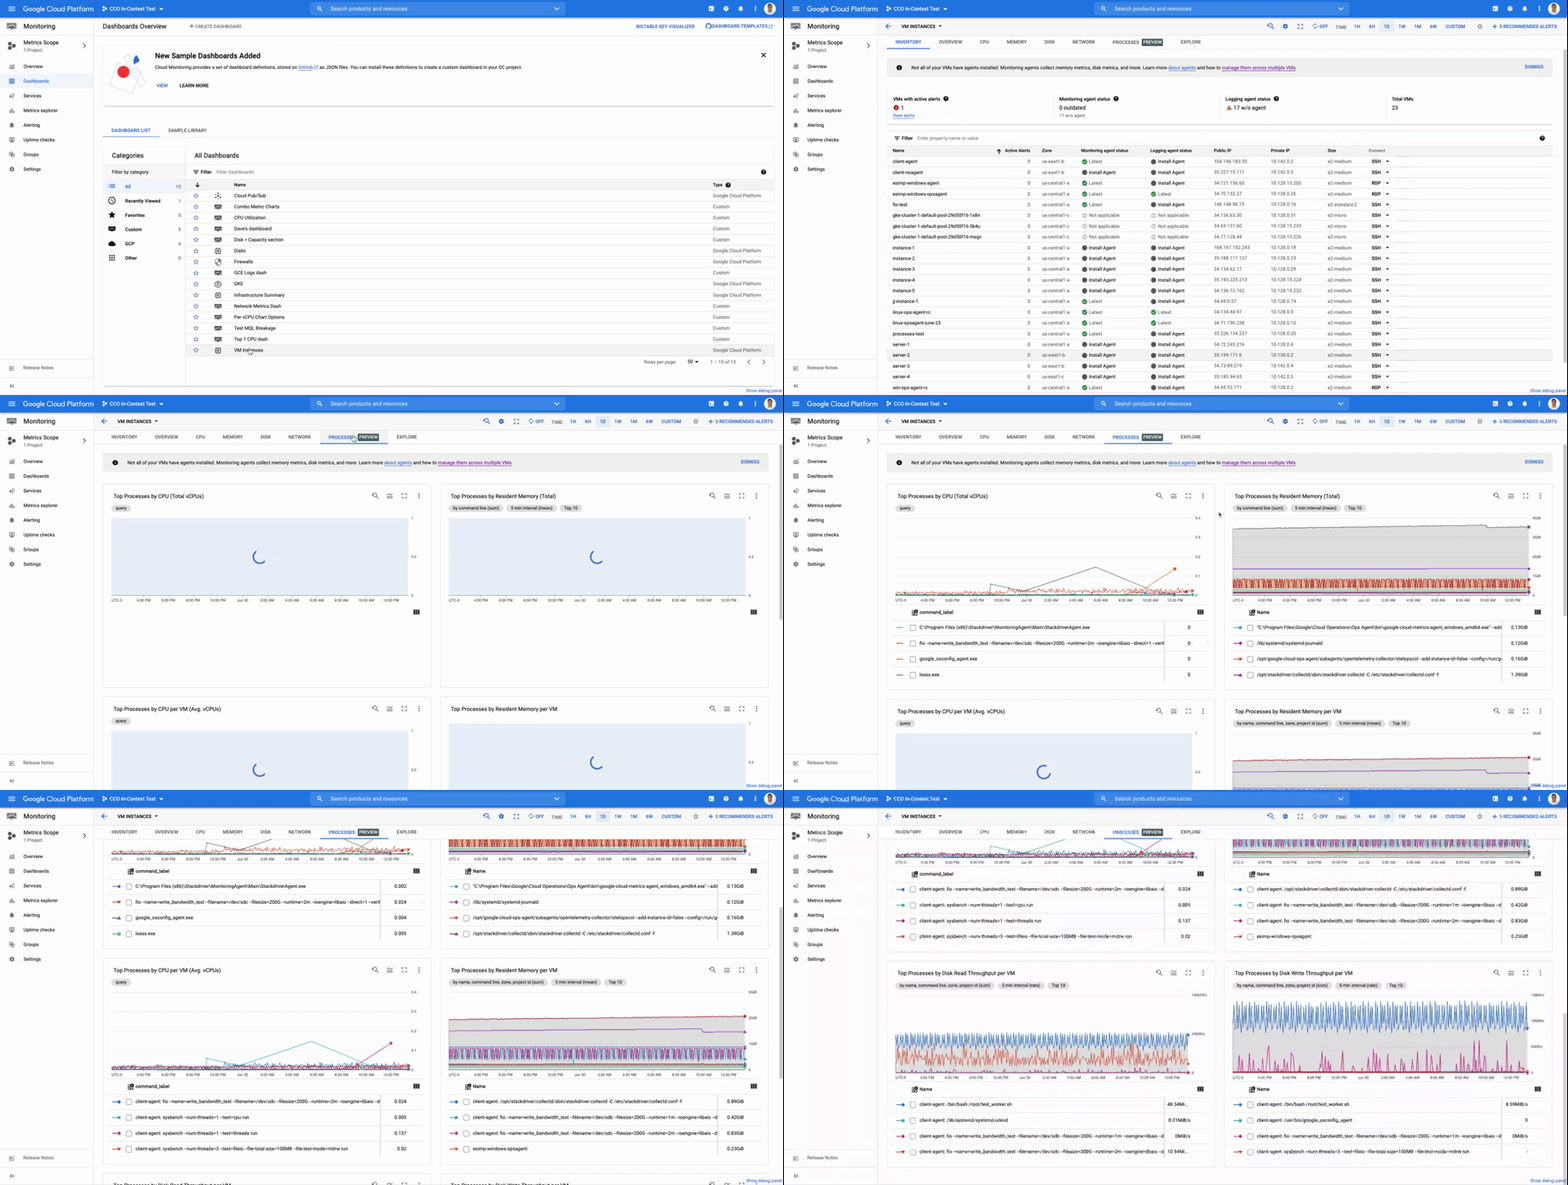
Cloud Monitoring gives you a look across your fleet of VMs so you can identify the aggregated usage of resources by processes. This level of broad, yet granular, insight can drive your decisions around which software to run or how many VMs you need to optimally power your apps and services. Admins can perform a cost-savings analysis if they determine that certain processes are slowing down the work of a large number of VMs. The larger numbers of less powerful VMs can be replaced by fewer, more capable VMs.
To get this fleet-wide view:
- Navigate to Cloud Monitoring
- Click Dashboards in the left menu
- In the All Dashboards list, click on VM Instances
- Towards the top of the window, click on Processes
This provides many charts detailing the processes running across your fleet of VMs.
Get started today
To start identifying and monitoring your process metrics, you must first install the Ops Agent, or have installed the legacy Cloud Monitoring agent. Once that is complete, the process metrics data will automatically be ingested into Cloud Monitoring and the VM admin console.
If you have any questions, or to join the conversation with other developers, operators, DevOps, and SREs, visit the Cloud Operations page in the Google Cloud Community.
BigQuery’s User-friendly SQL is Like a Cool Drink for Hot Summer

5683
Of your peers have already read this article.
2:30 Minutes
The most insightful time you'll spend today!
With summer just around the corner, things are really heating up. But you’re in luck because this month BigQuery is supplying a cooler full of ice cold refreshments with this release of user-friendly SQL capabilities.
We are pleased to announce three categories of BigQuery user-friendly SQL launches: Powerful Analytics Features, Flexible Schema Handling, and New Geospatial Tools.
Powerful Analytics Features
These powerful SQL analytics features provide greater flexibility to analysts for organizing, filtering, and rendering data in BigQuery than ever before. You can enable spreadsheet-like functionality on summarized data using PIVOT and UNPIVOT and filter irrelevant data in analytic functions using QUALIFY.
Through this section, we will become familiar with these new features through examples using the BigQuery Public dataset, usa_names.
PIVOT/UNPIVOT (Preview)
One of the most time-consuming tasks for data analytics practitioners is wrangling data into the right shape. SQL is great for wrangling data, but sometimes you want to reformat a table as you would in a spreadsheet, pivoting rows and columns interchangeably. To support this use case, we are pleased to introduce PIVOT and UNPIVOT operators in BigQuery. PIVOT creates columns from unique values in rows by aggregating values, and UNPIVOT reverses this action.The example below uses PIVOT on bigquery-public-data.usa_names.usa_1910_current to show the number of males and females born each year, representing each gender as a column. Then UNPIVOT reverses this action.
Language: SQL
-- we start with SQL to create a simple table-- we only include gender, year, and number.CREATE TABLEmydataset.sampletable1 AS (SELECTGender,Year,SUM(Number) AS NumberFROM`bigquery-public-data.usa_names.usa_1910_current`WHEREYear >= 2017GROUP BYGender, Year);-- The resulting table:--+----------------------------------------+--| Gender | Year | Number |--+----------------------------------------+--| F | 2019 | 1353716 |--| F | 2017 | 1403989 |--| F | 2018 | 1380382 |--| M | 2018 | 1568678 |--| M | 2019 | 1538056 |--| M | 2017 | 1604609 |--+----------------------------------------+-- use PIVOT to create columns for “female” and “male”CREATE TABLEmydataset.Pivoted ASSELECTyear, male, femaleFROMmydataset.sampletable1PIVOT( SUM(Number) FOR gender IN ('M' AS male,'F' AS female))ORDER BYyear;-- The resulting pivoted table:--+----------------------------------------+--| Year | female | male |--+----------------------------------------+--| 2017 | 1403989 | 1604609 |--| 2018 | 1380382 | 1568678 |--| 2019 | 1353716 | 1538056 |--+----------------------------------------+-- UNPIVOT reverses the row/column rotation of PIVOT.SELECT*FROMmydataset.PivotedUNPIVOT(number FOR gender IN (male AS 'M',female AS 'F'));
QUALIFY (Preview)
More advanced users of SQL know the power of analytic functions (aka window functions). These functions compute values over a group of rows, returning a single result for each row. For example, customers use analytic functions to compute a grand total, subtotal, moving average, rank, and more. With the announcement of support for QUALIFY, BigQuery users can now filter on the results of analytic functions by using the QUALIFY clause.
QUALIFY belongs in the family of query clauses used for filtering along with WHERE and HAVING. The WHERE clause is used to filter individual rows in a query. The HAVING clause is used to filter aggregate rows in a result set after aggregate functions and GROUP BY clauses. The QUALIFY clause is used to filter results of analytic functions.
To show the utility of QUALIFY, the example below uses QUALIFY to return the top 3 female names from each year in the last decade using from bigquery-public-data.usa_names.usa_1910_current.
Language: SQL
-- QUALIFY filters the result of the RANK functionSELECTname,year,SUM(number) AS total,RANK() OVER (PARTITION BY yearORDER BY SUM(number) DESC) AS rankFROM`bigquery-public-data.usa_names.usa_1910_current`WHEREgender = 'F'AND YEAR >= 2010GROUP BY 1,2QUALIFY RANK <= 3ORDER BY 2,4;
Flexible Schema Handling
New SQL for administrators and data engineers enables table renaming for data pipeline processes, as well as flexible column management.
Table Rename (GA)
In data pipeline processes, tables are often created and then renamed so that they can make way for the next iteration of the pipeline run. To accomplish this, customers need a mechanism by which they can create a table and then subsequently rename it. Now if customers want to change this name using SQL, they can. Using the simple syntax that ALTER TABLE RENAME TO provides, customers will be able to rename a table after creation to clear the way for the next iteration of tables in the data pipeline.
Language: SQL
-- create a sample table “tablename” in “mydataset”.-- You will rename this table.CREATE OR REPLACE TABLE dataset.tablename(col1 STRING,col2 NUMERIC);-- if this table “tablename” becomes obsolete-- perform Table Rename to “obsoletetable”ALTER TABLEmydataset.name RENAME TO obsoletetable;
DROP NOT NULL constraints on a column (GA)
While BigQuery has historically provided many tools available in the UI, CLI and APIs, we know that many administrators prefer interfacing with the database using SQL. BigQuery recently released DDL statements which enable data administrators to provision and manage datasets and tables, greatly simplifying provisioning and management. Today, we continue the next addition in this line of releases by announcing ALTER COLUMN DROP NOT NULL constraint on a column:
- ALTER COLUMN DROP NOT NULL allows the administrator to remove the NOT NULL constraint from a column in BigQuery.
Language: SQL
-- create a table to store credit card numbers-- the business requires this field, so-- include a NOT NULL constraintCREATE TABLEmydataset.customers(credit_card_number STRING NOT NULL);-- if needs of the business no longer require this field,-- the customer can allow null entries in this column-- by dropping the constraintALTER TABLEmydataset.customersALTER COLUMN credit_card_number DROP NOT NULL;
CREATE VIEW with column list (GA)
Views are used ubiquitously by BigQuery customers to capture business logic. Oftentimes, BigQuery users have business requirements to assign aliases to columns in views. Now BigQuery supports doing so upon view creation in a column name list format with the release of CREATE VIEW with column list syntax.
Language: SQL
-- aliases list1 and list2 can be assigned in a list formatCREATE VIEWmyview (list1, list2) ASSELECTcolumn_1, column_2FROMmydataset.exampletable
New Geospatial Tools
ST_POINTN, ST_STARTPOINT, and ST_ENDPOINT
Geospatial data is incredibly valuable to data analytics customers dealing with data from the physical world. BigQuery has very strong geospatial function support to help customers process marketing data, track storms, or manage self-driving cars. Particularly for analyzing vehicle or location tracking data, we’re thrilled to provide three new functions to allow users to easily extract or filter on key points:
For example, when working with vehicle histories, ST_POINTN, ST_STARTPOINT, and ST_ENDPOINT allow users to extract elements such as the start and the end of a trip. For identifying origin-destination pairs these functions will make that task much easier.
Language: SQL
-- pull the first, second, penultimate and final points-- from a linestringWITH linestring as (SELECT ST_GeogFromText('linestring(1 1, 2 1, 3 2, 3 3)') g)SELECTST_StartPoint(g) AS first, ST_EndPoint(g) AS last,ST_PointN(g,2) AS second, ST_PointN(g, -2) as second_to_lastFROMlinestring+--------------+--------------+--------------+----------------+| first | last | second | second_to_last |+--------------+--------------+--------------+----------------+| POINT(1 1) | POINT(3 3) | POINT(2 1) | POINT(3 2) |+--------------+--------------+--------------+----------------+
As sure as a hot summer day pairs well with an ice-cold beverage, these new user-friendly SQL features in BigQuery pair well with your data analytics workflows. To learn more about BigQuery, visit our website, and get started immediately with the free BigQuery Sandbox.
Israeli Government Chooses Google Cloud to Power its Cloud-based ‘Project Nimbus’

3293
Of your peers have already read this article.
1:30 Minutes
The most insightful time you'll spend today!
Google Cloud today announced that it has been selected by the Israeli government to provide public cloud services to help address the country’s challenges within the public sector, including in healthcare, transportation, and education.
Following a thorough public tender process, Google Cloud was selected for this four-phase project known as “Project Nimbus.” The agreement will deliver cloud services to all government entities from across the state, including ministries, authorities, and government-owned companies. The agreement is also available for higher education, health maintenance organizations and municipalities. The project will run for an initial period of 7 years, and the Israeli government may extend the engagement for up to 23 years in total.
As part of the agreement, Google Cloud will work with the public sector on the formulation of best practices for cloud migration, integration and migration to the cloud, and optimisation of cloud services. Google Cloud will also provide training to the country’s technical government employees and senior leaders to enhance digital skills. Google Cloud announced last month that it will open a Google Cloud region in Israel to make it easier for customers to serve their own users faster, more reliably and securely. The region in Israel will be available to serve not only the government and related entities but also private commercial companies, just like any other Google Cloud region.
The Accountant General of Israel, Mr. Yali Rothenberg, congratulates Google on their winning bid in the first tender of “Project Nimbus”, a multi-year flagship project led by the Israeli Government Procurement Administration, that is intended to provide a comprehensive framework for the provision of cloud services to the Government of Israel.
We are delighted to have been chosen to help digitally transform Israel. This builds on the continued success we are seeing with the public sector globally.
Google Cloud region in Israel
In April, we announced that a new Google Cloud region is coming to Israel to make it easier for customers to serve their own users faster, more reliably and securely. Our global network of Google Cloud regions are the foundation of the cloud infrastructure we’re building to support our customers in the Middle East and around the world. With cloud’s 25 regions (and forthcoming Middle East regions in Qatar and Saudi Arabia) and 76 zones around the world, we deliver high-performance, low-latency services and products for Google Cloud’s enterprise and public sector customers.
7482
Of your peers have already watched this video.
1:15 Minutes
The most insightful time you'll spend today!
An Indian Example of How to Really Up Your Customer Experience Game and Increase Conversion Rates With AI
How about selfie analysis of users to recommend them the right lipstick color?
That’s just one of the many ideas folks at Purplle.com came up with to improve the buying experience of Indian consumers.
And without the power of Google Cloud, it would probably have remained just that…an idea.
But today, thanks to Google Cloud, “Nothing seems impossible,” says Suyash Katyayani, CTO, Purplle.
Purplle.com is an online e-commerce company in India and one of the pioneers in creating a digitally-native beauty brands in India.
“The beauty industry is so data intensive that we needed to have a strong data strategy and we were looking out for solutions which would enable us to have a strong data pipeline and a strong data warehousing solution,” says Katyayani.
That’s when it turned to Google Cloud.
Additionally, Purplle.com, says Katyayani, does not have to worry about at what scale the company operates at because they have access to state-of-the-art infrastructure from Google Cloud available to them so that their developers can run experiments.
“The biggest plus point for us has been the agility that Google Cloud has added,” says Katyayani.
New Histogram Features in Cloud Logging Make it Easier to Track Log Volumes, Errors and Anomalies!

3407
Of your peers have already read this article.
2:30 Minutes
The most insightful time you'll spend today!
Visualizing trends in your logs is critical when troubleshooting an issue with your application. Using the histogram in Logs Explorer, you can quickly visualize log volumes over time to help spot anomalies, detect when errors started and see a breakdown of log volumes. But static visualizations are not as helpful as having more options for customization during your investigations.
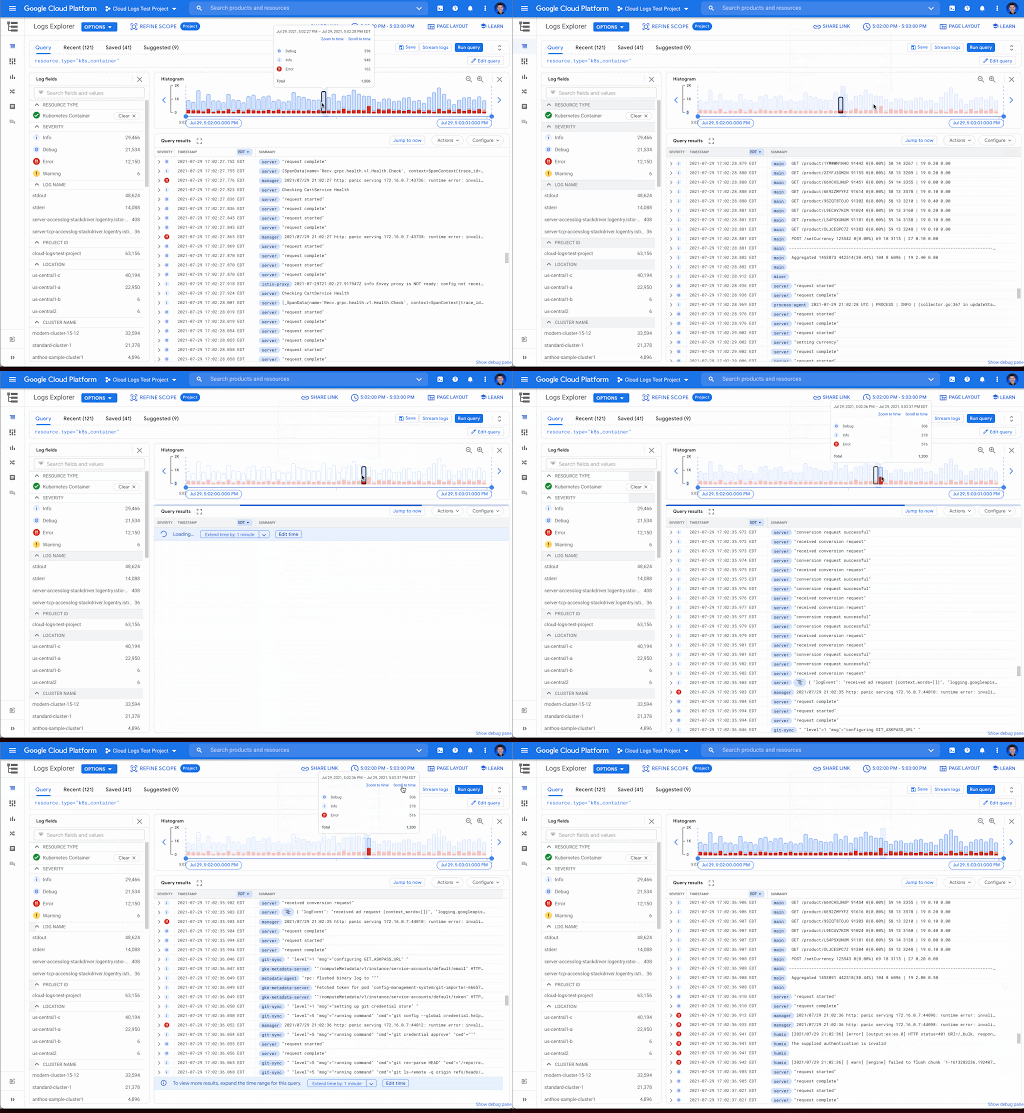
That’s why we’re excited to announce that we recently added three new query controls along with separate colors for log severity to the histogram. These new features make it even easier to refine and analyze your logs by time range. The new histogram controls help find logs before or after the current period, jump to a specific time range represented in a histogram bar and zoom in/out of the current time window in the histogram.
Histogram colors
The histogram now makes it easier to view the breakdown of logs by severity with the introduction of color coding. For example, the severity colors make it easy to spot an increasing number of errors even when the volume of requests is relatively constant. Looking at the histogram below, the red vs blue shading makes it clear that there has been an increase in overall log volume and provides a visual breakdown of errors within that log volume.

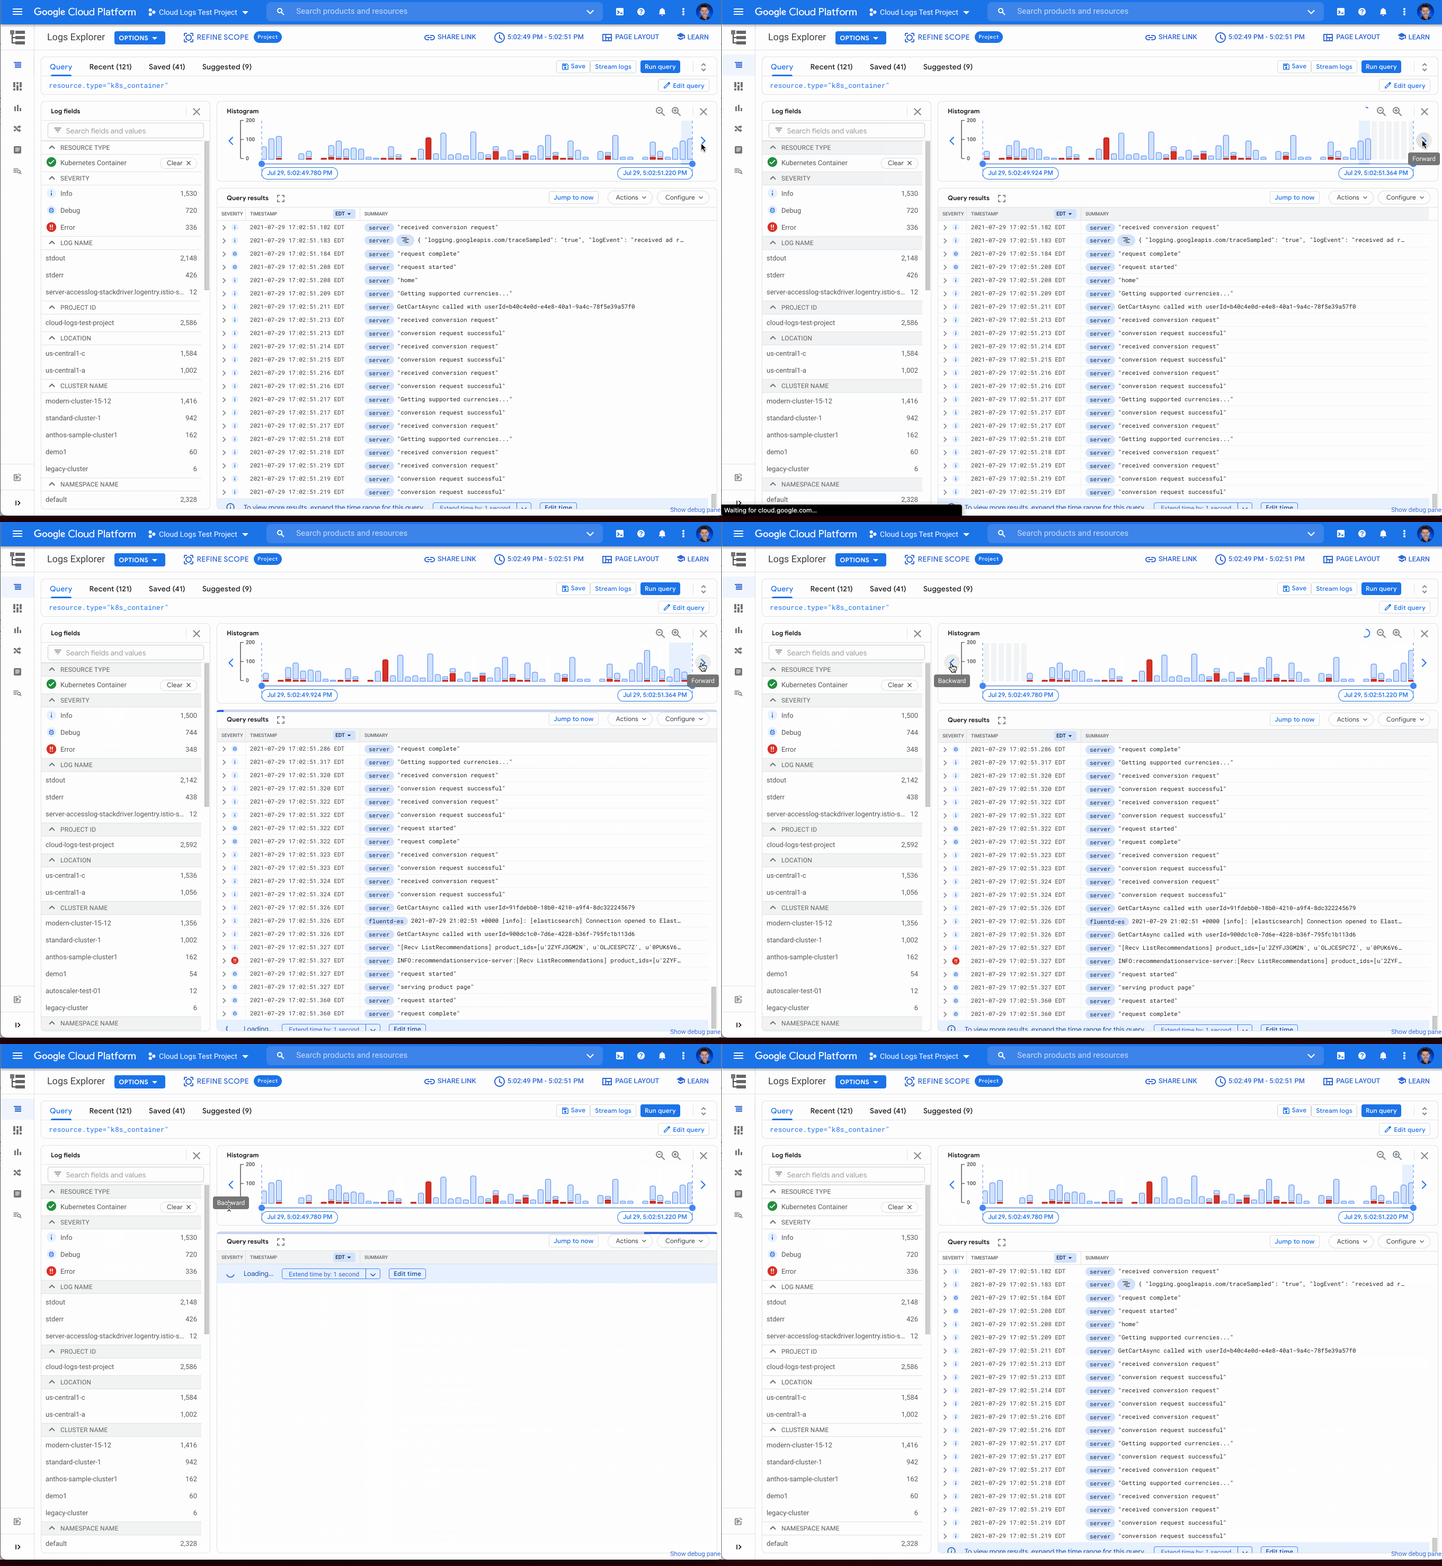
Pan left/right to scroll through time
Sometimes in your troubleshooting journey, you may want to look at the logs directly before or after the current set of logs. Perhaps there was an unexpected spike in errors at the beginning of the time range and you need to see the logs in the time period directly preceding the current time range. Pressing the left arrow on the left side of the histogram shifts the time range earlier while the arrow on the right side of the histogram shifts the time range ahead. Either arrow will refine the time range in the query and rerun the query to return the logs in the new time range.
Zooming in or out
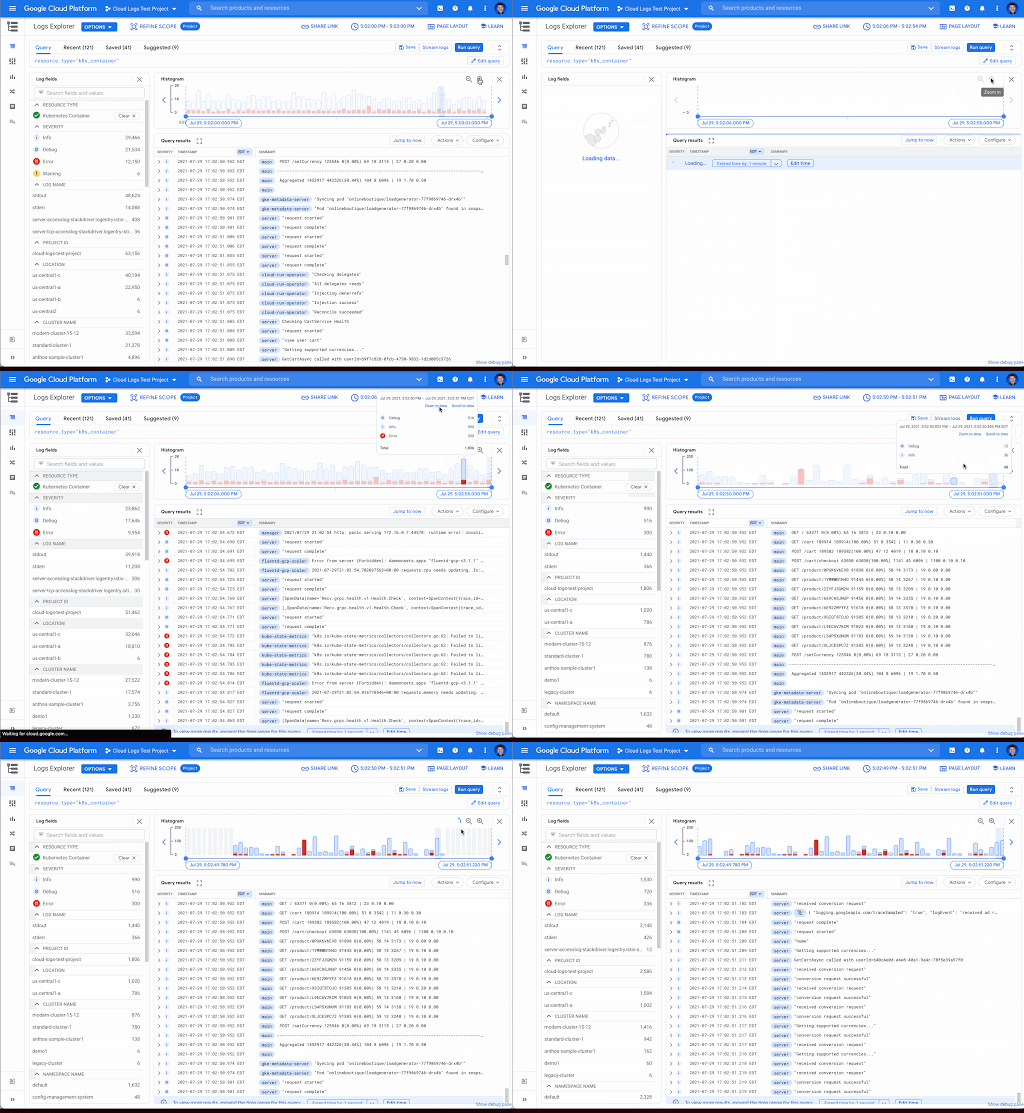
Zooming in or out from a given time range may be useful to visualize fine-grained details or a broader trend Clicking the zoom in or out icons in the upper right corner of the histogram refines the time range in the query and then reruns the query, returning the logs in the newly defined time range.
Scrolling to time
If you see a large spike in logs volume in the histogram, it’s useful to quickly review the logs generated during that spike. Clicking on the histogram bar that contains the spike now scrolls you to the logs generated during that time period.
Where to find the histogram
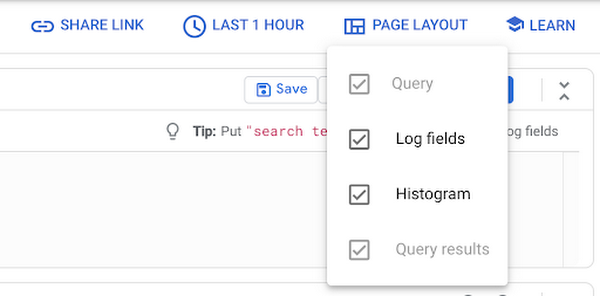
The histogram is a panel in Logs Explorer that can be displayed or hidden using the controls in the Page Layout menu. When you no longer want to display the histogram, click the “X” button in the upper right corner to quickly close it. To open it again, use the same Page Layout menu to enable the histogram display.
Get started with the histogram
These improvements move the histogram from a utility for visualization to an integral part of the troubleshooting journey. We are continuously working to launch new features that make Cloud Logging the best place to troubleshoot your Google Cloud logs. If you are not already a Cloud Logging user, review this getting started documentation or watch a quick video on troubleshooting services on Google Kubernetes Engine (GKE) to learn more. If you have specific questions or feedback, please join the discussion on our Google Cloud Community, Cloud Operations page.
What Our Google Cloud Experts Say About Multi-cloud Journey

3445
Of your peers have already read this article.
1:30 Minutes
The most insightful time you'll spend today!
Do you want to fire up a bunch of techies? Talk about multicloud! There is no shortage of opinions. I figured we should tackle this hot topic head-on, so I recently talked to four smart folks—Corey Quinn of Duckbill Group, Armon Dadgar of Hashicorp, Tammy Bryant Butow of Gremlin, and James Watters of VMware—about what multicloud is all about, key considerations, and why you should (or shouldn’t!) do it.
Five important insights came out of these discussions. If you’re on a multicloud journey or considering one, keep reading.
Do: Choose to do multicloud for the right reasons
Don’t do multicloud because Gartner says so, implores Corey Quinn. Before embarking on a multicloud, define a “why” focused on business value journey, says Armon Dadger. For example, you might want to use services from each public cloud because of their differentiated services, according to Tammy Bryant Butow. Armon also calls out regulatory reasons, existing business relationships, and accommodating mergers and acquisitions. On the topic of M&A, Corey points out that if you acquire a company that uses another cloud, it’s usually expensive and difficult to consolidate. It can be smarter to stay put.
Don’t: Over-engineer for workload or data portability
Thinking that you’ll build a system that moves seamlessly among the various cloud providers? Hold up, says our group of experts. Armon points out that aspects of your toolchain or architecture may be multicloud—think of some of your workflows or global network routing—but that shifting workloads or data is far from simple. Corey says that trying to engineer for “write once, run anywhere” can slow you down, and ignores the inherent uniqueness that’s part of each platform. Specifically, Corey calls out the per-cloud stickiness of identity management, security features, and even network functionality. And data gravity is still a thing, says James, that causes some to dismiss multicloud outright.
If you’re using multiple public clouds, you take advantage of the distinct value each offers, Armon says. Use native cloud services where possible so that you see the benefits from useful innovations, built-in resilience, and baked-in best practices. The value from that cloud-infused workload may outweigh the benefits of seamless portability.
Do: Recognize different stakeholder interests and needs
James smartly points out that many multicloud debates happen because people are arguing from different perspectives. Context matters. If you’re an infrastructure engineer who invests heavily in a given cloud’s identity and access management model, multicloud looks tricky. Or if you’re a data engineer with petabytes of data homed in a particular cloud, multicloud may look unrealistic. James highlights that many developers default to multicloud because their local tools—where all the work happens—are multicloud. A developer’s IDE and preferred code framework(s) aren’t tied to any given cloud. Be aware that groups within your organization will come at multicloud from distinct directions. And this may impact your approach!
Don’t: Go it alone
Corey talks about the importance of asking others what worked, and what didn’t. Tammy offers her best practices around sharing results from experiments. It’s about sharing knowledge and tapping into it for community benefit. Others have probably tried what you’re trying, and can help you avoid common pitfalls. If you’ve just made an architectural choice that didn’t work out, share it, and help others avoid the pain.
Read research from analysts, go to conferences or watch videos to observe case studies, and join online communities that offer a safe place to share mistakes and learn from others.
Do: Experiment first using techniques like multi-region deployments
If you think you can operate systems across clouds, how about you first try doing it across regions in a specific cloud, suggests Corey. Getting a system to properly work across cloud regions isn’t trivial, he says, and that experience can help you uncover where you have architectural or operational constraints that will be even worse across cloud providers.
This is great guidance if your multicloud aspirations involve using multiple clouds to power one application—versus the more standard definition of multicloud where you use different clouds for different applications—but can also surface issues in your support process or toolchain that fail when faced with distributed systems. Start with muti-region deployments and chaos engineering experiments before aggressively jumping into multicloud architectures.
The Google Cloud take
Do the things above. It’s great advice. I’ll add three more things that we’ve learned from our customers.
- Don’t fear multicloud. You’re already doing it. You don’t single-source everything. As Corey mentioned, you probably already have one cloud for productivity tools, another for source code, another for cloud infrastructure. You’ll use software and application services from a mix of providers for a single app. You have that experience in your team and have been doing that for decades. What people do rightly worry about is using more than one infrastructure service beneath an application, as that can introduce latency, security, and logistical hurdles. Make sure you know which model your team is considering.
- Embrace the right foundational components, including Kubernetes. Will everything run on Kubernetes? Of course not. Don’t try to do that. But it also represents the closest thing we have to a multicloud API. Companies are using Kubernetes to stripe a consistent experience across clouds. And this isn’t just to orchestrate containers, but also to manage infrastructure and cloud-native services. Also, consider where you need other fundamental consistency across clouds, including areas like provisioning and identity federation.
- Use Google Cloud as your anchor. Here’s a fundamental question you have to decide for yourself: Are you going to bring your on-premises technology and practices to the cloud, or bring cloud technology and practices on-prem? We sincerely believe in the latter. Anchor to where you’re trying to get to. We offer Anthos as a way to build and run distributed Kubernetes fleets in Google Cloud and across clouds. By using a cloud-based backplane instead of an on-prem one, you’re offloading toil, leveraging managed services for scale and security, and introducing modern practices to the rest of your team.
We learned a lot about multicloud through these discussions, and it seems like others did too. That’s why we’re going to do a second round of interviews with a new crop of experts so that we can keep digging deeper into this topic. Stay tuned!
More Relevant Stories for Your Company

How Companies can Improve Scalability, Flexibility, and Reliability While Reducing Costs: Tips from Route4Me
Google Cloud Results Improves application performance by 8x to 12x; customers can create increasingly complex optimized driving routes in single-digit secondsImproves customer satisfaction via increased reliability and greater application performanceFocuses on adding value to customers by improving software and algorithms, not infrastructure managementSaves 5x in infrastructure costs In 2009, Dan

How Vertex Vizier’s Automated Hyperparameter Tuning Improves ML Models
We recently launched Vertex AI to help you move machine learning (ML) from experimentation into production faster and manage your models with confidence—speeding up your ability to improve outcomes at your organization. But we know many of you are just getting started with ML and there’s a lot to learn! In tandem

Cloud Bigtable Helps Fraud-detection Company Meet Scalability Demands and Secure Customer Data
Editor’s note: Today we are hearing from Jono MacDougall , Principal Software Engineer at Ravelin. Ravelin delivers market-leading online fraud detection and payment acceptance solutions for online retailers. To help us meet the scaling, throughput, and latency demands of our growing roster of large-scale clients, we migrated to Google Cloud and its

Say Hola to New Google Cloud Region in Madrid
We’re continuing to expand our global footprint — and we’re doing it rapidly. In 2020, we announced our plans to launch a new cloud region to help accelerate the economic recovery and growth of Spain. Today, we’re excited to announce that our new Google Cloud region in Madrid is officially
