





Learn About Kf: How it Helps Move Existing Cloud Foundry Workloads to Kubernetes

3433
Of your peers have already read this article.
1:30 Minutes
The most insightful time you'll spend today!
While many companies are writing brand-new Kubernetes-based applications, it’s still quite common to find companies who want to migrate existing workloads. A common source platform for these applications is Cloud Foundry. However, getting an existing Cloud Foundry application running on Kubernetes can be non-trivial, especially if you want to avoid making code changes in your applications, or taking on big process changes across teams. That is, if you’re not using Kf to do a lot of that heavy lifting for you.
Kf is a Google Cloud service that allows you to easily move existing Cloud Foundry workloads to Kubernetes with minimal disruption to your existing processes.
Kf features a command line interface (CLI) also named kf, that replaces the existing Cloud Foundry cf command line utility. The kf CLI implements the most commonly used cf functionality, including the ability to manage bindings, services, apps, routes and more.
For example, to deploy an existing application you would simply issue the kf push command.
On the server side Kf is built on several open source technologies. In some cases these technologies are also the Google Cloud implementation. For instance GKE is our managed Kubernetes offering, and provides the platform for managing and running the applications. Routing and ingress is handled by Anthos Service Mesh, Google Cloud’s managed Istio-based service mesh. Finally, Tekton provides on-cluster build functionality for Kf. Developers don’t have to worry about any of those technologies, as Kf abstracts them away.
Kf primitives such as spaces, bindings and services are implemented as custom Kubernetes resources and controllers. The custom resources effectively serve as the Kf API and are used by the kf CLI to interact with the system. The controllers use Kf’s CRDs to orchestrate the other components in the system.
The beauty of this approach is that developers who are familiar with existing workflows can largely replicate those workflows with the kf CLI. On the other hand, platform operators who are more familiar with Kubernetes can use kubectl to interact with the CRDs and controllers.
For instance if you wanted to list the apps running on your Kf cluster you could issue either of the following commands:
kf appskubectl get apps -n space-name
Notice that CF / Kf spaces get mapped one to one to Kubernetes namespaces.
To get a list of all the custom resources you can examine the api-resources in the kf.dev API group.
kubectl api-resources --api-group=kf.devNAME SHORTNAMES APIGROUP NAMESPACED KINDapps kf.dev true Appbuilds kf.dev true Buildclusterservicebrokers kf.dev false ClusterServiceBrokerroutes kf.dev true Routeservicebrokers kf.dev true ServiceBrokerserviceinstancebindings kf.dev true ServiceInstanceBindingserviceinstances kf.dev true ServiceInstancespaces kf.dev false Space
With Kf developers can continue to work with a familiar interface and platform operators can use declarative Kubernetes practices and tooling such as Anthos Config Management to manage the cluster. It’s really the best of both worlds if you’re looking to manage your existing Cloud Foundry applications on Kubernetes.
If you’d like to learn more about Kf check out the video I just released on YouTube. It reviews some of the concepts discussed here, and includes a short demo. If you’d like to get hands on, try the quick start. And, of course, you can always read the documentation.

Customer Voices: How Firms from Across Industries Leverage Google Cloud
DOWNLOAD CASE STUDY14135
Of your peers have already downloaded this article
1:30 Minutes
The most insightful time you'll spend today!
From powering everyday operations and accelerating application innovation, to providing tools for specific business needs and executing on big ideas, to advancing the security of technology solutions, companies from across industries have leveraged Google Cloud for business benefits.
Companies from across industries have turned to Google Cloud for transforming their business, modernizing their infrastructure, and gleaning intelligence from data. For instance:
- Johnson & Johnson achieved a 41% increase in search results from high-quality job applicants, significantly improving the company’s ability to quickly hire top talent.
- Sony Network Communications now processes 10 billion monthly queries faster, which advances data analysis.
- University College Dublin saw significant 6-figure savings by eliminating legacy hardware, software, and maintenance.
And there are many such examples. Read the collection of case studies to find out how companies from across industries and geographies leveraged Google Cloud for measurable business benefits and for solving complex problems.
Pacemaker’s Automated Alerts and Alert Reporting: No More Outages for SAP Systems on Google Cloud!

3266
Of your peers have already read this article.
6:00 Minutes
The most insightful time you'll spend today!
When critical services fail, businesses risk losing revenue, productivity, and trust. That’s why Google Cloud customers running SAP applications choose to deploy high availability (HA) systems on Google Cloud.
In these deployments Linux operating system clustering provides application and guest awareness for the application state and automates recovery actions in case of failure — including cluster node, resource or node failover or failed action.
Pacemaker is the most popular software Linux administrators use to manage their HA clusters, which includes automating notifications about events — including failover fencing and node, attribute, and resource events — and reporting on events. With automated alerts and reports, Linux administrators can not only learn about events as they happen, but they can also make sure other stakeholders are alerted to take action when critical events occur. They can even discover past events to assess the overall health of their HA systems.
Here, we break down the steps to setting up automated alerts for HA cluster events and alert reporting.
How to Deploy the Alert Script
To set up event-based alerts, you’ll need to take the following steps to execute the script.
1. Download the script file ‘gcp_crm_alert.sh’ from
https://github.com/GoogleCloudPlatform/pacemaker-alerts-cloud-logging
2. Under root user, add exec flag for the script and execute deployment with:
chmod +x ./gcp_crm_alert.sh./gcp_crm_alert.sh -d
3. Confirm that the deployment runs successfully. If it does, you will see the following INFO log messages:
In the Red Hat Enterprise Linux (RHEL) system:
gcp_crm_alert.sh:2022-01-24T23:48:30+0000:INFO:'pcs alert recipient add gcp_cluster_alert value=gcp_cluster_alerts id=gcp_cluster_alert_recepient options value=/var/log/crm_alerts_log' rc=0
In the SUSE Linux Enterprise Server (SLES):
gcp_crm_alert.sh:2022-01-25T00:13:27+00:00:INFO:'crm configure alert gcp_cluster_alert /usr/share/pacemaker/alerts/gcp_crm_alert.sh meta timeout=10s timestamp-format=%Y-%m-%dT%H:%M:%S.%06NZ to { /var/log/crm_alerts_log attributes gcloud_timeout=5 gcloud_cmd=/usr/bin/gcloud }' rc=0Now, in the event of a cluster node, resource, node failover, or failed action, Pacemaker will start the alert mechanism. For further details on the alerting agent, check out the Pacemaker Explained documentation.
How to Use Cloud Logging for Alert Reporting
Alerted events are published in Cloud Logging. Below is an example of the log record payload, where the cluster alert key-value pairs get recorded in the jsonPayload node.
{
"insertId": "ktildwg1o3fbim", "jsonPayload": { "CRM_alert_recipient": "/var/log/crm_alerts_log", "CRM_alert_attribute_name": "", "CRM_alert_kind": "resource", "CRM_alert_status": "0", "CRM_alert_rsc": "STONITH-sapecc-scs", "CRM_alert_rc": "0", "CRM_alert_timestamp_usec": "", "CRM_alert_interval": "0", "CRM_alert_node_sequence": "21", "CRM_alert_task": "start", "CRM_alert_nodeid": "", "CRM_alert_timestamp": "2022-01-25T00:17:06.515313Z", "CRM_alert_timestamp_epoch": "", "CRM_alert_desc": "ok", "CRM_alert_target_rc": "0", "CRM_alert_version": "1.1.15", "CRM_alert_attribute_value": "", "CRM_alert_node": "sapecc-ers", "CRM_alert_exec_time": "" }, "resource": { "type": "global", "labels": { "project_id": "gcp-tse-sap-on-gcp-lab" } }, "timestamp": "2022-01-25T00:17:09.662557309Z", "severity": "INFO", "logName": "projects/gcp-tse-sap-on-gcp-lab/logs/sapecc-ers%2F%2Fvar%2Flog%2Fcrm_alerts_log", "receiveTimestamp": "2022-01-25T00:17:09.662557309Z" }
To get notified of a resource event — for example, when the HANA topology resource monitor fails — you can use the following filter for the alerting definition:
jsonPayload.CRM_alert_node=("hana-venus" OR "hana-mercury") -jsonPayload.CRM_alert_status="0" jsonPayload.CRM_alert_rsc="rsc_SAPHanaTopology_SBX_HDB00" jsonPayload.CRM_alert_task="monitor" To define an alert for a fencing event, your can apply this filter: jsonPayload.CRM_alert_node=("hana-venus" OR "hana-mercury") jsonPayload.CRM_alert_kind="fencing" The fencing log entry gets recorded with warning severity to give you deeper insight, and this additional information is also helpful for more specific filtering criteria: {   "insertId": "1plznskfjsxt82",   "jsonPayload": {     "CRM_alert_attribute_value": "",     "CRM_alert_recipient": "/var/log/crm_alerts_log",     "CRM_alert_rsc": "",     "CRM_alert_rc": "0",     "CRM_alert_timestamp_usec": "529261",     "CRM_alert_desc": "Operation reboot of hana-mercury by hana-venus for crmd.2361@hana-venus: OK (ref=2a9bf814-9adf-4247-af3f-94ac254fc3ca)", "CRM_alert_target_rc": "",     "CRM_alert_nodeid": "",     "CRM_alert_kind": "fencing",     "CRM_alert_node_sequence": "33",     "CRM_alert_task": "st_notify_fence",     "CRM_alert_status": "",     "CRM_alert_exec_time": "",     "CRM_alert_attribute_name": "",     "CRM_alert_timestamp_epoch": "1643072786",     "CRM_alert_version": "1.1.19",     "CRM_alert_timestamp": "2022-01-25T01:06:26.529261Z",     "CRM_alert_interval": "",     "CRM_alert_node": "hana-mercury"   },   "resource": {     "type": "global",     "labels": {       "project_id": "gcp-tse-sap-on-gcp-lab"     }   },   "timestamp": "2022-01-25T01:06:27.267017052Z",   "severity": "WARNING",   "logName": "projects/gcp-tse-sap-on-gcp-lab/logs/hana-venus%2F%2Fvar%2Flog%2Fcrm_alerts_log", "receiveTimestamp": "2022-01-25T01:06:27.267017052Z"
}
Alerts can be delivered through multiple channels, including text and email. Below is an example of an email notification for our earlier example, when we defined an alert for a HANA topology resource monitor failure:
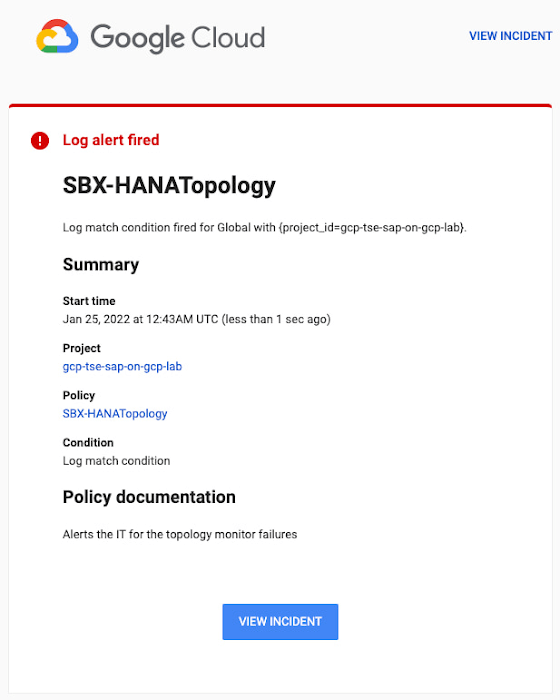
You can write and apply filters to your log-based alerts to isolate certain types of incidents and analyze events over time. For example, the following script will surface a resource event occurring within a two-hour window on a specific date:
timestamp>="2022-01-25T00:00:00Z" timestamp<="2022-01-25T02:00:00Z"
jsonPayload.CRM_alert_kind="resource"
With the ability to analyze these logged alerts over time, determine whether event patterns warrant any action.
[SIDEBAR]
The alert script prints details in the standard output and in the log file /var/log/crm_alerts_log, and this can grow over time. We recommend that the log file is set with the Linux logrotate service in order to limit the file system space. Use the following command to create the necessary logrotate setting for the alerting log file:
cat > /etc/logrotate.d/crm_alerts_log << END-OF-FILE /var/log/crm_alerts_log { create 0660 root root rotate 7 size 10M missingok compress delaycompress copytruncate dateext dateformat -%Y%m%d-%s notifempty } END-OF-FILE [END SIDEBAR]
Tips for Troubleshooting When you first deploy your alert script, how can you tell for certain that you’ve done it correctly? Use the following commands to test it out:
In RHEL:
pcs alert show
In SLES:
sudo crm config show | grep -A3 gcp_cluster_alert
You should see the following if the script is correct:
In RHEL:
Alerts: Alert: gcp_cluster_alert (path=/usr/share/pacemaker/alerts/gcp_crm_alert.sh) Description: "Cluster alerting for hana-node-X" Options: gcloud_cmd=/usr/bin/gcloud gcloud_timeout=5 Meta options: timeout=10s timestamp-format=%Y-%m-%dT%H:%M:%S.%06NZ Recipients: Recipient: gcp_cluster_alert_recepient (value=gcp_cluster_alerts) Options: value=/var/log/crm_alerts_log In SLES:
alert gcp_cluster_alert "/usr/share/pacemaker/alerts/gcp_crm_alert.sh" \ meta timeout=10s timestamp-format="%Y-%m-%dT%H:%M:%S.%06NZ" \ to "/var/log/crm_alerts_log" attributes gcloud_timeout=5 gcloud_cmd="/usr/bin/gcloud" If the commands do not display the alerts properly, re-deploy the script.
In case there is an issue with the script, or if the Cloud Logging records are not presenting as expected, examine the script log file /var/log/crm_alerts_log. The errors and warning can be filtered with:
egrep '(ERROR|WARN)' /var/log/crm_alerts_log
Any Pacemaker alert failures will be recorded in the messages and/or Pacemaker log. To examine recent alert failures, use the following command:
egrep '(gcp_crm_alert.sh|gcp_cluster_alert)' \ /var/log/messages /var/log/pacemaker.log
Keep in mind, though, that the Pacemaker log location may be different in your system from the one in the example above.
From reactive to proactive
Your SAP applications are too critical to risk outages. The most effective way to manage high availability clusters for your SAP systems on Google Cloud is to take full advantage of Pacemaker’s alerting capabilities, so you can be proactive in ensuring your systems are healthy and available.
Learn more about running SAP on Google Cloud.
HarbourBridge Schema Assistant Allows Quick, Bulk Migration to Cloud Spanner
5484
Of your peers have already read this article.
1:30 Minutes
The most insightful time you'll spend today!
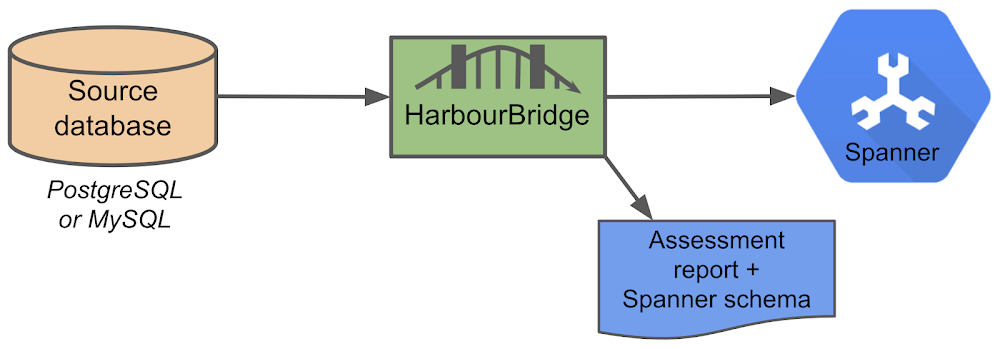
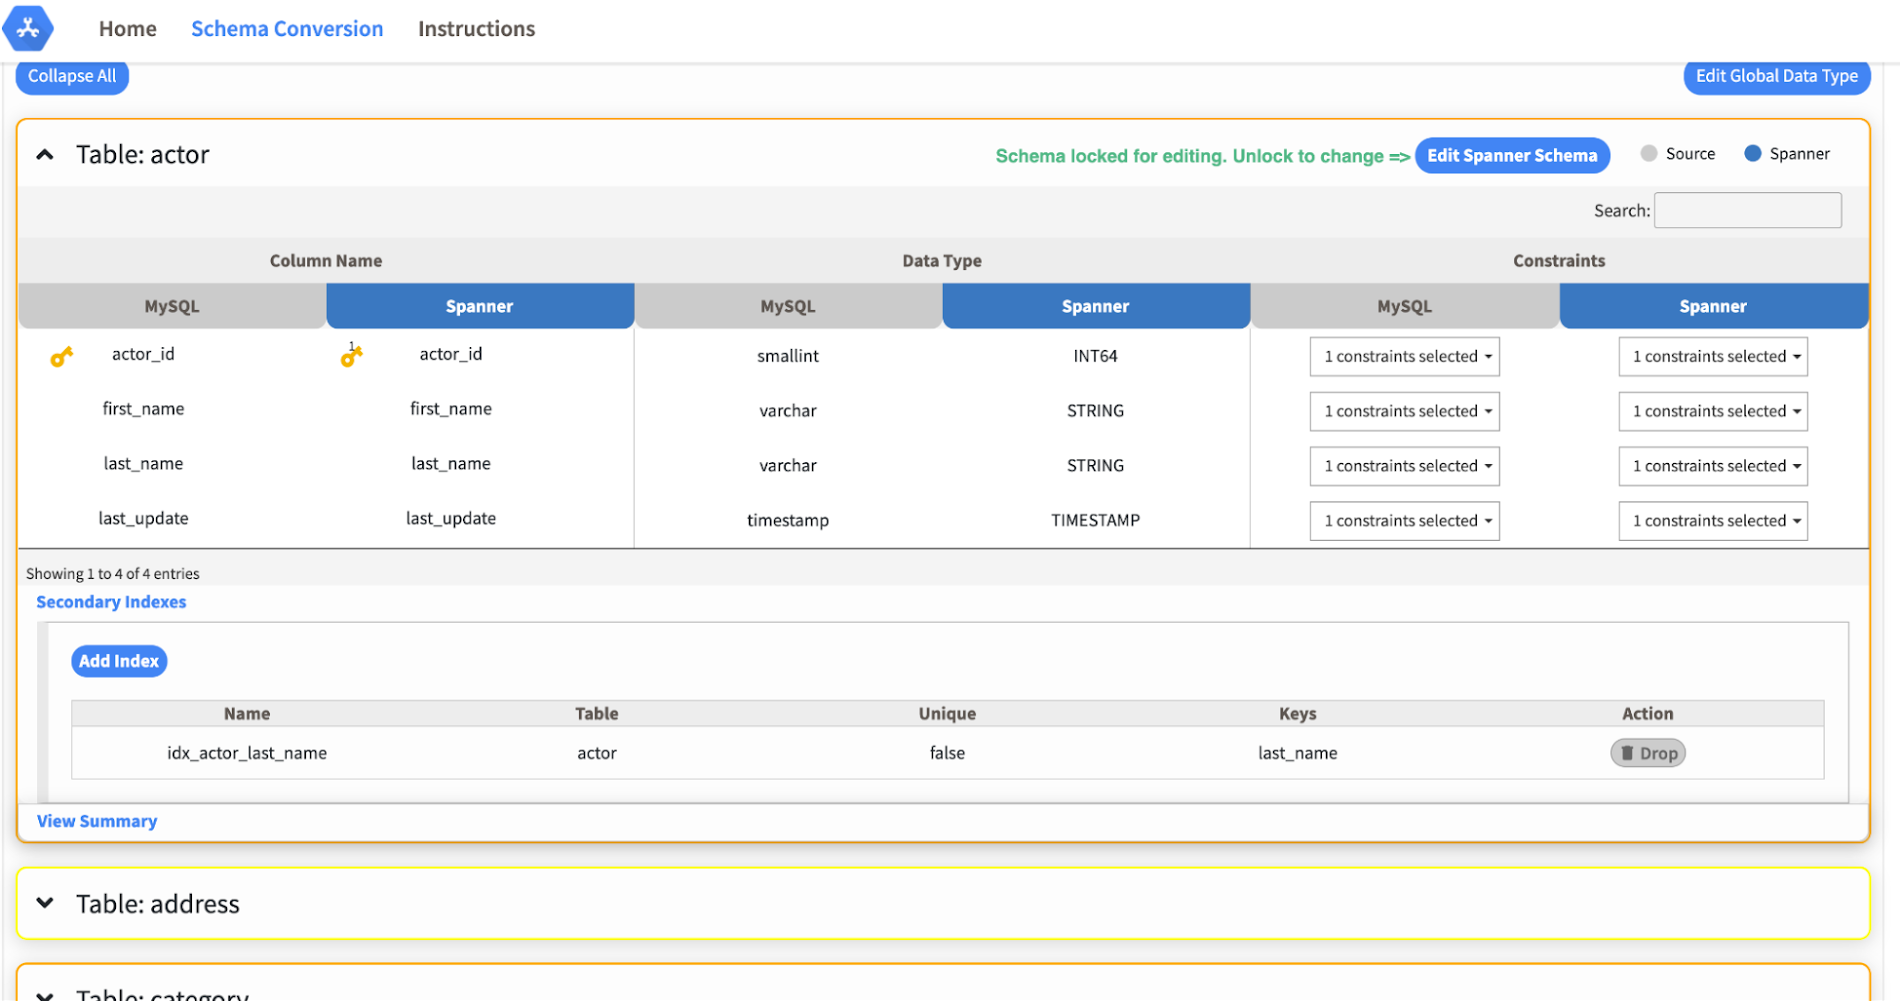
Today we’re announcing the HarbourBridge Schema Assistant, which provides a guided schema-design workflow for migrating from MySQL or PostgreSQL to Spanner. HarbourBridge imports dump files (from mysqldump or pg_dump) or directly connects to your source database, and converts the source database schema to an equivalent Spanner schema. The new Schema Assistant capability displays the source schema and Spanner schema side-by-side, highlights errors and walks you through a series of steps to validate and optimize your Spanner schema. It also produces a browsable assessment report with an overall migration-fitness score for Spanner, a table-by-table detailed analysis of type mappings and a list of features used in the source database that aren’t supported by Spanner. It supports editing of table and column names, column types, primary keys and constraints, as well as dropping of tables, columns, foreign keys and secondary indexes.
The new Schema Assistant complements HarbourBridge’s existing data and schema migration capabilities and is a critical step towards our goal of building a complete open-source migration toolkit. HarbourBridge continues to support command-line schema and data migration and turn-key Spanner evaluation.
Complementing the bulk data migration capabilities of HarbourBridge, we are also announcing the ability to migrate change events from MySQL to Cloud Spanner.
Supported Features in Schema Assistant
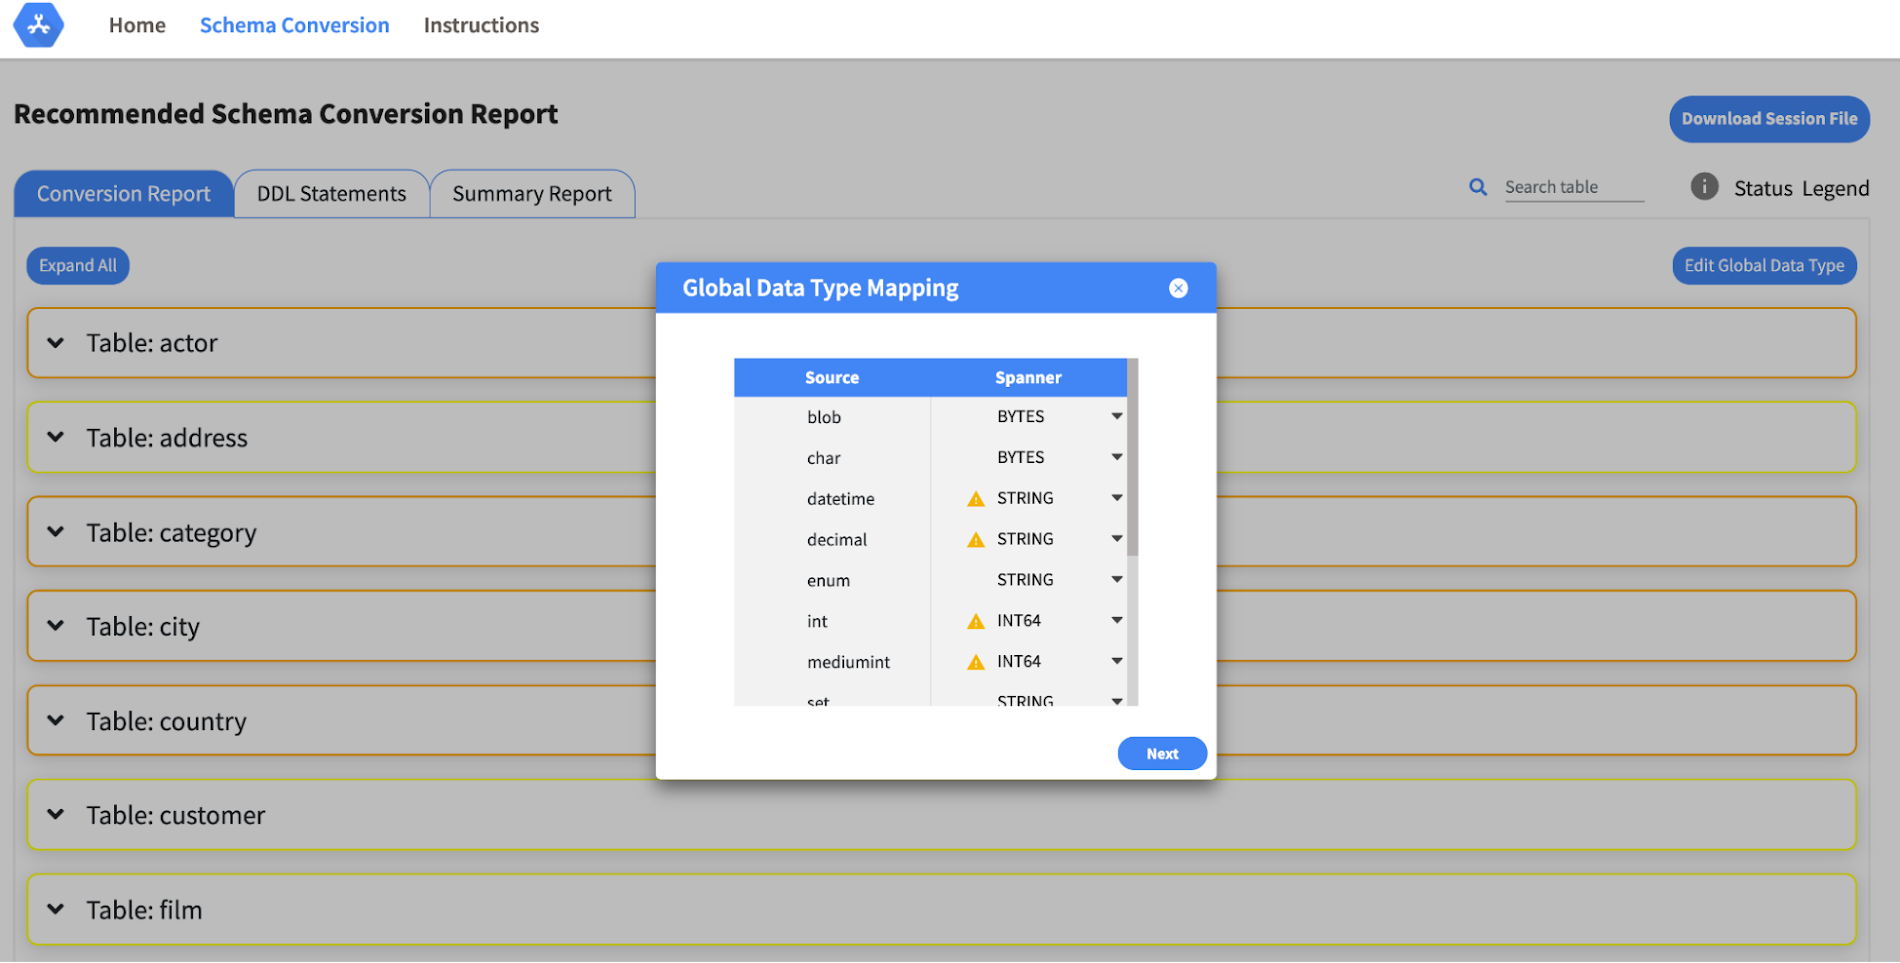
- Global type mapping. Users can customize the global mapping for how types should be mapped to Spanner consistently across the schema. For example, mapping large integers in source schema to Spanner’s NUMERIC.
- Local type mapping. Users can override the custom type mapping for a given table/column.
- Session management. A session keeps track of all the changes made to the schema mapping.
- Customization of secondary indexes. Users can add, edit and delete secondary indexes to optimize their Spanner performance.
- Customization of foreign keys and interleaved tables. Table interleaving is an important design consideration when migrating to Cloud Spanner as explained in more detail in this blog post.
Features in the pipeline
We are already working to further expand the supported set of schema editing features and welcome your feedback. We are particularly excited to expand the Schema Assistant’s design recommendations for optimizing Spanner schemas e.g. in-depth recommendations for primary key design.
HarbourBridge is open source and we gladly accept contributions from the wider community.
Explore the Complete Startups’ Technical Guide on Google Cloud Tech Channel

3382
Of your peers have already read this article.
1:30 Minutes
The most insightful time you'll spend today!
Bootstrap your Startup with our technical guided series
At Google Cloud, we want to provide you with the access to all the tools you need to grow your business. Through the Google Cloud Technical Guides for Startups, leverage industry leading solutions with how-to video guides and resource handbooks curated for startups.
This multi-series contains 3 chapters: Start, Build and Grow, which matches your startup’s stage of growth:
- The Start Series: Begin by building, deploying and managing new applications on Google Cloud from start to finish.
- The Build Series: Optimize and scale existing deployments to reach your target audiences.
- The Grow Series: Grow and attain scale with deployments on Google Cloud.
Kick off with The Start Series
The Start Series is designed to help your startup begin building, deploying and managing new applications on Google Cloud from start to finish. The series contains 12 videos and is dedicated to those who are starting out their cloud journey with Google Cloud. From setting up your project, to choosing the right compute option, to configuring your networking to managing your databases, and understanding support and billing – the Start Series guides you at every step of the journey.
Check out our website and our Google Cloud Technical Guides for Startups full playlist.
Coming up next – The Build Series
Launch into the next part of the journey continuing from the Start Series, with the upcoming Build Series, where we will be focusing on the optimization and scaling of existing deployments to help your startups reach your target audiences.
Join us by checking out the video series on the Google Cloud Tech channel, and subscribe to stay up to date.
See you in the cloud!
Dataflow Guarantees 50+% Increase in Developer Productivity and Infrastructure Cost Savings: Read More

8402
Of your peers have already read this article.
3:00 Minutes
The most insightful time you'll spend today!
In our conversations with technology leaders about data-driven transformation using Google Data Cloud – industry’s leading unified data and AI solution – , one important topic is incorporating continuous intelligence to move from answering questions such as “What has happened? to questions like “What is happening?” and “What might happen?”. The core to this evolution is the need for an underlying data processing that not only provides powerful real-time capabilities for events happening close to origination, but also brings together existing data sources under one unified data platform to enable organizations to draw insights and take actions holistically. Dataflow, Google’s cloud-native data processing and streaming analytics platform, is a key component of any modern data and AI architecture and data transformation journey, along with BigQuery, Google’s internet-scale warehouse with built-in streaming, BI engine and ML; Pub/Sub, a global no-ops event delivery service; and Looker, a modern BI and embedded analytics platform. One of the key evaluation factors is potential economic value of Dataflow to their organization, particularly in the context of engaging other stakeholders is key for many of the leaders that we engage with. So we commissioned Forrester Consulting to conduct a comprehensive study on the impact that Dataflow had on their organization by interviewing actual customers .
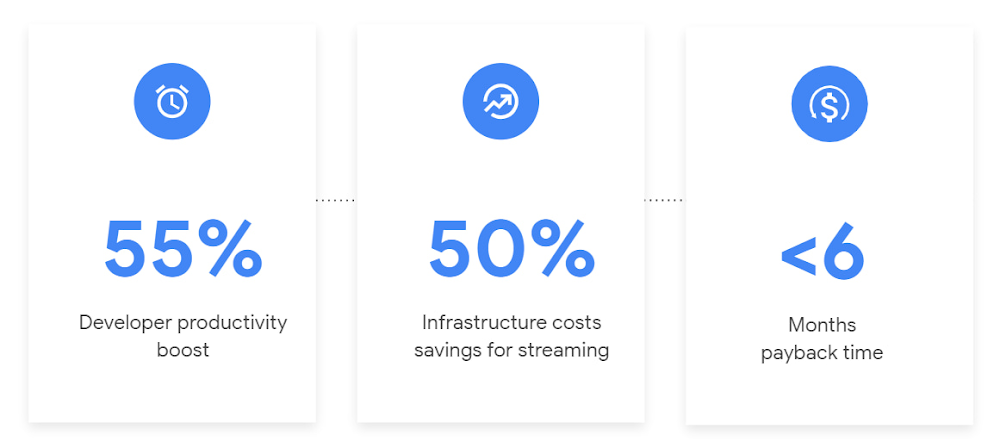
Today we’re excited to share our commissioned study conducted by Forrester Consulting, the Total Economic Impact™ of Google Cloud Dataflow, which allows data leaders to understand and quantify the benefits of Dataflow, and use cases it enables. Forrester conducted interviews with Dataflow customers to evaluate the benefits, costs, and risks of investing in Dataflow across an organization. Based on their interviews, Forrester identified major financial benefits across four different areas: business growth, infrastructure cost savings, data engineer productivity, and administration efficiency. In fact, Forrester found that customers adopting Dataflow can achieve a 55% boost in developer productivity and a 50% reduction in infrastructure costs. In fact, Forrester projects that customers adopting Dataflow can achieve a range of up to 171% Return on Investment (ROI) and a less than six months payback period. Customers can now use figures in the report to compute their own Return on Investment (ROI) and payback period.
“Dataflow is integral to accelerating time-to-market, decreasing time-to-production, reducing time to figure out how to use data for use cases, focusing time on value-add tasks, streamlining ingestion, and reducing total cost of ownership.” – Lead technical architect, CPG
Let’s take a deeper look at the ways that Forrester found that Dataflow can help you achieve your goals and unlock your business potential.
Benefit #1: Increase data engineer productivity by 55%
Developers can choose among a variety of programming languages to define and execute data workflows. Dataflow also seamlessly integrates with other Google Cloud Platform and open source technologies to maximize value and applicability to a wide variety of use cases. Dataflow streamlined workflows with code reusability,dynamic templates, and the simplicity of a managed service. Engineers trusted pipelines to run correctly and adhere to governance. Data engineers avoided laborious issue-monitoring and remediation tasks that were common in the legacy environments such as poor performance, lack of availability, and failed jobs. Teams valued the language flexibility and open source base.
“Dataflow provided us with ETL replacement that opened limitless potential use cases and enabled us to do smarter data enhancement while data remains in motion.” — Director of data projects, financial services
Benefit #2: Reduce infrastructure costs by up-to 50% for batch and streaming workloads
Dataflow’s serverless autoscaling and discrete control of job needs, scheduling, and regions eliminated overhead and optimized technology spending. Consolidating global data processing solutions to Dataflow further eliminated excess costs while ensuring performance, resilience, and governance across environments. Dataflow’s unified streaming and batch data platform gives organizations the flexibility to define either workload in the same programming model, run it on the same infrastructure, and manage it from a single operational management tool.
“Our costs with our cloud data platform using Dataflow are just a fraction of the costs we faced before. Now we only pay for cloud infrastructure consumption because the open source base helps us avoid licensing costs. We spend about $120,000 per year with Dataflow, but we’d be spending millions with our old technologies.” – Lead technical architect, CPG
Benefit #3: Increase top-line revenue by improving customer experience and retention with payback time of < 6 months
Streaming analytics is an essential capability in today’s digital world to gain real-time actionable insights. Likewise, organizations must also have flexible, high- performance batch environments to analyze historical data for building machine learning models, business intelligence, and advanced analytics. Dataflow enabled real-time streaming use cases, improved data enrichment, encouraged data exploration,improved performance and resiliency, reduced errors, increased trust, and eliminated barriers to scale. As a result, organizations provided customers with more accurate, relevant, and in-the-moment data-backed services and insights — boosting customer experience, creating new revenue streams, and improving acquisition, retention, and enrichment.
“It’s already been proven that we are getting more business [with Dataflow] because we can turn around results faster for customers.” – VP of technology, financial services technology
“When we provide data to our customers and partners with Dataflow, we are much more confident in those numbers and can provide accurate data within a minute. Our customers and partners have taken note and commented on this. It’s reduced complaints and prevented churn.” – Senior software engineer, media
Other benefits
Eliminated administrative overhead and toil
As a cloud-native managed service, all administration tasks such as provisioning, scaling, and updates are automatically handled by Google Cloud. Teams no longer need to manage servers and related software for legacy data processing solutions. Admins also streamlined processes for setting up data sources, adding pipelines, and enforcing governance.
Saved business operations costs for support teams and data end users
Dataflow improved the speed, quality, reliability, and ease of access to data for insights for general business users, saving time and empowering users to drive better data-backed outcomes. It also reduced support inquiry volume while automating manual job creation.
What’s next?
Download the Forrester Total Economic Impact study today to dive deep into the economic impact Dataflow can deliver your organization. We would love to partner with you to explore the potential Dataflow can unlock in your teams. Please reach out to our sales team to start a conversation about your data transformation with Google Cloud.
More Relevant Stories for Your Company

Google Cloud’s Metric Scope Makes Multi-project Monitoring Simple
Customers need scale and flexibility from their cloud and this extends into supporting services such as monitoring and logging. Google Cloud’s Monitoring and Logging observability services are built on the same platforms used by all of Google that handle over 16 million metrics queries per second, 2.5 exabytes of logs per month, and over

Telus Ensures Workers’ Safety Using Edge and 5G
Editor’s note: In February 2021, Google Cloud and TELUS announced a 10-year strategic alliance to drive innovation of new services and solutions across data analytics, machine learning, and go-to-market strategies that support digital transformation within key industries, including communications technology, healthcare, agriculture, and connected home. By December 2021, TELUS had


Metro Consolidates 100 SAP Instances on Google Cloud
German retailer Metro, with operations in 25 countries across Europe and Asia and employing over 150,000 people, decided to consolidate its 100 SAP instances into one SAP S/4HANA system running on the Google Cloud Platform. This helped the company lower costs, increase efficiency, and improve customer experience. In addition, the

Google Announced Leader in 2021 Gartner Magic Quadrant for Cloud Infrastructure and Platform Services
For the fourth consecutive year, Gartner has positioned Google as a Leader in the 2021 Gartner Magic Quadrant for Cloud Infrastructure and Platform Services (formerly titled as Magic Quadrant for Cloud Infrastructure as a Service upto 2014 Infrastructure as a Service, or (IaaS). With our customers and communities adjusting to new ways
