





How to Configure GCP for Live Network Forensics

3038
Of your peers have already read this article.
3:00 Minutes
The most insightful time you'll spend today!
Forensics is the application of science to criminal and civil laws. It is a proven approach for gathering and processing evidence at a crime scene. An integral step in the forensics process is the isolation of the scene without contaminating or modifying the evidence. The isolation step prevents any further contamination or tampering with possible evidence. The same philosophy can be applied to the investigation of digital events.
In this post we will review methods, tactics and architecture designs to isolate an infected VM while still making it accessible to forensic tools. The goal is to allow access so that data and evidence can be captured while protecting other assets. There are many forensic tools for networking that can be used to analyze the captured traffic. This post does not cover these tools but rather how to configure GCP to capture live traffic in the most efficient and secured way. Once traffic is captured, customers can use whatever tools they prefer to run the analysis. More details about these tools and required agents can be found here and details about open source tooling that Google and others are developing are available here.
In cloud security context, when a VM shows signs of compromise, the most common immediate reaction is to take a snapshot, shut down the instance and relocate the image snapshot to an isolated environment, a method known as “dead analysis”. However, shutting down the instance will impede an important step in the investigation and digital forensics, as some important information in a buffer or the RAM may be lost.
The other forensic approach is “live analysis”, in which the VM is kept on and evidence is gathered from the VM directly. Live forensics enables the imaging of RAM, bypasses most hard drives and software encryption, determines the cause of abnormal traffic, and is extremely useful when dealing with active network intrusions. This process is usually performed by forensic analysts. For example, if there is a good chance the malware resides only in memory then live forensics is, in some cases, the only way to capture and analyze the malware. In this method, in addition to disk and memory evidence, a forensic analysis can also capture live-network from data sent over the compromised VM network interfaces. Some of the benefits of collecting live networks are reconstruction and visualizing traffic flow in real-time, in particular during active network intrusions or attacks.
In the cloud, a VM must be isolated when it becomes apparent that an incident has happened, in order to protect other VMs from being infected. Our Cloud Forensics 101 session covers the process and required artifacts, such as logs, that need to be collected for cloud forensics.
What happens when your image is compromised
Let’s now assume that one of the VMs in your infrastructure has been compromised and alarms are coming from products such as GCP’s Cloud Security and Command Center, Chronicle backstory or your SIEM.
An incident response plan consists of 3 phases: preparation (actions taken before an attack), detection (actions taken during an attack) and response (actions taken after an attack). During the detection phase, the Computer Security Incident Response Team (CSIRT) or threat analysts decide whether live acquisition analysis is required. If live forensics is required, for example when it is vital to acquire a VM’s RAM, then one of the first courses of action is to isolate and contain the VM from the rest of the world and connect the Forensics VPC to the VM for investigation. The forensics VPC resides in a forensics GCP project, it includes digital forensics tools to capture evidence from the VM such as SANS Investigative Forensics Toolkit – SIFT, The Sleuth Kit, Autopsy, Encase, FTK and alike. These tools are already installed, configured, tested and ready to use. The forensics project will also save and preserve evidence such as disk and memory images for forensic review.
We’ll cover two scenarios in this post, the first scenario is to isolate the image and connect the forensics VPC to the image for live acquisition.
In the second scenario we will also capture live traffic from the isolated image for live network digital forensics. To capture live traffic from the infected VM, we will leverage the GCP Packet Mirroring service to duplicate all traffic going in and out of the VM and send it to a Forensics VPC for analysis. Network forensics analysis tools such as Palo Alto VM-Series for IDS, ExtraHop Reveal(x), CheckPoint CloudGuard, Arkime (formerly Moloch), Corelight are installed, configured and ready for deployment in the Forensics VPC, these tools will be used to analyze the duplicate network traffic.
Isolating the infected VM from other resources and connecting the forensics VPC
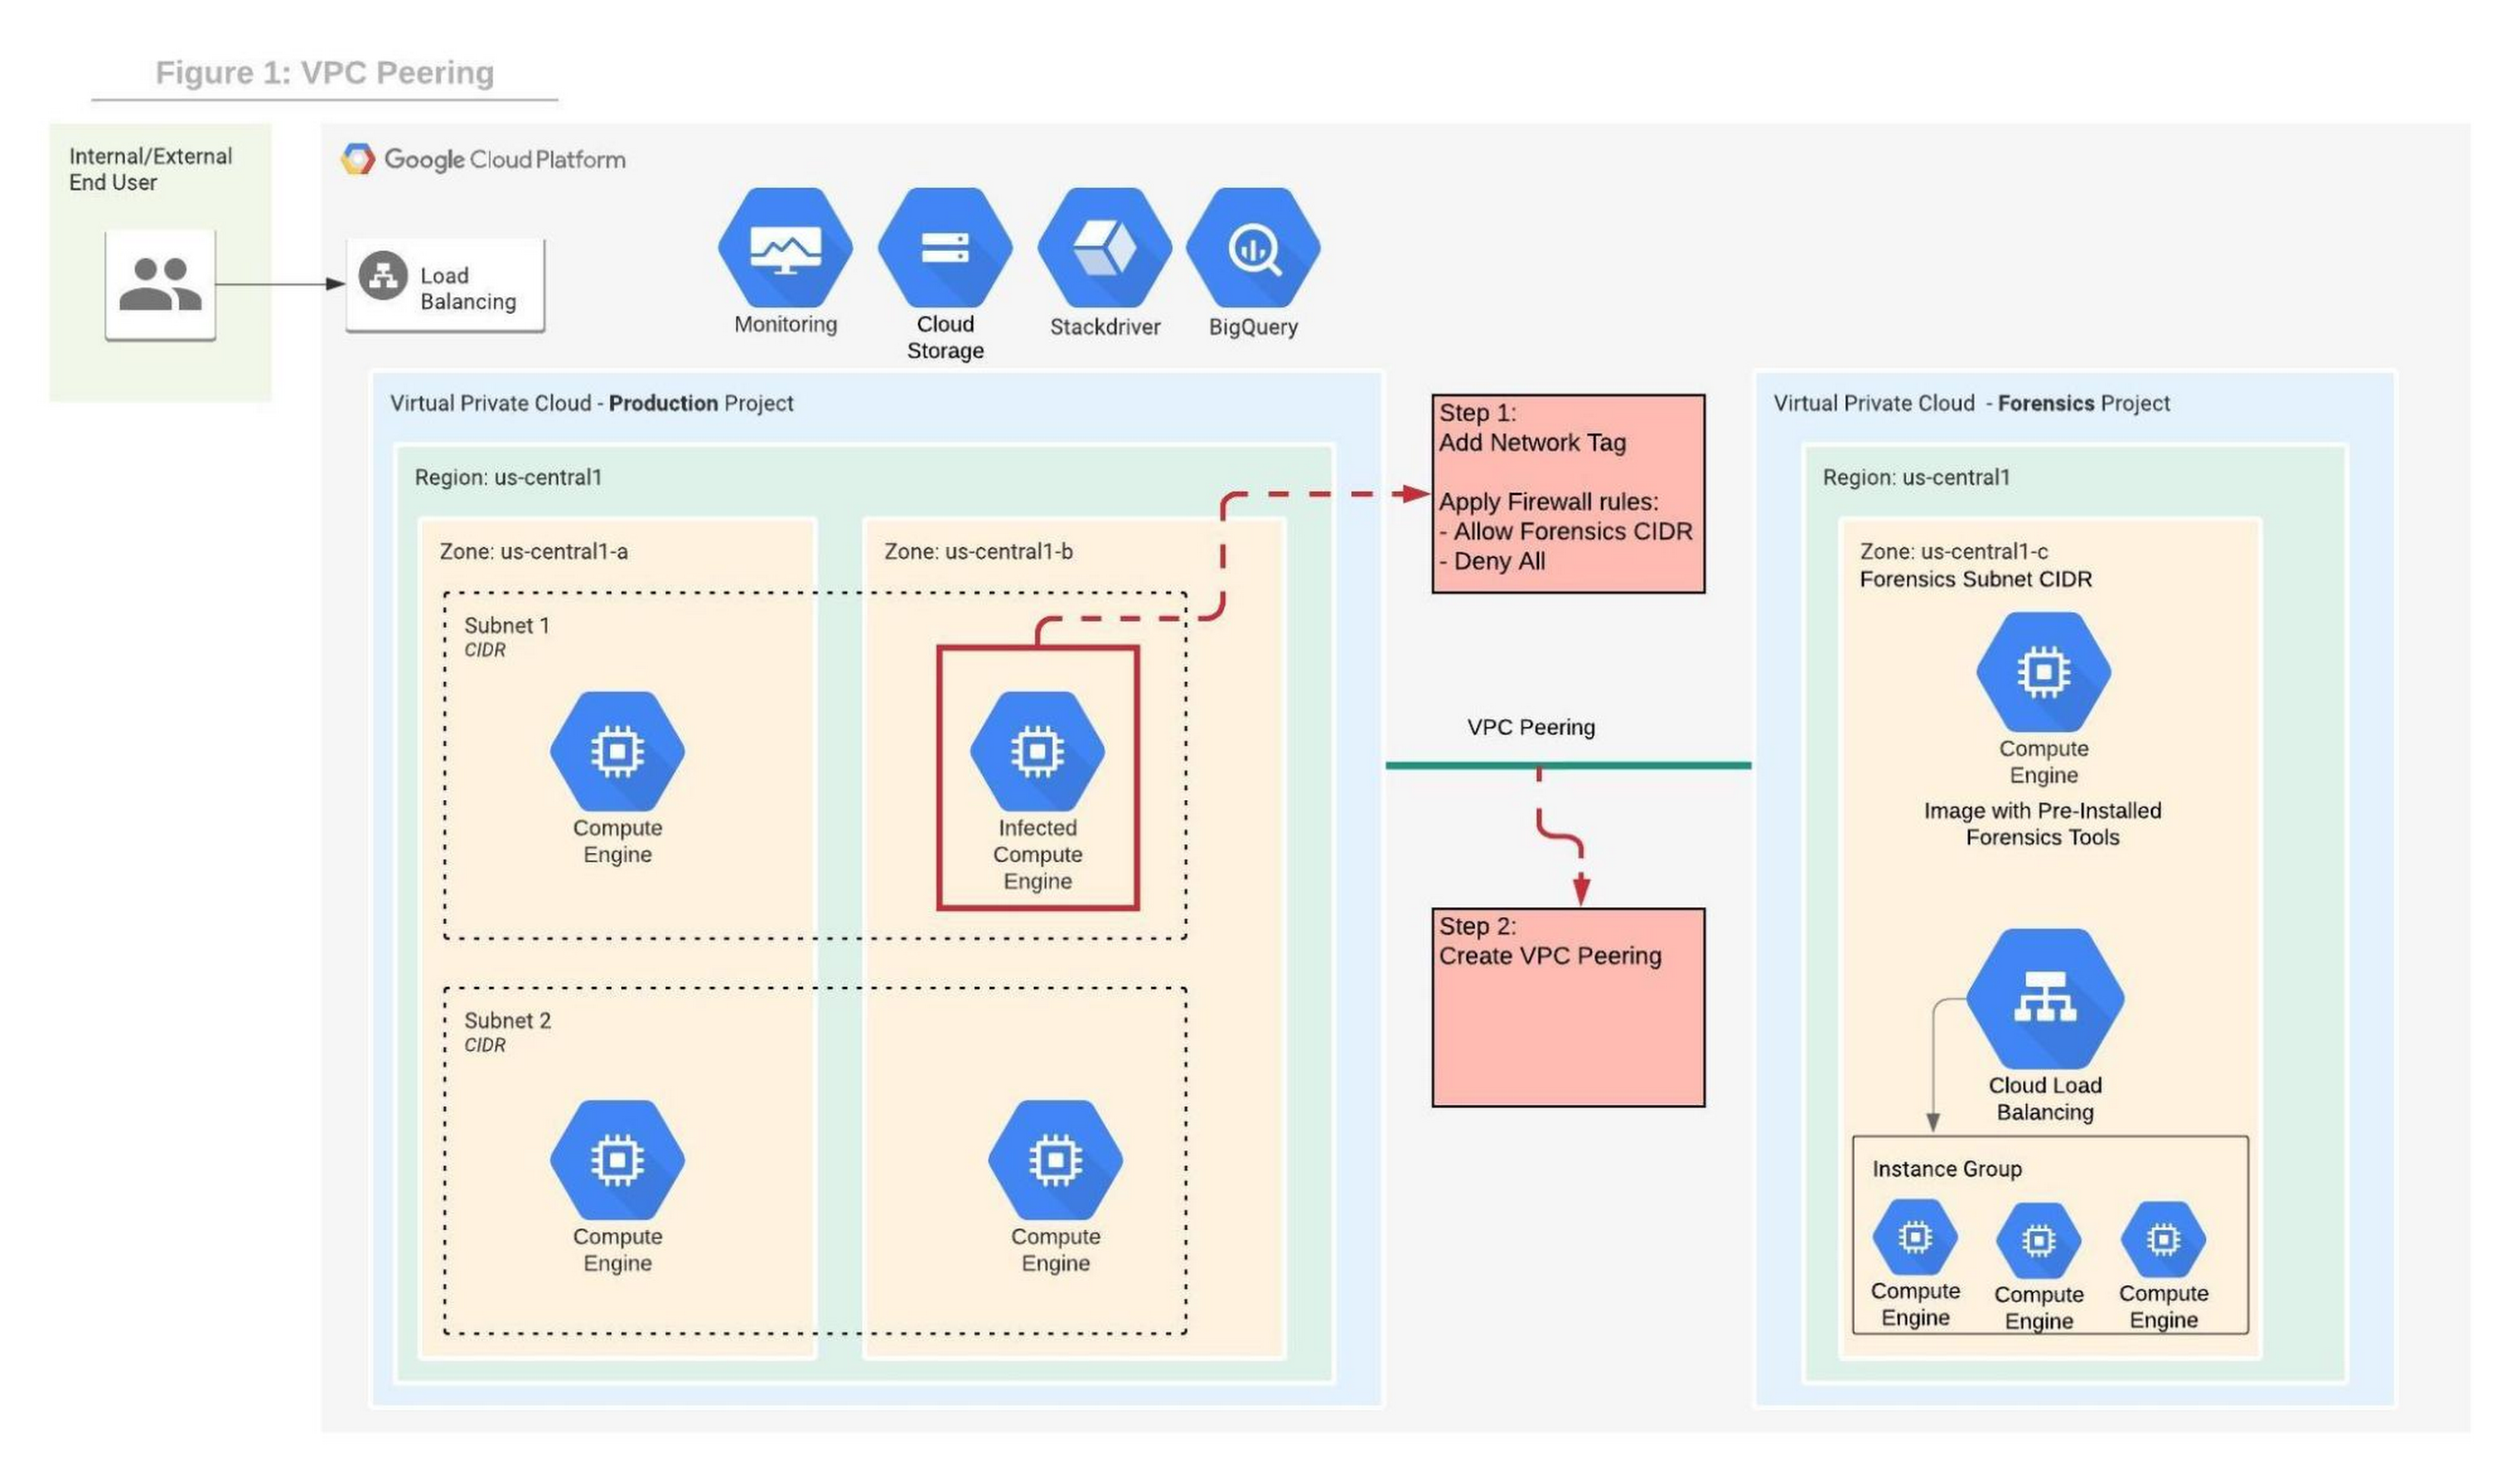
As part of the Incident Response plan preparation phase, the CSIRT created a Google Cloud Forensics Project. Since the Forensics project will be used only when needed, it’s better to automate the creation of the project and its resources with a tool such as Terraform. It is important to grant access to this project only to individuals and groups who deal with incident response and forensics, such as CSIRT. As shown in figure 1, the Forensics project on the right includes its own VPC, non-overlapped subnet and VM images with pre-installed and pre-configured forensics tools. Internal load-balancer and instance-groups are also configured, we will use these resources to capture live traffic, as described later in this post.
In order to contain the spread of any malware or network activity, such as data exfiltration, we’ll isolate the VM with VPC firewall rules. The GCP VPC firewall is a distributed firewall that always enforces its rules, protecting the instances regardless of their configuration and operating systems. In other words, the compromised VM cannot override the firewall enforcement if its policies follow the principle of least privilege . Rules can be applied to all instances in the network, target network tags or service accounts.
Step 1 in the diagram above shows how an infected VM is isolated from the rest of the network by firewall rules that deny any ingress and egress traffic from any CIDR beside the forensics subnet CIDR. The infected VM is tagged with a unique network tag, for example “<image-name>_InfectedVM”, then firewalls rules are applied on the network tag. This ensures that the infected VM is isolated from the project and the Internet while enabling access to the VM via VPC peering which we’ll configure in step-2. You can learn more about VPC firewalls rules here.
In step 2, the VPC from the forensics project is peered with the VPC in the production project. When VPC peering is established routes are exchanged between the VPCs. By default, VPC peering exchanges all subnet routes, however, custom routes can also be filtered if required. At this point, the VM from the forensics project can communicate with the infected VM and start the live forensics analysis job using the pre-installed and pre-configured forensics tools.
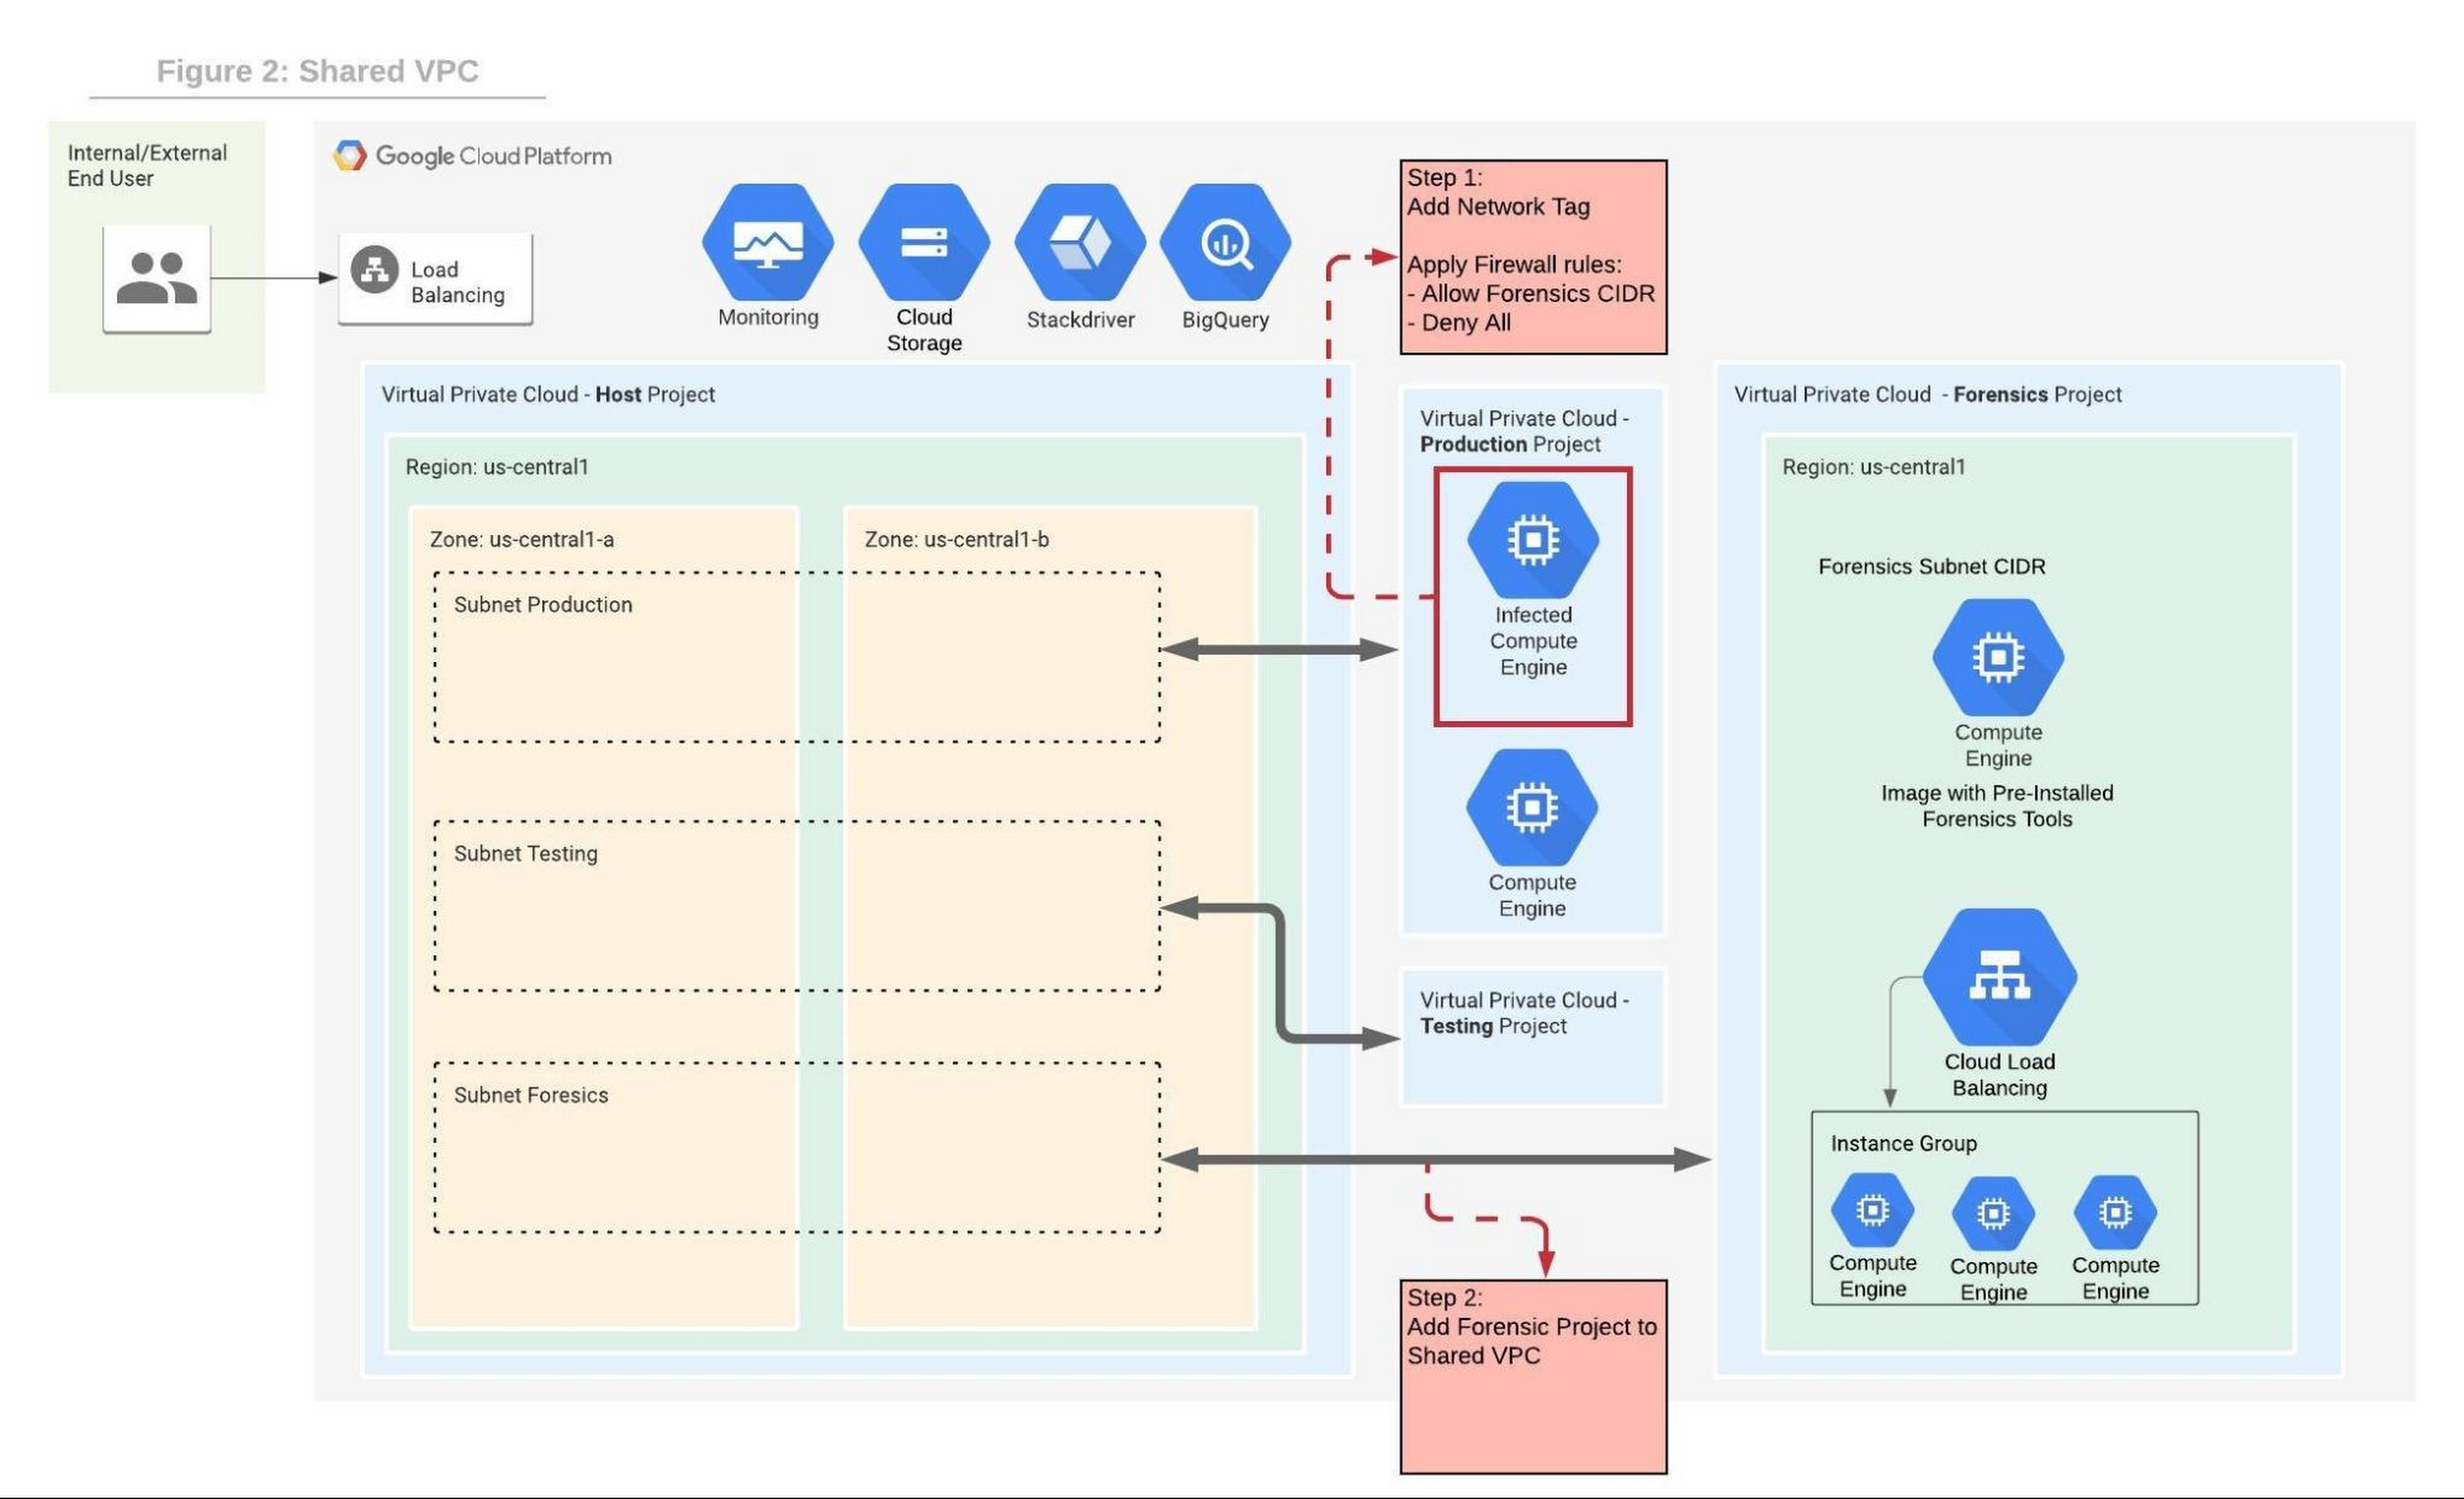
Shared VPC is a network construct that allows you to connect resources from multiple projects, called service-projects, to a common VPC in a host-project. VPCs from different projects can securely communicate with each other via the hosted project network while centralizing the network administration. Figure 2 depicts Shared VPC topology, rather than using VPC peering, during step 2 the Forensics project is simply attached to the host project. After the attachment, the Shared VPC allows the forensics tools to communicate with the infected VMs.
Capturing live network traffic with Google Traffic Mirroring
If live network forensics is required, for example during active network intrusions, then the incoming and outgoing traffic needs to be duplicated and captured. While VPC Flow logs capture the networking metadata telemetry, this is not enough for live network forensics analysis. GCP Packet Mirroring clones the traffic of a specified instance in a VPC and forwards it to a specified internal load balancer which collects the mirrored traffic and sends it to an attached instance group. Packet mirroring captures all the traffic from the specified subnet, network tags, or instance name.
Figure 3 depicts the steps that allow the compromised VM to communicate with the rest of the world (for example beaconing with C&C) while capturing all traffic for investigation in a peered VPC deployment.
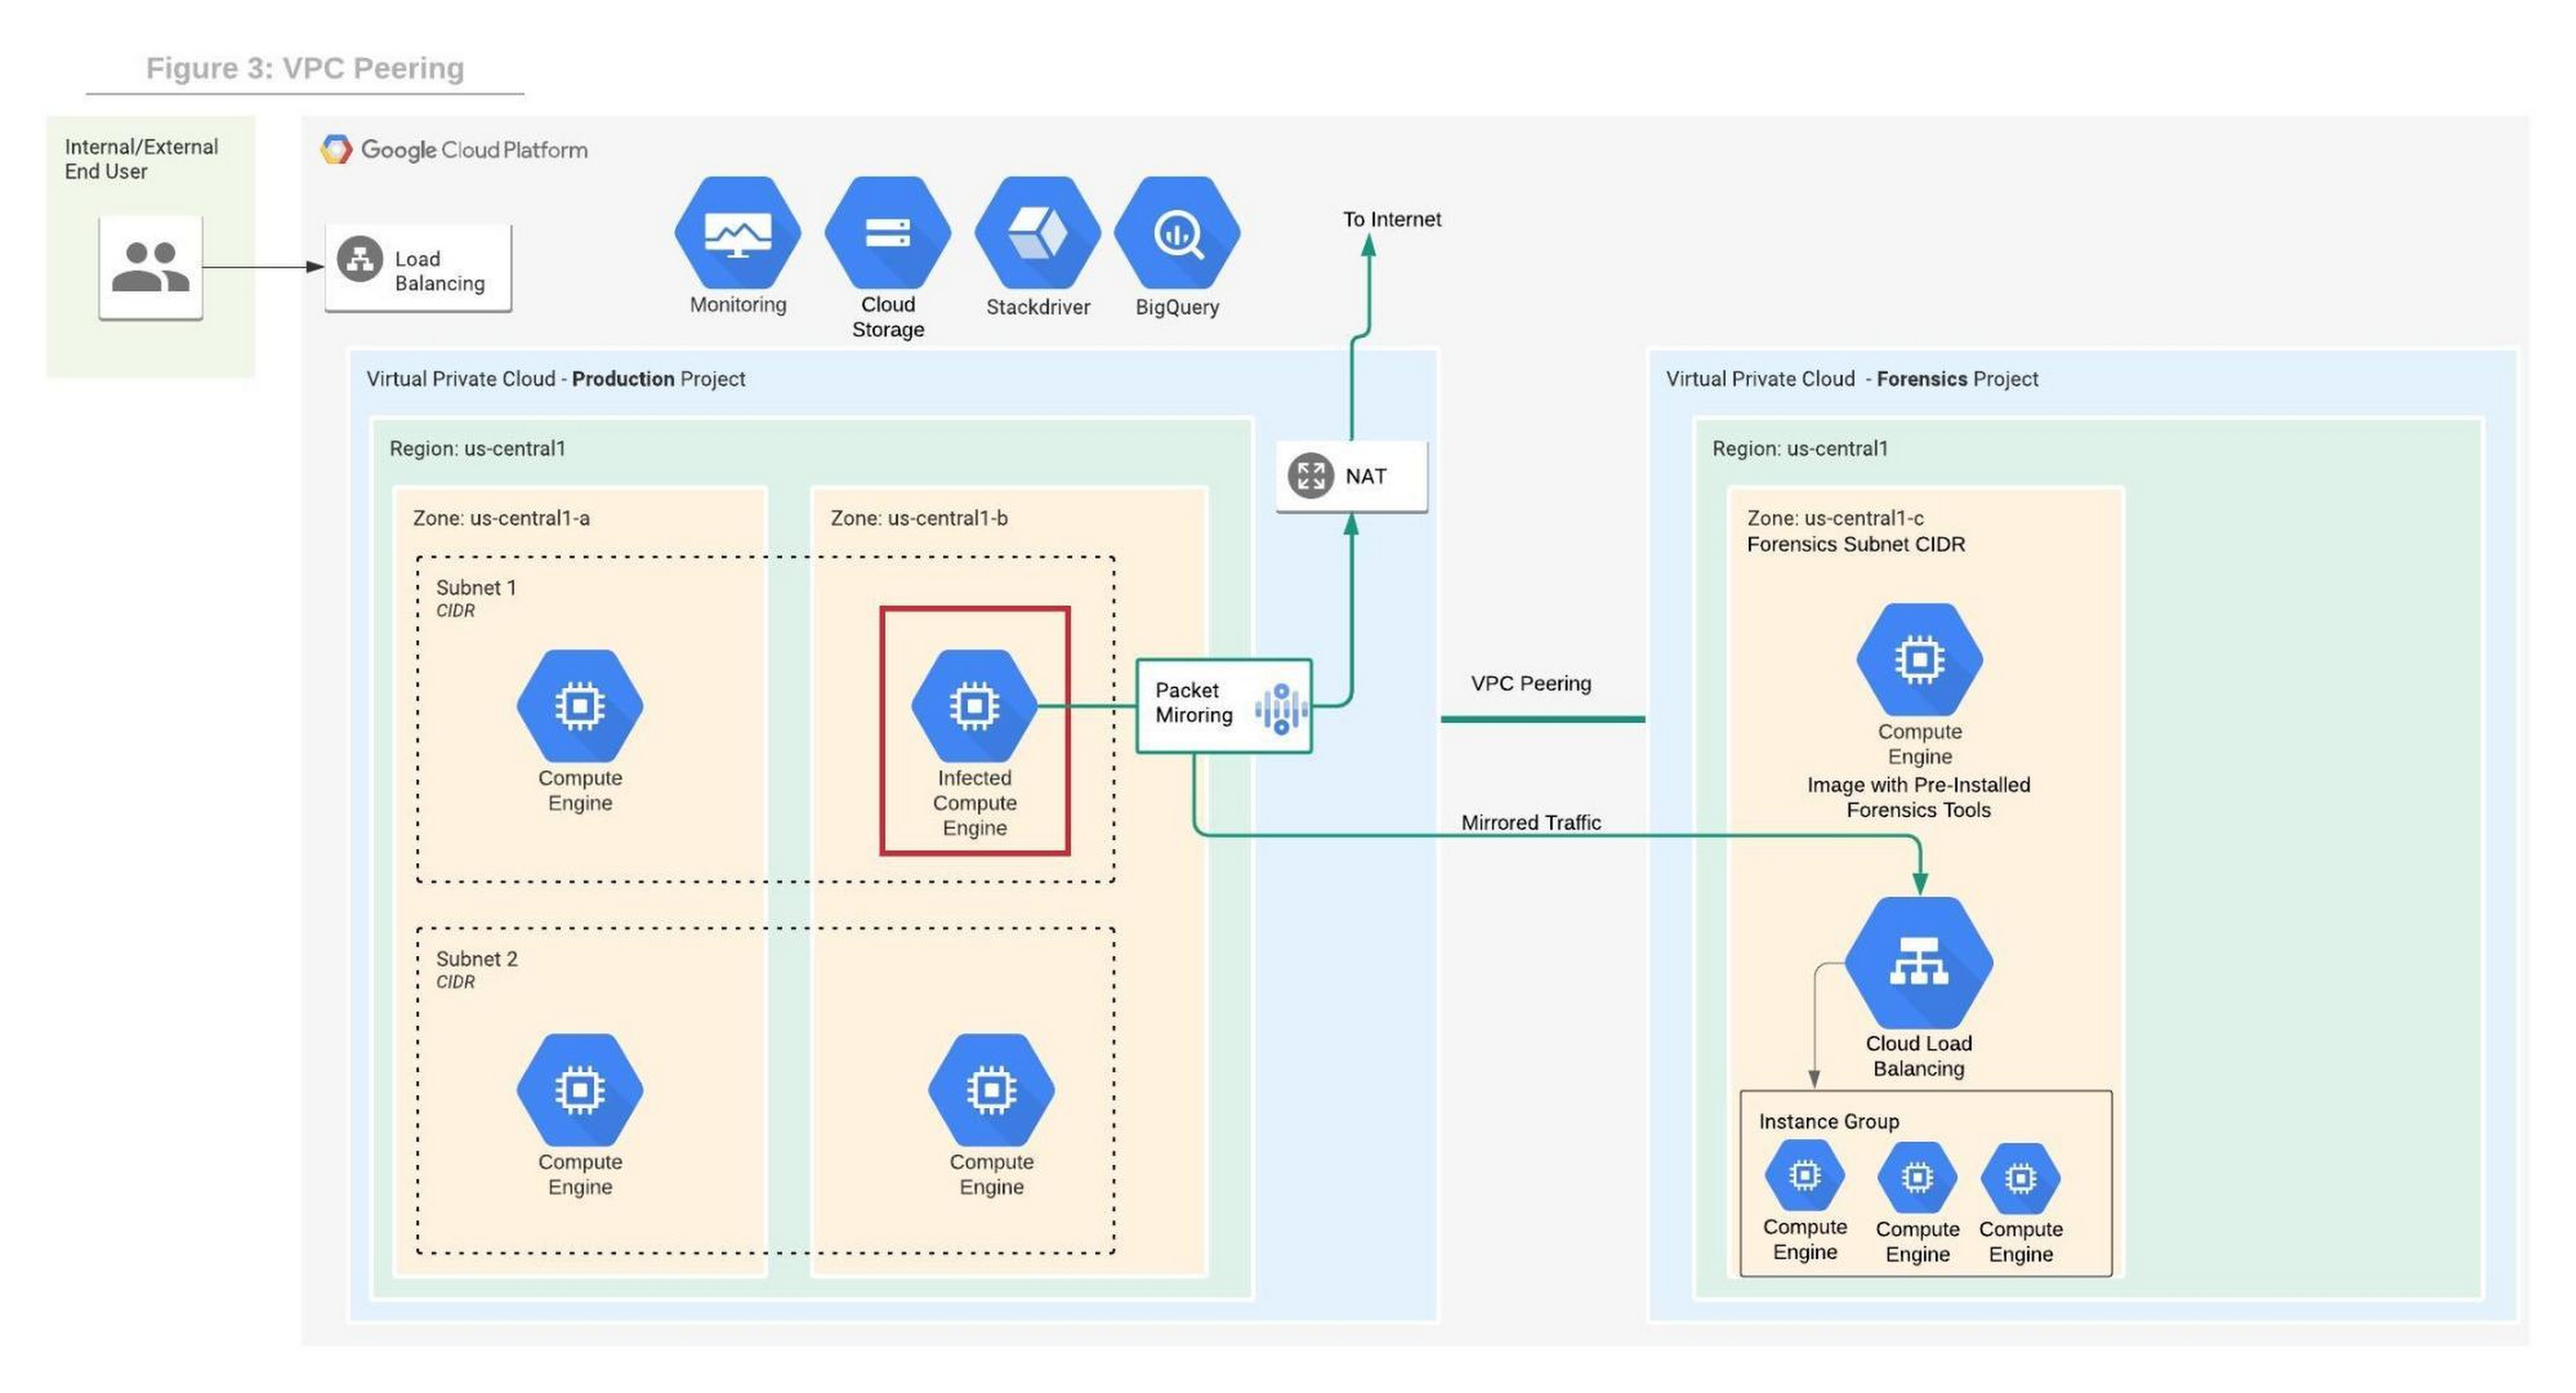
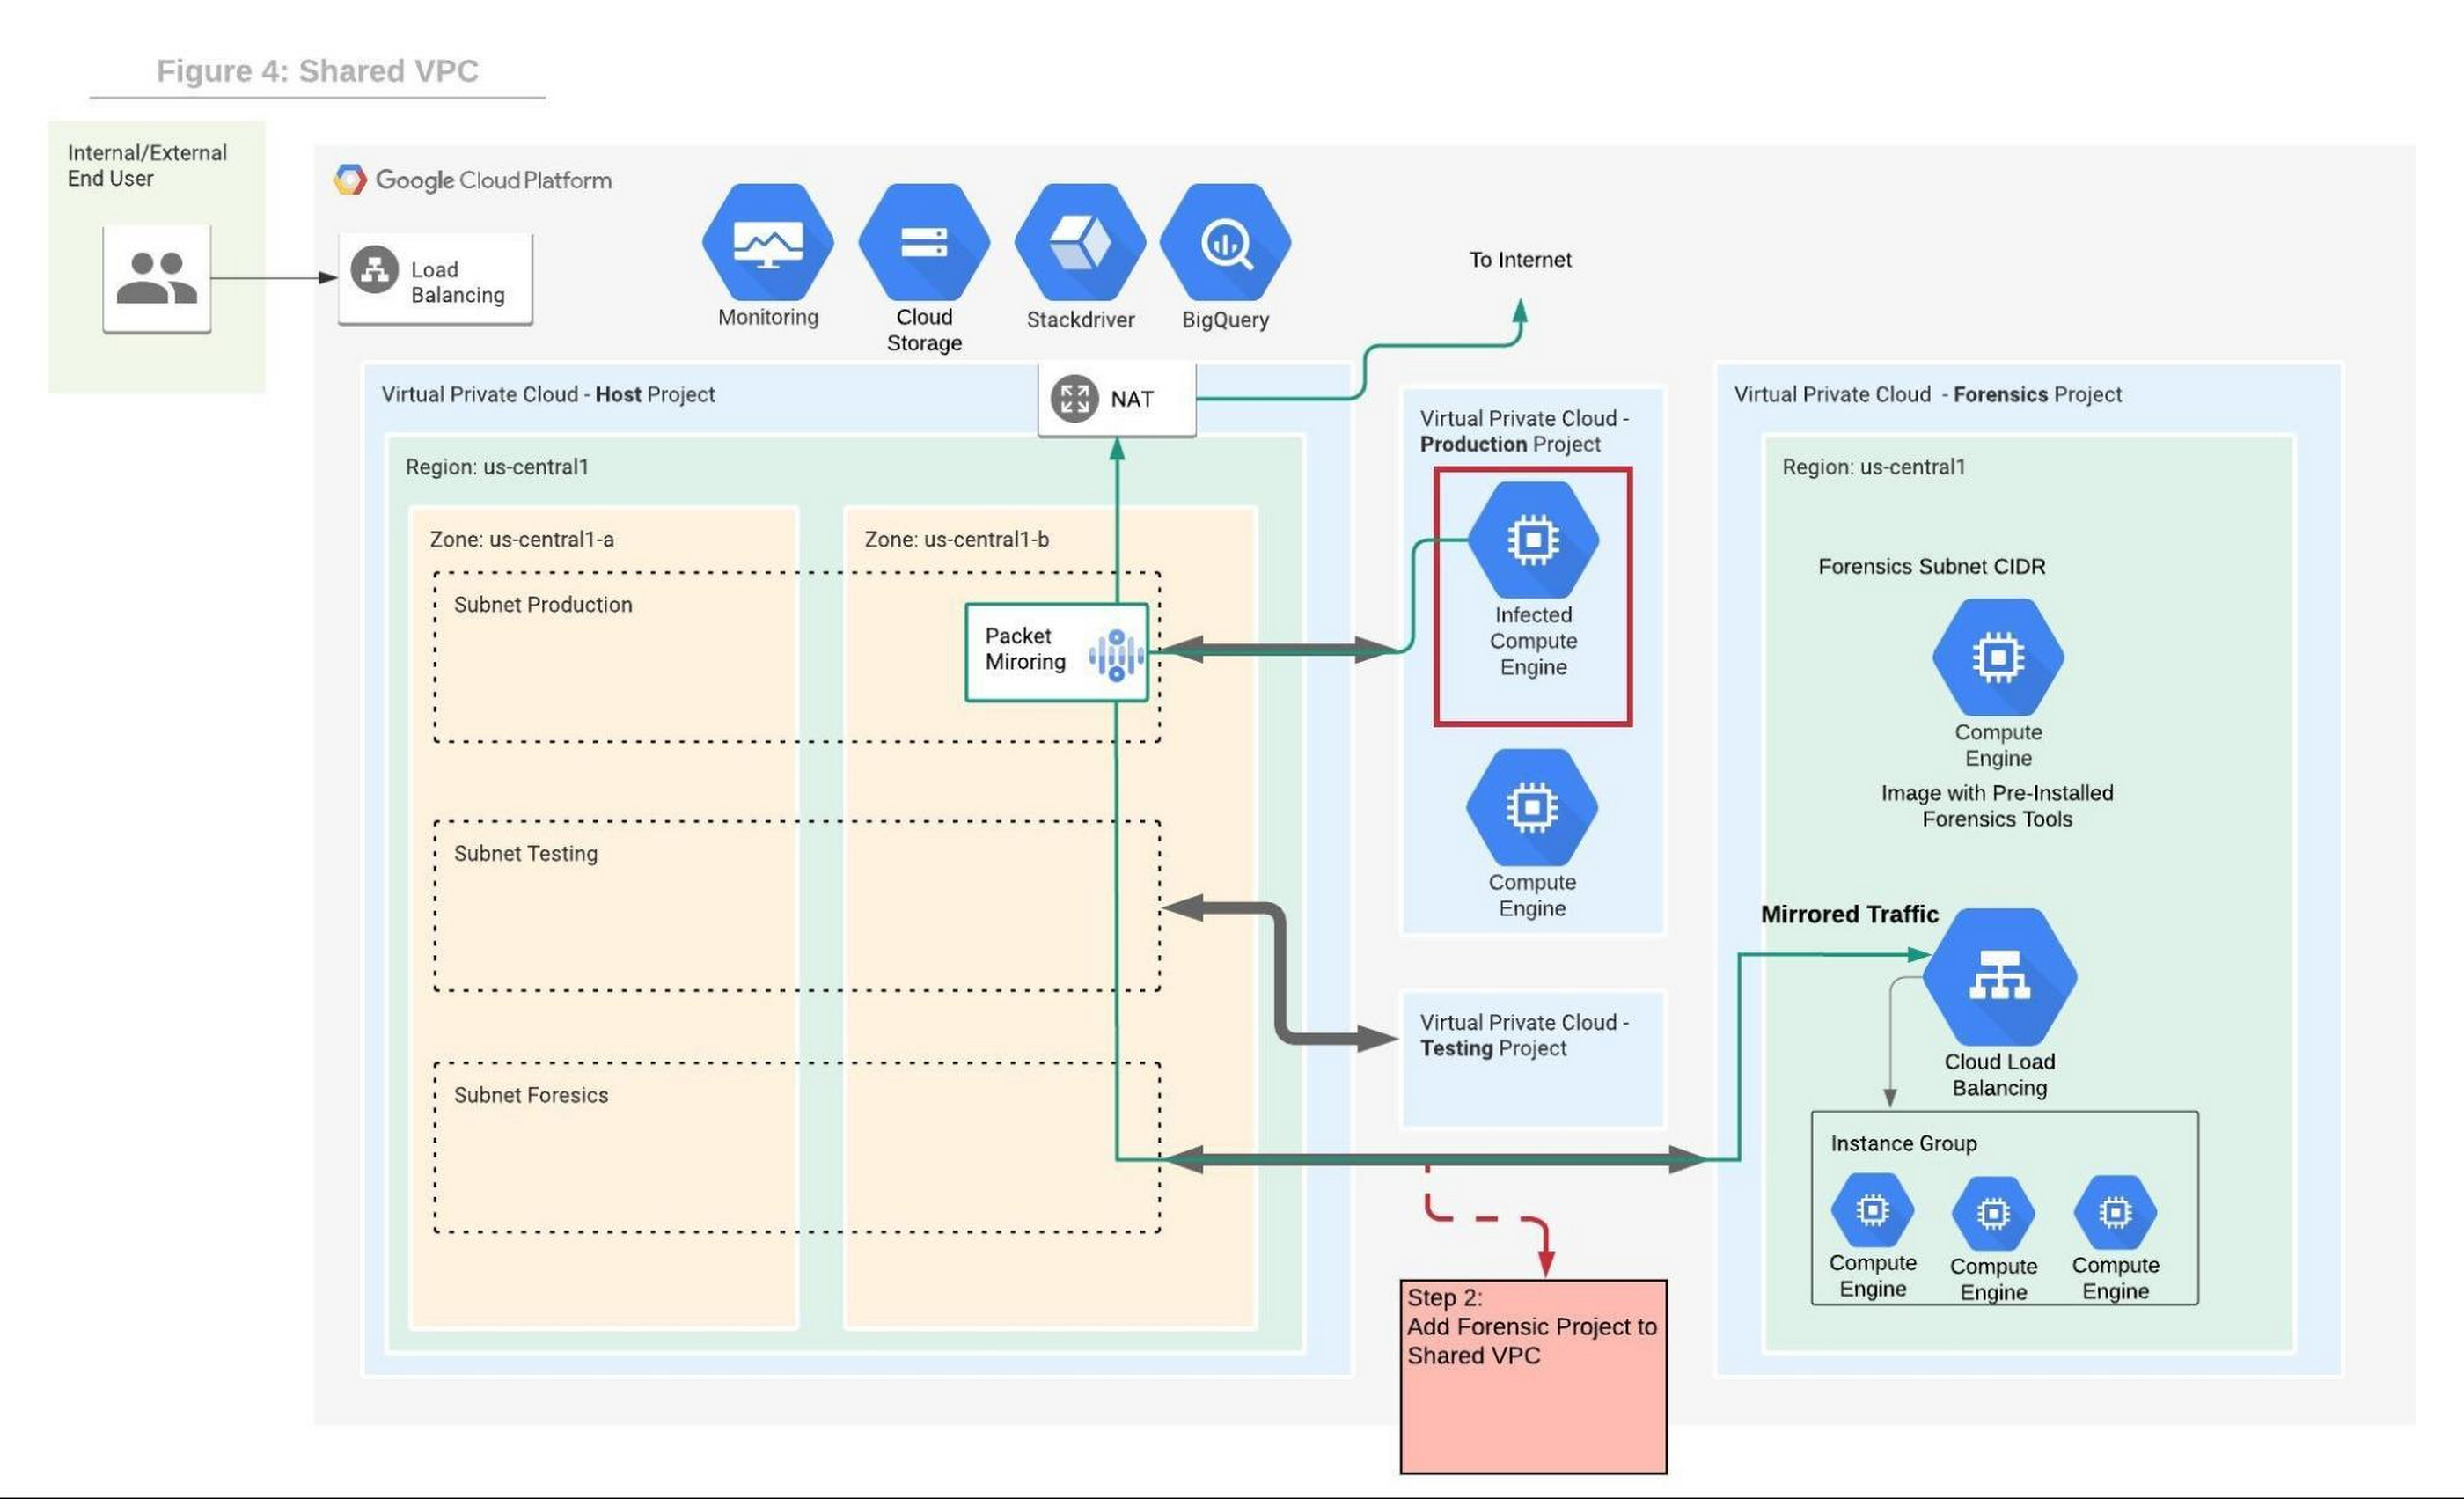
Figure 4 depicts the steps that allow the compromised VM to communicate with the rest of the world while capturing all traffic for investigation in a shared VPC deployment.
We will use the Forensics’ project internal load balancer and the instance group VMs which include packet capture and analysis tools. Note that production and forensics networks must be in the same region. Detailed steps to configure packet mirroring are available on this page.
If you are using a Shared VPC then check the Packet Mirroring configuration for Shared VPC for configuration details. Figure 4 depicts the packet mirroring flow in a shared VPC topology.
It is recommended to automate and periodically test the process to make sure that in case of an incident, the entire setup and Forensics toolchain can be quickly deployed. If after initial investigation a suspicious destination, such as a Command and Control [C&C] Server, has been identified, then the Packet Mirroring policy can be adjusted with a policy filter that only mirrors traffic from that C&C server IP address.
An incident management plan must be in place for companies using cloud services, and this plan should also include the option of using live acquisition when necessary. design and preparation for forensics acquisition allows the company to build the infrastructure that can be deployed and connected to the appropriate VM automatically. The architectures described in this post can help the process of collecting and preserving vital evidence for the forensic process, while the incident response team resolves the incident.
Defining cloud’s future: How autonomic data security can help

2556
Of your peers have already read this article.
1:30 Minutes
The most insightful time you'll spend today!
“Ninety percent of all data today was created in the last two years—that’s 2.5 quintillion bytes of data per day,” according to business data analytics company Domo. That would be a mind-bending statistic, except that it’s already five years old.
As data usage has undergone drastic expansion and changes in the past five years, so have your business needs for data. Technology such as cloud computing and AI have changed how we use data, derive value from data, and glean insights from data. Your organization is no longer just crunching and re-crunching the same data sets. Data moves, shifts, and replicates, as you mingle data sets and gain new value in the process, as we say in our Data Cloud story. All the while, your data resides in—and is being created in—new places.
Data lives in a myriad of locations now and requires access from different locations and mediums, yet many of today’s security models are not geared towards this. In short, your data has fallen out of love with your security model, but attackers have not. So, how do we realign data and security so they are once again in a healthy relationship?
Google Cloud, as a leader in cloud data management and cloud security, is positioned uniquely to define and lead this effort. We’ve identified some challenges around the classic approach to data security and the changes triggered by the near-ubiquity of the cloud. The case is compelling for adopting a modern approach to data security. We contend that the optimal way forward is with autonomic data security.
A relatively new concept, autonomic data security is security that’s been integrated with data throughout its lifecycle. It can make things easier on users by freeing them from defining and redefining myriad rules about who can do what, when, where. It’s an approach that keeps pace with constantly evolving cyberthreats and business changes.
Autonomic data security can help you keep your IT assets more secure and can make your business and IT processes speedier. For example, data sharing with partners and data access decisions simultaneously becomes faster and more secure. This may sound like magic, but in fact relies on a constant willingness to change and adapt to both business changes and threat evolution.

Taking the precepts, concepts, and forward-looking solutions presented in this paper into consideration, we strongly believe that now is the right time to assess where you and your business are when it comes to data security. Cloud also brings an incredible scale of computing. Where gigabytes once roamed, petabytes are now common. This means that many data security approaches, especially the manual ones, are no longer practical.
To prepare for the future of data security, we recommend you challenge your current model and assumptions and ask critical questions, evaluate where you are, and then start to put a plan in place of how you could start incorporating the autonomic data security pillars into your data security model.
There are two sets of questions organizations need to discover the answers to as they start this journey. The first set of questions will help you identify the nature and status of your data, and inform the answers to the second set.
- What data do I have?
- Who owns it?
- Is it sensitive?
- How is it used?
- What is the value in storing the data?
The second set focuses on higher-level problems:
- What is my current approach to data security?
- Where does it fail to support the business and counter the threats?
- Does it support my business?
- Should I consider making a change? And if yes, in what direction?
The path to improved data security starts by asking the right questions. You can read the full Autonomic Data Security paper for a more in-depth exploration here and learn more about the idea in this podcast episode.
Collaboration with Google Cloud: Introducing Cloud Analytics by MITRE Engenuity Center
3023
Of your peers have already read this article.
3:30 Minutes
The most insightful time you'll spend today!
The cybersecurity industry is faced with the tremendous challenge of analyzing growing volumes of security data in a dynamic threat landscape with evolving adversary behaviors. Today’s security data is heterogeneous, including logs and alerts, and often comes from more than one cloud platform. In order to better analyze that data, we’re excited to announce the release of the Cloud Analytics project by the MITRE Engenuity Center for Threat-Informed Defense, and sponsored by Google Cloud and several other industry collaborators.
Since 2021, Google Cloud has partnered with the Center to help level the playing field for everyone in the cybersecurity community by developing open-source security analytics. Earlier this year, we introduced Community Security Analytics (CSA) in collaboration with the Center to provide pre-built and customizable queries to help detect threats to your workloads and to audit your cloud usage. The Cloud Analytics project is designed to complement CSA.
The Cloud Analytics project includes a foundational set of detection analytics for key tactics, techniques and procedures (TTPs) implemented as vendor-agnostic Sigma rules, along with their adversary emulation plans implemented with CALDERA framework. Here’s a overview of Cloud Analytics project, how it complements Google Cloud’s CSA to benefit threat hunters, and how they both embrace Autonomic Security Operations principles like automation and toil reduction (adopted from SRE) in order to advance the state of threat detection development and continuous detection and response (CD/CR).
Both CSA and the Cloud Analytics project are community-driven security analytics resources. You can customize and extend the provided queries, but they take a more do-it-yourself approach—you’re expected to regularly evaluate and tune them to fit your own requirements in terms of threat detection sensitivity and accuracy. For managed threat detection and prevention, check out Security Command Center Premium’s realtime and continuously updated threat detection services including Event Threat Detection, Container Threat Detection, and Virtual Machine Threat Detection. Security Command Center Premium also provides managed misconfiguration and vulnerability detection with Security Health Analytics and Web Security Scanner.
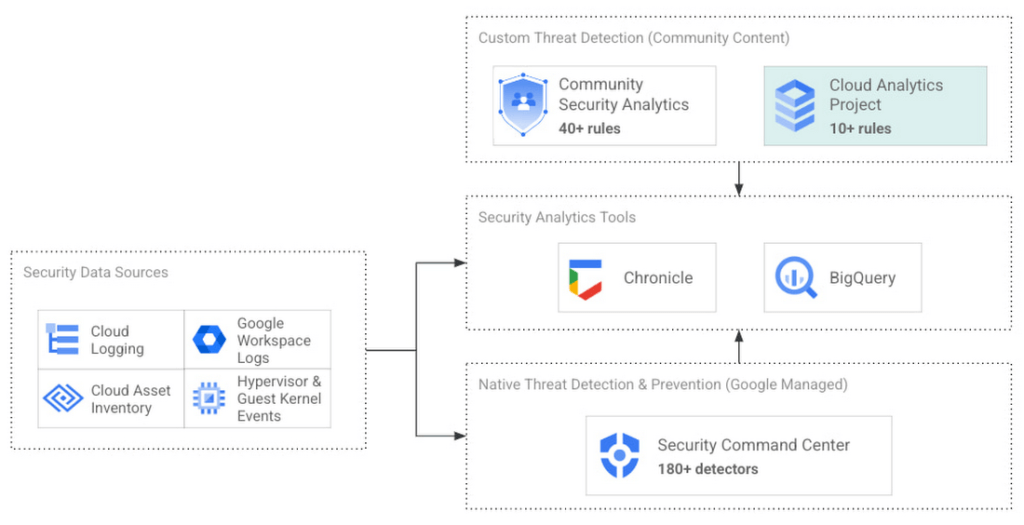
Cloud Analytics vs Community Security Analytics
Similar to CSA, Cloud Analytics can help lower the barrier for threat hunters and detection engineers to create cloud-specific security analytics. Security analytics is complex because it requires:
- Deep knowledge of diverse security signals (logs, alerts) from different cloud providers along with their specific schemas;
- Familiarity with adversary behaviors in cloud environments;
- Ability to emulate such adversarial activity on cloud platforms;
- Achieving high accuracy in threat detection with low false positives, to avoid alert fatigue and overwhelming your SOC team.
The following table summarizes the key differences between Cloud Analytics and CSA:
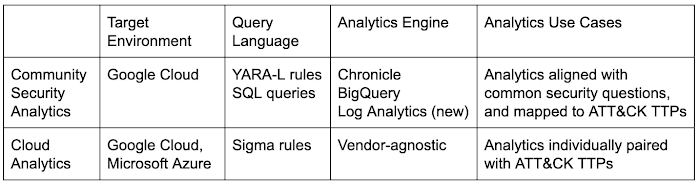
Together, CSA and Cloud Analytics can help you maximize your coverage of the MITRE ATT&CK® framework, while giving you the choice of detection language and analytics engine to use. Given the mapping to TTPs, some of these rules by CSA and Cloud Analytics overlap. However, Cloud Analytics queries are implemented as Sigma rules which can be translated to vendor-specific queries such as Chronicle, Elasticsearch, or Splunk using Sigma CLI or third party-supported uncoder.io, which offers a user interface for query conversion. On the other hand, CSA queries are implemented as YARA-L rules (for Chronicle) and SQL queries (for BigQuery and now Log Analytics). The latter could be manually adapted to specific analytics engines due to the universal nature of SQL
Getting started with Cloud Analytics
To get started with the Cloud Analytics project, head over to the GitHub repo to view the latest set of Sigma rules, the associated adversary emulation plan to automatically trigger these rules, and a development blueprint on how to create new Sigma rules based on lessons learned from this project.
The following is a list of Google Cloud-specific Sigma rules (and their associated TTPs) provided in this initial release; use these as examples to author new ones covering more TTPs.
Sigma rule example
Using the canonical use case of detecting when a storage bucket is modified to be publicly accessible, here’s an example Sigma rule (copied below and redacted for brevity):
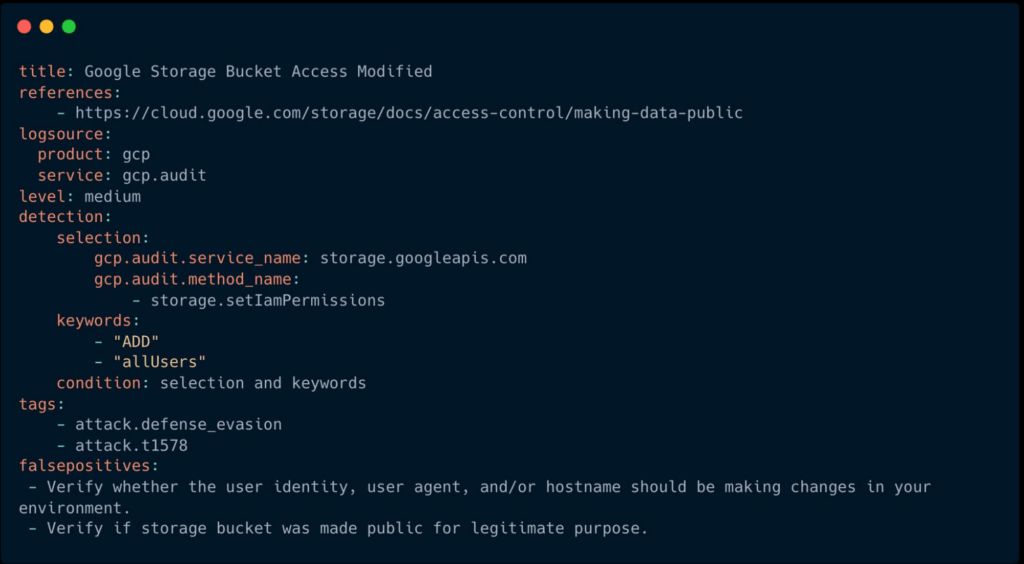
The rule specifies the log source (gcp.audit), the log criteria ( storage.googleapis.com service and storage.setIamPermissions method) and the keywords to look for (allUsers, ADD) signaling that a role was granted to all users over a given bucket. To learn more about Sigma syntax, refer to public Sigma docs.
However, there could still be false positives such as a Cloud Storage bucket made public for a legitimate reason like publishing static assets for a public website. To avoid alert fatigue and reduce toil on your SOC team, you could build more sophisticated detections based on multiple individual Sigma rules using Sigma Correlations.
Using our example, let’s refine the accuracy of this detection by correlating it with another pre-built Sigma rule which detects when a new user identity is added to a privileged group. Such privilege escalation likely occurred before the adversary gained permission to modify access of the Cloud Storage bucket. Cloud Analytics provides an example of such correlation Sigma rule chaining these two separate events.
What’s next
The Cloud Analytics project aims to make cloud-based threat detection development easier while also consolidating collective findings from real-world deployments. In order to scale the development of high-quality threat detections with minimum false positives, CSA and Cloud Analytics promote an agile development approach for building these analytics, where rules are expected to be continuously tuned and evaluated.
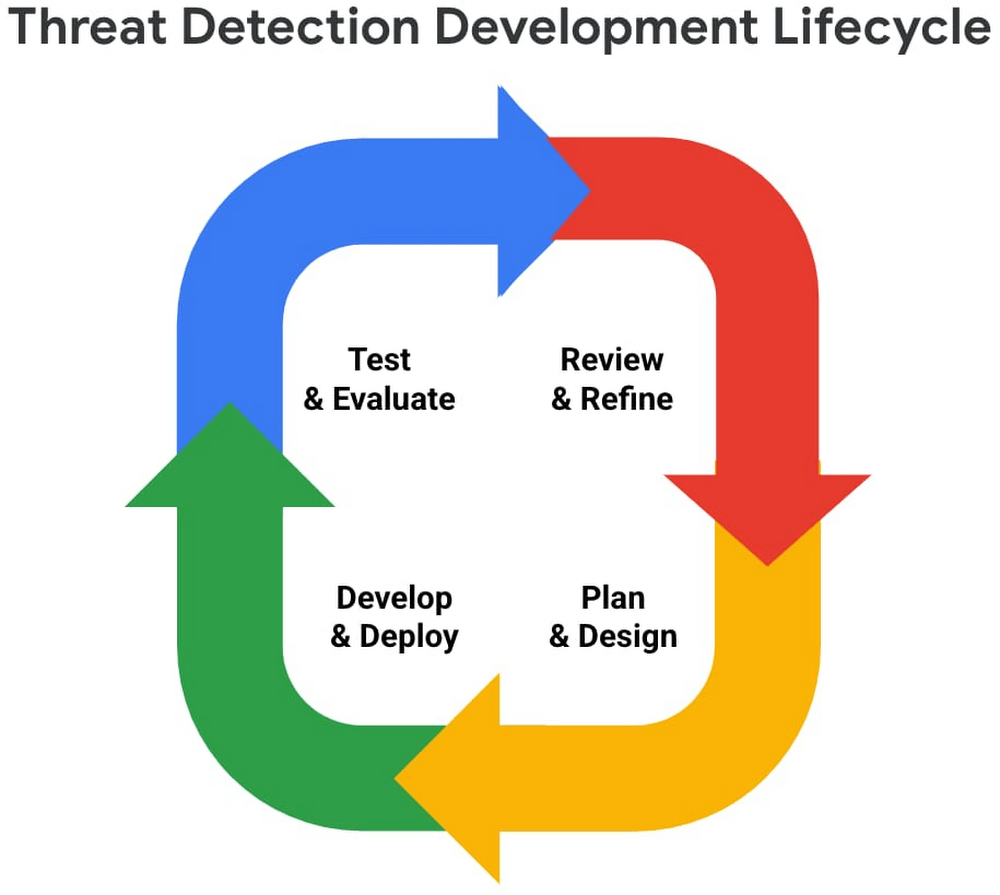
We look forward to wider industry collaboration and community contributions (from rules consumers, designers, builders, and testers) to refine existing rules and develop new ones, along with associated adversary emulations in order to raise the bar for minimum self-service security visibility and analytics for everyone.
Acknowledgements
We’d like to thank our industry partners and acknowledge several individuals across both Google Cloud and the Center for Threat-Informed Defense for making this research project possible:
Desiree Beck, Principal Cyber Operations Engineer, MITRE
Michael Butt, Lead Offensive Security Engineer, MITRE
Iman Ghanizada, Head of Autonomic Security Operations, Google Cloud
Anton Chuvakin, Senior Staff, Office of the CISO, Google Cloud
How to Configure GCP for Live Network Forensics
3039
Of your peers have already read this article.
3:00 Minutes
The most insightful time you'll spend today!
Forensics is the application of science to criminal and civil laws. It is a proven approach for gathering and processing evidence at a crime scene. An integral step in the forensics process is the isolation of the scene without contaminating or modifying the evidence. The isolation step prevents any further contamination or tampering with possible evidence. The same philosophy can be applied to the investigation of digital events.
In this post we will review methods, tactics and architecture designs to isolate an infected VM while still making it accessible to forensic tools. The goal is to allow access so that data and evidence can be captured while protecting other assets. There are many forensic tools for networking that can be used to analyze the captured traffic. This post does not cover these tools but rather how to configure GCP to capture live traffic in the most efficient and secured way. Once traffic is captured, customers can use whatever tools they prefer to run the analysis. More details about these tools and required agents can be found here and details about open source tooling that Google and others are developing are available here.
In cloud security context, when a VM shows signs of compromise, the most common immediate reaction is to take a snapshot, shut down the instance and relocate the image snapshot to an isolated environment, a method known as “dead analysis”. However, shutting down the instance will impede an important step in the investigation and digital forensics, as some important information in a buffer or the RAM may be lost.
The other forensic approach is “live analysis”, in which the VM is kept on and evidence is gathered from the VM directly. Live forensics enables the imaging of RAM, bypasses most hard drives and software encryption, determines the cause of abnormal traffic, and is extremely useful when dealing with active network intrusions. This process is usually performed by forensic analysts. For example, if there is a good chance the malware resides only in memory then live forensics is, in some cases, the only way to capture and analyze the malware. In this method, in addition to disk and memory evidence, a forensic analysis can also capture live-network from data sent over the compromised VM network interfaces. Some of the benefits of collecting live networks are reconstruction and visualizing traffic flow in real-time, in particular during active network intrusions or attacks.
In the cloud, a VM must be isolated when it becomes apparent that an incident has happened, in order to protect other VMs from being infected. Our Cloud Forensics 101 session covers the process and required artifacts, such as logs, that need to be collected for cloud forensics.
What happens when your image is compromised
Let’s now assume that one of the VMs in your infrastructure has been compromised and alarms are coming from products such as GCP’s Cloud Security and Command Center, Chronicle backstory or your SIEM.
An incident response plan consists of 3 phases: preparation (actions taken before an attack), detection (actions taken during an attack) and response (actions taken after an attack). During the detection phase, the Computer Security Incident Response Team (CSIRT) or threat analysts decide whether live acquisition analysis is required. If live forensics is required, for example when it is vital to acquire a VM’s RAM, then one of the first courses of action is to isolate and contain the VM from the rest of the world and connect the Forensics VPC to the VM for investigation. The forensics VPC resides in a forensics GCP project, it includes digital forensics tools to capture evidence from the VM such as SANS Investigative Forensics Toolkit – SIFT, The Sleuth Kit, Autopsy, Encase, FTK and alike. These tools are already installed, configured, tested and ready to use. The forensics project will also save and preserve evidence such as disk and memory images for forensic review.
We’ll cover two scenarios in this post, the first scenario is to isolate the image and connect the forensics VPC to the image for live acquisition.
In the second scenario we will also capture live traffic from the isolated image for live network digital forensics. To capture live traffic from the infected VM, we will leverage the GCP Packet Mirroring service to duplicate all traffic going in and out of the VM and send it to a Forensics VPC for analysis. Network forensics analysis tools such as Palo Alto VM-Series for IDS, ExtraHop Reveal(x), CheckPoint CloudGuard, Arkime (formerly Moloch), Corelight are installed, configured and ready for deployment in the Forensics VPC, these tools will be used to analyze the duplicate network traffic.
Isolating the infected VM from other resources and connecting the forensics VPC
As part of the Incident Response plan preparation phase, the CSIRT created a Google Cloud Forensics Project. Since the Forensics project will be used only when needed, it’s better to automate the creation of the project and its resources with a tool such as Terraform. It is important to grant access to this project only to individuals and groups who deal with incident response and forensics, such as CSIRT. As shown in figure 1, the Forensics project on the right includes its own VPC, non-overlapped subnet and VM images with pre-installed and pre-configured forensics tools. Internal load-balancer and instance-groups are also configured, we will use these resources to capture live traffic, as described later in this post.
In order to contain the spread of any malware or network activity, such as data exfiltration, we’ll isolate the VM with VPC firewall rules. The GCP VPC firewall is a distributed firewall that always enforces its rules, protecting the instances regardless of their configuration and operating systems. In other words, the compromised VM cannot override the firewall enforcement if its policies follow the principle of least privilege . Rules can be applied to all instances in the network, target network tags or service accounts.
Step 1 in the diagram above shows how an infected VM is isolated from the rest of the network by firewall rules that deny any ingress and egress traffic from any CIDR beside the forensics subnet CIDR. The infected VM is tagged with a unique network tag, for example “<image-name>_InfectedVM”, then firewalls rules are applied on the network tag. This ensures that the infected VM is isolated from the project and the Internet while enabling access to the VM via VPC peering which we’ll configure in step-2. You can learn more about VPC firewalls rules here.
In step 2, the VPC from the forensics project is peered with the VPC in the production project. When VPC peering is established routes are exchanged between the VPCs. By default, VPC peering exchanges all subnet routes, however, custom routes can also be filtered if required. At this point, the VM from the forensics project can communicate with the infected VM and start the live forensics analysis job using the pre-installed and pre-configured forensics tools.
Shared VPC is a network construct that allows you to connect resources from multiple projects, called service-projects, to a common VPC in a host-project. VPCs from different projects can securely communicate with each other via the hosted project network while centralizing the network administration. Figure 2 depicts Shared VPC topology, rather than using VPC peering, during step 2 the Forensics project is simply attached to the host project. After the attachment, the Shared VPC allows the forensics tools to communicate with the infected VMs.
Capturing live network traffic with Google Traffic Mirroring
If live network forensics is required, for example during active network intrusions, then the incoming and outgoing traffic needs to be duplicated and captured. While VPC Flow logs capture the networking metadata telemetry, this is not enough for live network forensics analysis. GCP Packet Mirroring clones the traffic of a specified instance in a VPC and forwards it to a specified internal load balancer which collects the mirrored traffic and sends it to an attached instance group. Packet mirroring captures all the traffic from the specified subnet, network tags, or instance name.
Figure 3 depicts the steps that allow the compromised VM to communicate with the rest of the world (for example beaconing with C&C) while capturing all traffic for investigation in a peered VPC deployment.
Figure 4 depicts the steps that allow the compromised VM to communicate with the rest of the world while capturing all traffic for investigation in a shared VPC deployment.
We will use the Forensics’ project internal load balancer and the instance group VMs which include packet capture and analysis tools. Note that production and forensics networks must be in the same region. Detailed steps to configure packet mirroring are available on this page.
If you are using a Shared VPC then check the Packet Mirroring configuration for Shared VPC for configuration details. Figure 4 depicts the packet mirroring flow in a shared VPC topology.
It is recommended to automate and periodically test the process to make sure that in case of an incident, the entire setup and Forensics toolchain can be quickly deployed. If after initial investigation a suspicious destination, such as a Command and Control [C&C] Server, has been identified, then the Packet Mirroring policy can be adjusted with a policy filter that only mirrors traffic from that C&C server IP address.
An incident management plan must be in place for companies using cloud services, and this plan should also include the option of using live acquisition when necessary. design and preparation for forensics acquisition allows the company to build the infrastructure that can be deployed and connected to the appropriate VM automatically. The architectures described in this post can help the process of collecting and preserving vital evidence for the forensic process, while the incident response team resolves the incident.
4889
Of your peers have already watched this video.
4:00 Minutes
The most insightful time you'll spend today!
Application Development with Kpt
Learn how to create and customize configuration packages with Kpt to build applications and adhere to configuration-as-data philosophy.
Stop Cribbing About Shadow IT and Start Taking Charge Now

3653
Of your peers have already read this article.
2:20 Minutes
The most insightful time you'll spend today!
Employees use tools at their disposal to get work done, but if these tools (often legacy) hamper collaboration or are inflexible, they’ll turn to less secure options for the sake of convenience. According to Gartner, a third of successful attacks experienced by enterprises will come from Shadow IT usage by 2020.
And this problem is not unknown. Eighty-three percent of IT professionals reported that employees stored company data in unsanctioned cloud services, a challenge especially apparent with file sync and share tools. When people work around their legacy systems to use tools like Google Drive, it’s often because they find their current systems to be clunky or that they can’t collaborate with others as easily. They’re unable to do three key things in legacy file sync and share systems (like Microsoft SharePoint):
1. Unable to work on their phones. By now, people expect to be able to work on the go—and this means not just opening an attachment, but actually making edits to and comments on work. It gives them freedom to work when it’s convenient for them and to help teammates anytime.
2. Unable to create workspaces independently and easily. This might sound counterintuitive, but if an employee needs to contact IT to have a new project folder made on a drive, the bar is too high. Employees need to be able to quickly, and independently, create documents that can be shared simply because of the changing nature of collaboration. Work happens ad-hoc, on the go (like we mentioned above), and with people inside and outside of your organization. If someone has to contact IT to create a new folder, they’re more likely to neglect the request or use a different tool altogether to get started.
3. Unable to make the data work for them. Traditional file storage is just that, storage. Like an attic, we store things in these systems, but at some point stuff gets stale and it’s hard to tell what we should keep or pitch. People need their storage systems to not only house their data, but to help them categorize and find information quicker so that they can make this data work better for them.
You have two choices when it comes to making a decision on file sync and share systems:
Option 1: Continue to let your employees work on unsanctioned products, some of which may open your business up to unintended security issues (and, in some instances, scary terms of service).
Option 2: Buy the tools that your users want to use because these tools are making them more productive.
If you want to create a more productive workforce, take cues from your employees. Your tools should not only meet the highest security standards for IT, but let people work the way they want to (and be intelligent enough to guide them along the way).
Imagine if your technology could flag that a file contains confidential information before an employee accidentally shares it. Or surface files as they’re needed to help people work faster. Google Drive does this.
Remember, if the technology doesn’t suit your employees, they’re just going to work around it anyway. Instead of investing time and resources on routine maintenance, shift this energy toward helping your employees stay productive in ways that work for both you and them.
More Relevant Stories for Your Company

Three Reasons Why Enterprises Must Think Next-gen Serverless
As we reflect on the past year, Heraclitus' phrase “The only constant in life is change” has never rang more true. With the pandemic, companies had to shift operations, launch new products and adapt to extreme demand patterns, sometimes within a matter of weeks. To respond to customer needs faster


Accelerate Your Digital Transformation Through a Modern Infrastructure
Learn about the latest advancements to Google Cloud Platform’s unique infrastructure to accelerate enterprise workloads and build planet scalable solutions. Hear how Google Cloud’s infrastructure enables you to solve problems faster, more securely, and at greater scale. See how Google Cloud is accelerating the support for enterprise workloads like SAP,

Groupe Dauphinoise Grows it Customer Base with G Suite and Google Cloud Platform
As a leading French agricultural cooperative, Groupe Dauphinoise places collaboration at the heart of its philosophy. Working with farmers in the Rhone-Alpes region, Groupe Dauphinoise takes on a diverse range of activities from agricultural production to research and development to running retail outlets. As its operations expanded and strained its

The Right Datawarehouse Helps Fight Climate Change, While Improving Customer Experience
When you think about climate change, you might not consider a daily commute to work or a drive around town as big contributing factors. And yet, transport is the fastest growing source of CO2 emissions from fossil fuel, which in turn is the largest contributor to climate change. This is the key insight
