





How TeamSnap Improved Return on Ad Spend Significantly

5613
Of your peers have already read this article.
3:30 Minutes
The most insightful time you'll spend today!
Anyone who has ever coached or played on a sports team, or had a child involved in sports, knows how difficult scheduling and logistics can be. From game and practice schedules, to uniforms and who’s bringing the snacks, it can be a lot for coaches, administrators, parents, and players to manage.
It’s no wonder that TeamSnap, a sports team, club, and tournament management app, has exploded in popularity worldwide. By syncing events to everyone’s personal calendars and providing messaging and payment tracking, TeamSnap makes communication and organization easy.
TeamSnap markets its app to coaches, players, and clubs via targeted YouTube ads. It also uses Google AdWords and DoubleClick to advertise on search results and run programmatic campaigns. These methods have been highly effective, helping TeamSnap grow to millions of users worldwide and become one of the most popular apps in the iOS app store.
As its business and data grew, TeamSnap was challenged to track ROI and measure the customer journey across channels and devices over time. The company’s marketing budget grew quickly, making it even more important to spend wisely. With data in Google Analytics 360, DoubleClick Campaign Manager, Google AdWords, and Salesforce, TeamSnap needed a way to link and correlate those data sources in a scalable, timely, and cost-effective way to understand the true impact of its digital marketing across websites and mobile apps.
To avoid the painstaking manual process of pulling data from multiple sources, TeamSnap began using Google Analytics 360, which integrates with Google BigQuery, to provide a fully managed big data analysis service. TeamSnap analyzes the data using Tableau, which connects directly to Google BigQuery for fast analytics and helps the company share and collaborate on that information with self-service ease.
The combination allows TeamSnap to easily track the activity of millions of users with self-service ease, without worrying about the scalability or availability of the big data platform.
“Before Google Analytics 360, Google BigQuery, and Tableau, tracking our return on ad spend was difficult because we had so much data,” says Ken McDonald, Chief Growth Officer at TeamSnap. “We didn’t always have insights to make the best choices. We don’t have that problem anymore because we’ve moved to real-time reporting. We find additional revenue growth opportunities almost daily.”
Making Ad Dollars Work Harder
TeamSnap now automatically imports unsampled Google Analytics 360 logs into the Google BigQuery data warehouse. To import data from other sources such as Google AdWords, DoubleClick, and YouTube, TeamSnap uses Google BigQuery Data Transfer Service. With all relevant data consolidated in Google BigQuery, TeamSnap can use Tableau to perform advanced analytics on its digital marketing, executing ad-hoc analyses in seconds, while eliminating data sampling issues, to improve accuracy. These analyses can also be reused and shared with internal and external stakeholders via Tableau Online, promoting governed reuse and consistency.
“Using Google Analytics 360 and Google BigQuery with Tableau to track our return on ad spend is ideal,” says Ken. “It’s easy to use SQL to query the data or explore it with drag-and-drop ease.”
With Google BigQuery, Ken and his team can bring all the data from the TeamSnap billing systems, internal CRM, and other Google services into one straightforward dataset that everyone uses. With Tableau, users are able to perform self-service analytics on this data and provision analyses via shared dashboards that communicate the same consistent truth across the company. These dashboards provide a single view of the business to discover new patterns and questions worth analyzing.
All of this results in enormous time savings because no one is re-inventing the wheel. “Using these tools, we immediately reallocated $300,000 of ad spend that was performing poorly, generating 200% ROI in the first two days,” says Ken.
Ken now spends his time analyzing data instead of trying to pull it all together, identifying pockets of inefficient spend in real time and reallocating those marketing dollars toward better performing campaigns.
“Before, we could only focus on the largest campaign-level datasets because it was so time consuming to pull the data,” he says. “With Google BigQuery and Tableau, we can examine our advertising ROI much more granularly and reallocate more than $10 million in ad spend annually to grow the company faster and more efficiently.”
More Effective A/B Testing
To make sure it is delivering the best customer experiences, TeamSnap uses Google Optimize to run A/B tests on its website. It uses Google BigQuery and Tableau to verify and supplement these findings by measuring longer-term customer behavior across devices, spanning both web and mobile apps.
By pulling in data from Google Optimize, Google Analytics 360, Salesforce, and in-house billing and CRM systems, and understanding it with Tableau, TeamSnap has increased the accuracy and effectiveness of its A/B testing, gaining a more complete picture of customer onboarding and activity. In some cases, it found that short-term indicators it previously trusted were actually poor predictors of long-term behavior.
“Integration between Google Analytics 360 and Google BigQuery is seamless, giving us much more confidence in our A/B testing,” says Ken. “We’re constantly finding new and interesting ways to use our digital marketing data. Often, making a simple change can increase revenue by hundreds of thousands of dollars a year.”
Improving Product Quality
TeamSnap also uses Google BigQuery and Tableau to improve its own product, tracking customer activity at such a granular level that usability and functionality issues can be exposed and addressed faster. It’s also increasing customer engagement by verifying that potential customers are coming in through the right onboarding path—for example, a coach versus a player, or a consumer versus a club or other sports business. Using A/B testing to make sure customers are routed to the appropriate flow, TeamSnap drove $4 million in additional customer value each year.
“We initially chose Google BigQuery and Tableau to help with marketing, but we realized quickly that they could help us on the product side as well,” says Ken. “Most of the testing we do is about making things better and easier for our customers, and we’re accelerating that process with Google BigQuery and Tableau.”
STAC-M3 Tick History Analytics in Google Cloud Benchmark Results Reveals it is 18X Faster than Previous Version

4766
Of your peers have already read this article.
5:00 Minutes
The most insightful time you'll spend today!
The Securities Technology Analysis Center (STAC®), an organization that improves technology discovery and assessment in the finance industry through dialog and research, recently audited the STAC-M3™ benchmark suite on Google Cloud (SUT ID KDB211210). These enterprise tick-analytics benchmarks assess the ability of a solution stack such as database software, servers, and storage, to perform a variety of I/O-intensive and compute-intensive operations on historical market data.
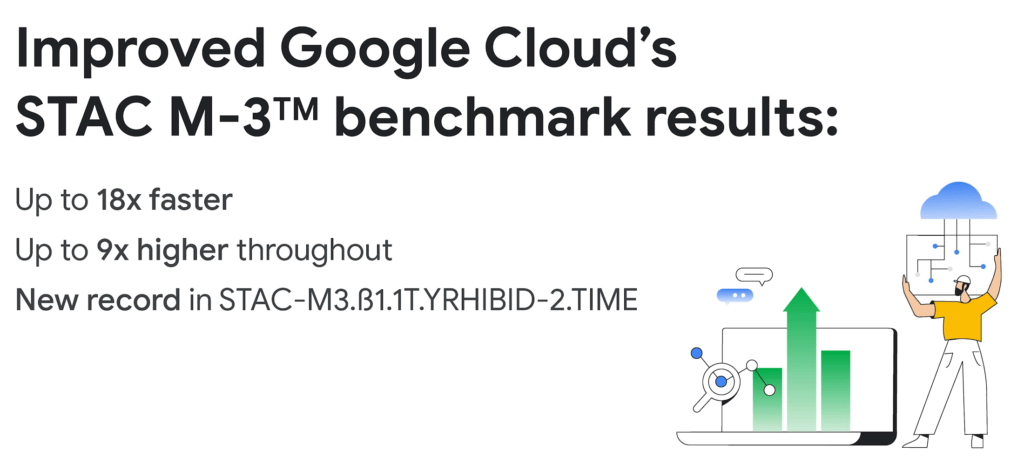
Following up on our previous STAC-M3 benchmark audit (SUT ID KDB181001), a redesigned Google Cloud architecture leveraged the most recent version of kdb+ 4.0, the time-series database from KX, and achieved significant improvements: 35 out of 41 benchmarks ran faster in the new cluster – by up to 18x faster than Google Cloud’s prior results. Key highlights include the following:
Compared to the previous STAC-M3 Antuco suite results on Google Cloud:
- Was faster in 13 of 17 mean response-time benchmarks
- Was 18x faster – a 94% reduction in run time – in the version of Year-High Bid that allows caching (STAC-M3.ß1.1T.YRHIBID-2.TIME), which also set an overall record for all published results
- Had 9x higher throughput in Year-High Bid (STAC-M3.ß1.1T.YRHIBID.MBPS)
Compared to the previous STAC-M3 Kanaga suite results on Google Cloud:
- Was faster in 22 of 24 mean response-time benchmarks
- Was over 10x faster in all four Market Snapshot workloads (STAC-M3.ß1.10T.YR[2,3,4,5]-MKTSNAP.TIME)
- Had 5x the throughput in Year-High Bid involving 2 years of data (STAC-M3.ß1.1T.2YRHIBID.MBPS)
“The STAC-M3 standard was designed by financial firms to reveal the performance of tick analytics stacks. Generational improvements like those exhibited by Google Cloud’s most recent STAC-M3 audit, are important data points for firms evaluating new architectures for performance and scale,” said Peter Nabicht, President of STAC.
These performance results may translate to real-world advantages that may be difficult for investment firms to achieve in static and costly on-premises environments: immediate answers in high data velocity markets, more thoroughly explored research theories by adding data or new quantitative approaches, and reduced costs by releasing cloud resources more quickly.
STAC-M3: High-speed tick analytics
Designing for record-breaking results
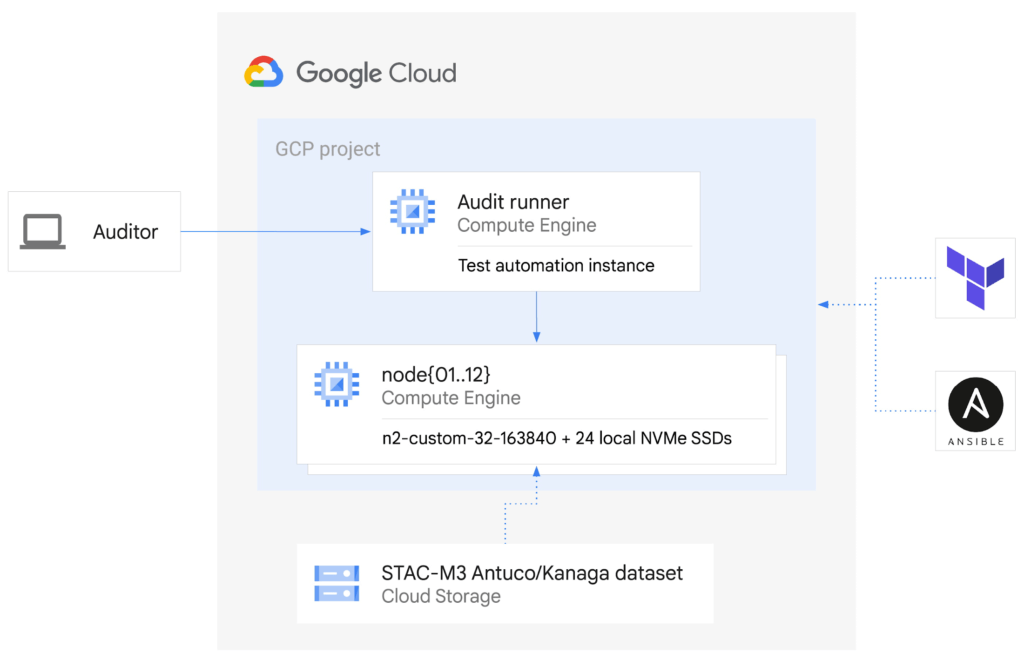
In our STAC-M3 audit, the stack under test (SUT) was designed to take advantage of horizontal scalability in the cloud by sharding data across independent compute nodes. The cluster of 12 Google Compute Engine N2 instances was powered by Intel Cascade Lake, with each node using 32 vCPUs, 160GiB of memory, and 9TiB of local NVMe SSDs. The full STAC-M3 Antuco and Kanaga data set was split across the cluster and kdb+ scripts distributed queries between nodes.
This configuration was the sweet spot for this particular workload, but this architecture does not need to be limited to 12 nodes for other workloads – the data sharding algorithm could scale to any number of nodes as required by workload demands. Since scaling out the cluster in this manner increases the total pool of available storage, this architecture can continue scaling out to petabytes of storage across hundreds of nodes.
The ability to spawn large clusters with hundreds of thousands of processors on demand at low cost, and to delete the resources when jobs complete, not only changes the economics of running computations on large financial data sets, it also opens up opportunities to explore solutions to new types of problems that were previously overlooked due to the constraints of fixed hardware on-premises. You can check the pricing of this VM configuration using the Google Cloud Pricing Calculator. The costs can be reduced even further by using preemptible VMs.
While the new cluster used a similar number of nodes, cores, and total memory as the previously-audited cluster, the redesigned architecture allowed us to harness the low latency and high throughput of Local NVMe SSDs.
Resources on demand
The cluster was created on demand using Terraform and Ansible during testing and auditing. The use of infrastructure as code (IaC) techniques ensured that the cluster, fully loaded with the STAC-M3 data set, could be created when needed and then removed when benchmarking was complete. It also meant that the cluster configuration was enforced by code on each deployment, eliminating configuration variance and drift. The full IaC definition to create the cluster can be retrieved from the report in the STAC Vault.
Each time the cluster was created, data was streamed to Local SSDs from Google Cloud Storage, our reliable and secure object storage, at up to the line rate of 32Gbps per node. The entire 57TiB STAC-M3 Antuco and Kanaga data was replicated from Cloud Storage to local storage in approximately 20 minutes.
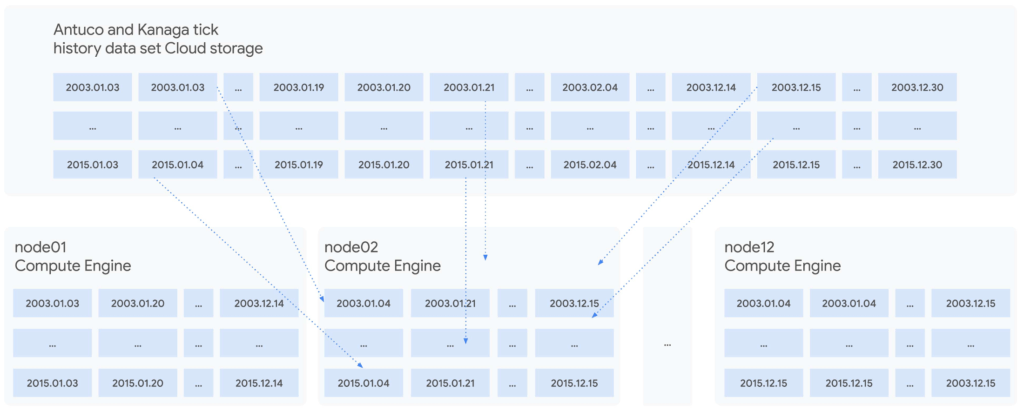
Since each node was independent and responsible for its own shard of data, doubling the cluster size would cut the synchronization time in half, or copy twice as much data in the same amount of time. Using higher bandwidth options of up to 100Gbps would triple the possible throughput for a relatively small incremental cost, trading an approximately 11%-23% price increase at current list prices for a 200% data synchronization performance increase. Taking advantage of fast networking to cache sharded data in parallel to a large cluster makes storing bulk data in Cloud Storage viable for even the largest workloads.
For quants working on vast data sets in sprawling compute clusters, the ability to fully describe infrastructure as declarative code, create elastic resources on demand, cache data quickly from cheap bulk storage, and turn resources off when computations complete is a dramatic change compared to waiting months to grow on-premises clusters – and a compelling reason to use cloud infrastructure.
To see how we designed and optimized the cluster for API-driven cloud resources, read our new whitepaper.
STAC-A2™: Calculating derivatives risk
In 2018, we showed that cloud instances can outperform bare metal when analyzing large tick history data sets in the demanding suite of STAC-M3 benchmarks. Last year, Google Cloud’s partner Appsbroker showed that the same was true for calculating derivatives risk in STAC-A2 on Google Cloud. You can read about how Appsbroker built its record-breaking STAC-A2 compute cluster on Google Cloud in its blog post, or access the STAC Report directly. Here are the highlights:
Compared to all other publicly reported solutions, this solution, based on a cluster of 10 virtual machines, had:
- The highest throughput (STAC-A2.β2.HPORTFOLIO.SPEED)
- The fastest cold time in the large problem size (STAC-A2.β2.GREEKS.10-100k-1260.TIME.COLD)
Compared to a solution involving an 8-node, on-premises cluster (SUT ID INTC181012), this 10-node, cloud-based solution:
- Had 5 times the maximum paths (STAC-A2.β2.GREEKS.MAX_PATHS)
- Had 10% greater throughput (STAC-A2.β2.HPORTFOLIO.SPEED)
- Was 18% faster in cold runs of the large problem size (STAC-A2.β2.GREEKS.10-100k-1260.TIME)
- Was 9% faster in cold runs of the baseline problem size (STAC-A2.β2.GREEKS.TIME.COLD)
Finding market advantages with Google Cloud
Across the investment management industry, every firm is seeking many of the same competitive advantages. However, finding unique opportunities and managing larger and larger data sets is becoming a major strain. Cloud is fundamentally changing how quants tackle the problem while empowering them to manage risk and generate higher returns.
Building on-premises computing clusters with tens or hundreds of thousands of cores and petabytes of storage requires huge up-front investments and lead time measured in months or years. Google Cloud makes the same scale available to its customers, provisioned on demand and paid per use. More importantly, the elasticity of cloud resources enables agility that is simply not available in a fixed data center cluster – the agility to explore, experiment, iterate, and respond to markets faster than before.
Scaling out to tens of thousands of cores in minutes and then removing the resources immediately not only changes the speed at which questions can be answered; it encourages different and more frequent questions, asked simultaneously on many independent clusters, free from the constraints of fixed on-premises hardware.
It is this flexibility and power that enables financial services firms to leverage larger data sets and get results, backtest, research, and analyze large amounts of data, faster and whenever they need it.
Download our whitepaper to learn more about our latest STAC-M3 tick history analytics benchmark results and how to optimize cloud infrastructure for high-speed market data analysis.

5445
Of your peers have already downloaded this article
14:30 Minutes
The most insightful time you'll spend today!
To make great products: do machine learning like the great engineer you are, not like the great machine learning expert you aren’t.
Most of the problems you will face are, in fact, engineering problems. Even with all the resources of a great machine learning expert, most of the gains come from great features, not great machine learning algorithms. So, the basic approach is:
- Make sure your pipeline is solid end to end.
- Start with a reasonable objective.
- Add common-sense features in a simple way.
- Make sure that your pipeline stays solid.
This approach will work well for a long period of time. Diverge from this approach only when there are no more simple tricks to get you any farther. Adding complexity slows future releases.
Once you’ve exhausted the simple tricks, cutting-edge machine learning might indeed be in your future. See the section on Phase III machine learning projects.
This document is arranged as follows:
- The first part should help you understand whether the time is right for building a machine learning system.
- The second part is about deploying your first pipeline.
- The third part is about launching and iterating while adding new features to your pipeline, how to evaluate models and training-serving skew.
- The final part is about what to do when you reach a plateau.
- Afterwards, there is a list of related work and an appendix with some background on the systems commonly used as examples in this document.
6557
Of your peers have already watched this video.
17:00 Minutes
The most insightful time you'll spend today!
Eli Lilly’s Custom-built Translation Service Leverages Google’s Translation Engine
Eli Lilly leverages Google Cloud’s machine translation to globalize content to serve their multilingual employees. Watch the video to learn how the healthcare company built an in-house solution powered by Google Cloud APIs to address the challenge of translating multilingual content at scale. Also explore Google’s innovations and investments into services for language translations produced for machine learning (also called as machine translation or neural machine translation) for safe and secure documents and text translation via an easy-to-use interface and API.
The Right Datawarehouse Helps Fight Climate Change, While Improving Customer Experience

7077
Of your peers have already read this article.
4:30 Minutes
The most insightful time you'll spend today!
When you think about climate change, you might not consider a daily commute to work or a drive around town as big contributing factors. And yet, transport is the fastest growing source of CO2 emissions from fossil fuel, which in turn is the largest contributor to climate change. This is the key insight behind the mission of Spanish carbon-neutral multinational Acciona. The group, which provides sustainable solutions for infrastructure and renewable energy projects across 65 countries, launched an electric scooter sharing service called Acciona Mobility in 2018.
Aiming to contribute to the decarbonization of the transport sector while helping relieve traffic congestion within cities, Acciona Mobility enables users to rent electric scooters powered 100% by energy from renewable sources. Users can find, reserve, and rent the scooters at the tap of their mobile screens via the Acciona Mobility application and pay on the basis of minutes spent riding. The app, which is available free to download online, is also the gateway through which new users can register for the service, which welcomes anyone with a valid driver’s license for motorbikes. After having their right to drive, identity, and card details validated, citizens can start enjoying the service, available 24 hours a day, every day of the year.
“We needed to deploy a reliable infrastructure for a new service before understanding exactly what its scale and demand would be. Our strategy was to adopt a serverless architecture that can grow with us to sustain our long-term vision. This kind of thinking led us directly to Google Cloud.”
—Jose Luis Rosell, CIO Services Division, Acciona
“Acciona Mobility is exciting because it stems from our vision to make people’s lives easier in a sustainable way,” says Jose Luis Rosell, CIO of Acciona’s Services Division. “40% of the pollution near cities comes from private transportation. We want to help solve that problem with zero-carbon, electric, multimodal transportation that’s also convenient for people to use.”
However, Jose Luis says that building the appropriate IT infrastructure to bring the new service to life required external support. “We needed to deploy a reliable infrastructure for a new service before understanding exactly what its scale and demand would be. Our strategy was to adopt a serverless architecture that can grow with us to sustain our long-term vision,” he explains. “This kind of thinking led us directly to Google Cloud.”
Developing the transportation platform of the future
Because Acciona was already a Google Cloud customer, Jose Luis and his team reached the decision to develop the new service on Google Cloud with ease, as he explains: “We had a very positive experience working closely with the Google Cloud team during Acciona’s first project on Google Cloud, and that collaborative mentality is very important for us. We feel Google Cloud is a trustworthy partner that is willing to take risks with us and is flexible enough to lead us through business uncertainty with the right technology,” he says. “So we were confident that its technology and people could help us bring the Acciona Mobility service from theory to reality.”
This time, Acciona partnered with cloud consultancy Altostratus as well, to consult on a selection of Google Cloud products that would help develop the application quickly by making use of managed services. Acciona’s strategy was to launch the new services first in Madrid, where the company is headquartered, and then spread the vision across more cities later, if the idea worked out well in practice. Due to the scale of the project and its data needs, BigQuery was chosen as the primary data warehouse to store all the information related to the service, such as the location of scooters and their availability status. With all its data readily available on BigQuery, Acciona is able to run specific queries that help it to gain insights such as which urban areas have the highest volume of scooters being rented. Knowing this, Acciona can reorganize availability to make sure there are always enough scooters in that specific location.
Integrating it with Pub/Sub and Dataflow, Acciona ensures that the data generated by scooters is ingested and processed in real time so that users searching for scooters nearby, using the Acciona Mobility application on their phones, can always have up-to-date information at hand. Using Google Maps Platform APIs such as the Directions API, Acciona’s mobile app translates the geographical coordinates of scooters into an easy-to-read address displayed beside a visual map. Using Cloud SQL, Acciona automates the storage capacity management of the database as the number of scooters and active users grow.
Meanwhile, Google Cloud Armor protects the service against cyber breaches and distributed denial of service attacks to keep it running uninterrupted. In addition, Google Cloud itself helps to reinforce the cyber security measures with secure-by-default managed services, such as data encryption. “The managed services mean more resilience and more uptime, because we don’t need to worry about maintenance or external threats,“ says Jose Luis of the solutions protecting all information generated by the new service, which as CIO is a topic he holds dearly. “I face cybersecurity issues more confidently as a Google Cloud partner,” he adds.
“Today, we have data coming in every 15 seconds from 10,000 electric scooters around Europe. BigQuery and Cloud SQL-managed services help us handle that data very carefully and with precision so that our users don’t experience any lags when searching for scooters or returning them.”
—Jose Luis Rosell, CIO Services Division, Acciona
Expanding an 100% sustainable transport solution throughout Spain
Within two months of the decision to deploy Acciona Mobility on Google Cloud, the service was ready for launch, filling the streets of Madrid with 500 electric scooters that run 100% on renewable energy. By 2020, the number of scooters has grown to 10,000 and the service has scaled to multiple cities in and outside of Spain, including Lisbon, Milan, and Rome. To date, more than 3.5 million intracity rides have used the Acciona Mobility app, reducing CO2 emissions by more than 1,000 tons.
“Today, we have data coming in every 15 seconds from 10,000 electric scooters around Europe. BigQuery and Cloud SQL-managed services help us handle that data very carefully and with precision so that our users don’t experience any lags when searching for scooters or returning them,” says Jose Luis of the fast-growing scale of the project.
“Google Cloud enables us to keep our services always available and to scale quickly to respond to its growing demand. Our ratings have been very positive as a result. More importantly, our vision of transportation as a cleaner, more sustainable commodity is really spreading and resonating with the public.”
—Jose Luis Rosell, CIO Services Division, Acciona
Set to continue expanding, Acciona is using Google Kubernetes Engine to make sure the Acciona Mobility application has the computing capacity it needs to continue scaling to reach new markets and serve more users. On that note, Google operations tools (formerly Stackdriver) are also being deployed to help monitor, troubleshoot, and improve the performance of the application as it scales.
“Google Cloud enables us to keep our services always available and to scale quickly to respond to its growing demand. Our ratings have been very positive as a result. More importantly, our vision of transportation as a cleaner, more sustainable commodity is really spreading and resonating with the public,” he concludes.
2877
Of your peers have already watched this video.
26:30 Minutes
The most insightful time you'll spend today!
How to Build a Data Pipeline Across Hybrid and Multi-region Infrastructures
Building a data pipeline on Google Cloud is one of the most common things enterprises do. Increasingly, organizations want to build these data pipelines across hybrid infrastructures.
Using Apache Kafka as a way to stream data across hybrid and multi-region infrastructures is a common pattern to create a consistent data fabric. Using Kafka and Confluent allows customers to integrate legacy systems and Google services like BigQuery and Dataflow in real time.
Learn how to build a robust, extensible data pipeline starting on-premises by streaming data from legacy systems into Kafka using the Kafka Connect framework.
This session highlights how to easily replicate streaming data from an on-premises Kafka cluster to Google Cloud Kafka cluster. Doing this integrates legacy applications and analytics in the cloud, using different Google services like AI Platform, AutoML, and BigQuery.
More Relevant Stories for Your Company

Leverage the Power of Looker to Extract Data Value at Web Scale
Data science can be applied to business problems to improve practices and help to strengthen customer satisfaction. In this blog, we address how the addition of Looker extends the value of your Google Cloud investments to help you understand your customer journey, unlock value from first-party data, and optimize existing




Quick Demo: How to Push Data to PubSub, Dataflow, and BigQuery to Improve Customer Experience
How can you use big data to raise your business' customer experience levels? It’s a question many organizations ask themselves. Some of the more forward-looking ones already know which data points can be leveraged—they just don’t know how to put together the different pieces of the big data puzzle together.

Data Leaders in 2021 and Beyond: How to Prepare
As technologies and workplace environments are quickly evolving, how people and businesses leverage data in their day-to-day workflow is also changing. Data leaders are an emerging force navigating and charting pathways forward towards new horizons for how people and organizations experience data. In this presentation, Pedro Arellano, Product Marketing Director,

Blue Apron: Offering a better recipe for modern analytics
When Blue Apron had issues running its data warehouse on another cloud provider, it built an analytics platform using Looker and Google BigQuery to enable faster business decisions about food inventory. Google Cloud Results Enables near real-time business decisions to better manage food inventory and delivery by reducing query times
