





How One Company Improved Security Significantly–Without Increasing Staff

6440
Of your peers have already read this article.
2:45 Minutes
The most insightful time you'll spend today!
Quanta Services is the leading specialty contractor with the largest and highly-skilled trained workforce in North America. It provides fully-integrated solutions for the electric power
pipeline industrial and telecommunications industries the company’s geographic footprint which includes North America Latin America and Australia.
It’s network of companies ensures world-class execution with local delivery and has over 40,000 employees.
“The exciting thing about Backstory is it allows us to land massive amounts of data from all of our different security tools and then Chronicle worries about how to correlate and aggregate this information for us. We can then focus on the highest priority threats.”
Richard Breaux, Manager Security Operations Quanta Services
Because Quanta Services’ customers provide energy and telecommunications to their customers, they have world-class cybersecurity requirements.
“We must ensure that Quanta leads the industry given the fact that our business is building the core infrastructure that powers people’s lives. It’s crucial that we meet their cybersecurity requirements,” says James Stinson, VP-IT, Quanta Services.
To support this goal Quanta implemented a number of security tools that generate terabytes of security telemetry. Over time, however, these systems generated an information overload for the company’s limited pool of qualified security resources.
“Our logging tools also couldn’t keep up with the rapidly growing information. With limited resources we need to focus our security analysts time on high quality work instead of digging through mountains of data,” says Stinson.
They achieve this by implementing Backstory and Chronicle, which is on Google Cloud.
“The exciting thing about Backstory is it allows us to land massive amounts of data from all of our different security tools and then Chronicle worries about how to correlate and aggregate this information for us. We can then focus on the highest priority threats,” says Richard Breaux, Manager Security Operations Quanta Services.
As a result, the company’s security team spends less time getting to the core information they need to address these incidents.
“What used to take us 15 minutes or more, we can now accomplish in seconds,” says Breaux.
Google Cloud Migration Speeds Up The New York Times’ Journey to New Normal
5783
Of your peers have already read this article.
2:30 Minutes
The most insightful time you'll spend today!
Like virtually every business across the globe, The New York Times had to quickly adapt to the challenges of the coronavirus pandemic last year. Fortunately, our data system with Google Cloud positioned us to perform quickly and efficiently in the new normal.
How we use data
We have an end-to-end type of data platform; on one side we work very closely with our product teams to collect the right level of data that they’re interested in, such as which articles people are reading, and how long they’re staying onsite. We frequently measure our audience to understand our user segments, and how they come onsite or use our apps. We then provide that data to analysts for end-to-end analytics.
On the other side, the newsroom is also focused on audience, and we build tools to help them understand how Google Search or different social promotions play a role in a person’s decision to read The New York Times, and also to get a better sense of their behavior on our pages. With this data, the newsroom can make decisions about information that should be displayed on our homepage or in push notifications.
Ultimately, we’re interested in behavioral analytics—how people engage with our site and our apps. We want to understand different behavioral patterns, and which factors or features will encourage users to register and subscribe with us.
We also use data to create or curate preferences around personalization, to ensure we’re delivering to our users fresh content, or content that they may not have normally read. Likewise, our data also gets used in our targeting system, so that we can send out the right messaging about our various subscription packages to the right users.
Choosing to migrate to Google Cloud
When I came to The New York Times over five years ago, our data architecture was not working for us. Our infrastructure was gathering data that proved harder for analysts to crunch on a daily basis. We were also hitting hang ups with how that data was streaming into our system and environment. Back then we’d run a query and then go grab some coffee, hoping that the query would finish or give us the right data by the time we came back to our desks. Sometimes it would, sometimes it wouldn’t.
We realized that Hadoop was definitely not going to be the on-premises solution for us, and that’s when we started talking with the Google Cloud team. We began our digital transformation with a migration to BigQuery, their fully managed, serverless database warehouse. We were under a pretty aggressive migration timeline, focusing first on moving over analytics. We made sure our analysts got a top-of-the-line system that treated them the way that they themselves would want to treat the data.
One significant prominent requirement in our data architecture choice was to enable analysts to be able to work as quickly as they needed to provide high-quality deliverables for their business partners. For our analysts, the transition to BigQuery was night and day. I still remember when my manager ran his very first query on BigQuery and was ready to go grab his coffee, but the query finished by the time he got up from his chair. Our analysts talk about that to this day.
While we were doing the BigQuery transition, we did have concerns about our other systems not scaling correctly. Two years ago, we weren’t sure we’d be able to scale up to the audience we expected on that election day. We were able to band-aid a solution back then, but we knew we only had two more years to figure out a real, dependable solution.
During that time, we moved our streaming pipeline over to Google Cloud, primarily using App Engine, which has been a flexible environment that enabled quick scaling changes and requirements as needed. Dataflow and Pub/Sub also played significant roles in managing the data. In Q4 of 2020 we had our most significant traffic ever recorded, at 273 million global readers, and four straight days of the highest traffic we’ve had compared to other election weeks. We were proud to see that there was no data loss.
A couple of years ago, on our legacy system, I was up until three in the morning one night trying to keep data running for their needs. This year, for election night, I relaxed and ate a pint of ice cream because I was able to more easily manage our data environment, allowing us to set and meet higher expectations for data ingestion, analysis and insight among our partners in the newsroom.
How COVID-19 changed our 2020 roadmap
The coronavirus pandemic definitely wasn’t on my team’s roadmap for 2020, and it’s important to mention here that The New York Times is not fundamentally a data company. Our job is to get the news out to our users every single day in paper, on apps, and onsite. Our newsroom didn’t expect the need to build out a giant coronavirus database that would enrich the news they share every day.
Our newsroom moves quickly, and our engineers have built one of the most comprehensive datasets on COVID-19 in the U.S. With Google, The New York Times decided to make our data publicly available on BigQuery Google’s COVID-19 public dataset. Check out this webinar for more details on our evolution architecture:https://www.youtube.com/embed/mtNlrFpschU?enablejsapi=1&
Flexible approach
We have many different teams that work within Google Cloud, and they’ve been able to pick from the range of available services and tailor project requirements keeping those tools available in mind.
One challenge we think about with the data platform at The New York Times is determining the priorities of what we build. Our ability to engage with product teams at Google though the Data Analytics Customer Council allows us to see into the BigQuery roadmap, or the data analytics roadmap, and plays a significant role in determining where we focus our own development. For example, we’ve built tools like our Data Reporting API, which reads data directly from BigQuery, in order to take advantage of tools like BigQuery BI Engine. This approach encourages our analysts to be better managers of their domains around dimensions and metrics, but not have to focus on building caching mechanisms of their data. Getting that kind of clarity helps us plan how to build The New York Times in the new normal and beyond.
If you are interested to learn more about the data teams at the New York Times, take a look at our open tech roles here and you’ll find many interesting articles at NYT data blog.
BigQuery’s User-friendly SQL is Like a Cool Drink for Hot Summer

5668
Of your peers have already read this article.
2:30 Minutes
The most insightful time you'll spend today!
With summer just around the corner, things are really heating up. But you’re in luck because this month BigQuery is supplying a cooler full of ice cold refreshments with this release of user-friendly SQL capabilities.
We are pleased to announce three categories of BigQuery user-friendly SQL launches: Powerful Analytics Features, Flexible Schema Handling, and New Geospatial Tools.
Powerful Analytics Features
These powerful SQL analytics features provide greater flexibility to analysts for organizing, filtering, and rendering data in BigQuery than ever before. You can enable spreadsheet-like functionality on summarized data using PIVOT and UNPIVOT and filter irrelevant data in analytic functions using QUALIFY.
Through this section, we will become familiar with these new features through examples using the BigQuery Public dataset, usa_names.
PIVOT/UNPIVOT (Preview)
One of the most time-consuming tasks for data analytics practitioners is wrangling data into the right shape. SQL is great for wrangling data, but sometimes you want to reformat a table as you would in a spreadsheet, pivoting rows and columns interchangeably. To support this use case, we are pleased to introduce PIVOT and UNPIVOT operators in BigQuery. PIVOT creates columns from unique values in rows by aggregating values, and UNPIVOT reverses this action.The example below uses PIVOT on bigquery-public-data.usa_names.usa_1910_current to show the number of males and females born each year, representing each gender as a column. Then UNPIVOT reverses this action.
Language: SQL
-- we start with SQL to create a simple table-- we only include gender, year, and number.CREATE TABLEmydataset.sampletable1 AS (SELECTGender,Year,SUM(Number) AS NumberFROM`bigquery-public-data.usa_names.usa_1910_current`WHEREYear >= 2017GROUP BYGender, Year);-- The resulting table:--+----------------------------------------+--| Gender | Year | Number |--+----------------------------------------+--| F | 2019 | 1353716 |--| F | 2017 | 1403989 |--| F | 2018 | 1380382 |--| M | 2018 | 1568678 |--| M | 2019 | 1538056 |--| M | 2017 | 1604609 |--+----------------------------------------+-- use PIVOT to create columns for “female” and “male”CREATE TABLEmydataset.Pivoted ASSELECTyear, male, femaleFROMmydataset.sampletable1PIVOT( SUM(Number) FOR gender IN ('M' AS male,'F' AS female))ORDER BYyear;-- The resulting pivoted table:--+----------------------------------------+--| Year | female | male |--+----------------------------------------+--| 2017 | 1403989 | 1604609 |--| 2018 | 1380382 | 1568678 |--| 2019 | 1353716 | 1538056 |--+----------------------------------------+-- UNPIVOT reverses the row/column rotation of PIVOT.SELECT*FROMmydataset.PivotedUNPIVOT(number FOR gender IN (male AS 'M',female AS 'F'));
QUALIFY (Preview)
More advanced users of SQL know the power of analytic functions (aka window functions). These functions compute values over a group of rows, returning a single result for each row. For example, customers use analytic functions to compute a grand total, subtotal, moving average, rank, and more. With the announcement of support for QUALIFY, BigQuery users can now filter on the results of analytic functions by using the QUALIFY clause.
QUALIFY belongs in the family of query clauses used for filtering along with WHERE and HAVING. The WHERE clause is used to filter individual rows in a query. The HAVING clause is used to filter aggregate rows in a result set after aggregate functions and GROUP BY clauses. The QUALIFY clause is used to filter results of analytic functions.
To show the utility of QUALIFY, the example below uses QUALIFY to return the top 3 female names from each year in the last decade using from bigquery-public-data.usa_names.usa_1910_current.
Language: SQL
-- QUALIFY filters the result of the RANK functionSELECTname,year,SUM(number) AS total,RANK() OVER (PARTITION BY yearORDER BY SUM(number) DESC) AS rankFROM`bigquery-public-data.usa_names.usa_1910_current`WHEREgender = 'F'AND YEAR >= 2010GROUP BY 1,2QUALIFY RANK <= 3ORDER BY 2,4;
Flexible Schema Handling
New SQL for administrators and data engineers enables table renaming for data pipeline processes, as well as flexible column management.
Table Rename (GA)
In data pipeline processes, tables are often created and then renamed so that they can make way for the next iteration of the pipeline run. To accomplish this, customers need a mechanism by which they can create a table and then subsequently rename it. Now if customers want to change this name using SQL, they can. Using the simple syntax that ALTER TABLE RENAME TO provides, customers will be able to rename a table after creation to clear the way for the next iteration of tables in the data pipeline.
Language: SQL
-- create a sample table “tablename” in “mydataset”.-- You will rename this table.CREATE OR REPLACE TABLE dataset.tablename(col1 STRING,col2 NUMERIC);-- if this table “tablename” becomes obsolete-- perform Table Rename to “obsoletetable”ALTER TABLEmydataset.name RENAME TO obsoletetable;
DROP NOT NULL constraints on a column (GA)
While BigQuery has historically provided many tools available in the UI, CLI and APIs, we know that many administrators prefer interfacing with the database using SQL. BigQuery recently released DDL statements which enable data administrators to provision and manage datasets and tables, greatly simplifying provisioning and management. Today, we continue the next addition in this line of releases by announcing ALTER COLUMN DROP NOT NULL constraint on a column:
- ALTER COLUMN DROP NOT NULL allows the administrator to remove the NOT NULL constraint from a column in BigQuery.
Language: SQL
-- create a table to store credit card numbers-- the business requires this field, so-- include a NOT NULL constraintCREATE TABLEmydataset.customers(credit_card_number STRING NOT NULL);-- if needs of the business no longer require this field,-- the customer can allow null entries in this column-- by dropping the constraintALTER TABLEmydataset.customersALTER COLUMN credit_card_number DROP NOT NULL;
CREATE VIEW with column list (GA)
Views are used ubiquitously by BigQuery customers to capture business logic. Oftentimes, BigQuery users have business requirements to assign aliases to columns in views. Now BigQuery supports doing so upon view creation in a column name list format with the release of CREATE VIEW with column list syntax.
Language: SQL
-- aliases list1 and list2 can be assigned in a list formatCREATE VIEWmyview (list1, list2) ASSELECTcolumn_1, column_2FROMmydataset.exampletable
New Geospatial Tools
ST_POINTN, ST_STARTPOINT, and ST_ENDPOINT
Geospatial data is incredibly valuable to data analytics customers dealing with data from the physical world. BigQuery has very strong geospatial function support to help customers process marketing data, track storms, or manage self-driving cars. Particularly for analyzing vehicle or location tracking data, we’re thrilled to provide three new functions to allow users to easily extract or filter on key points:
For example, when working with vehicle histories, ST_POINTN, ST_STARTPOINT, and ST_ENDPOINT allow users to extract elements such as the start and the end of a trip. For identifying origin-destination pairs these functions will make that task much easier.
Language: SQL
-- pull the first, second, penultimate and final points-- from a linestringWITH linestring as (SELECT ST_GeogFromText('linestring(1 1, 2 1, 3 2, 3 3)') g)SELECTST_StartPoint(g) AS first, ST_EndPoint(g) AS last,ST_PointN(g,2) AS second, ST_PointN(g, -2) as second_to_lastFROMlinestring+--------------+--------------+--------------+----------------+| first | last | second | second_to_last |+--------------+--------------+--------------+----------------+| POINT(1 1) | POINT(3 3) | POINT(2 1) | POINT(3 2) |+--------------+--------------+--------------+----------------+
As sure as a hot summer day pairs well with an ice-cold beverage, these new user-friendly SQL features in BigQuery pair well with your data analytics workflows. To learn more about BigQuery, visit our website, and get started immediately with the free BigQuery Sandbox.
Three Typical Connectivity Use Cases to Pick the Right Option for Your Enterprise

3297
Of your peers have already read this article.
3:00 Minutes
The most insightful time you'll spend today!
Enterprises today have a very broad mix of networks — from SD-WANs, dedicated WANs such as MPLS, cloud interconnects, to VPNs. At the same time, they’re moving those WANs to the cloud to take advantage of faster turn-up, lower cost, and increased feature velocity. As workloads migrate to the cloud and multi-cloud environments, we believe that it’s critical to simplify enterprises’ networking model.
Each major cloud provider uses distinct abstraction models to configure networks or connections between your resources. Some use gateways, some use connections or links. Network Connectivity Center, launched last year, provides a simple management solution for your network connection, and is now Generally Available.
In this post, we outline the typical connectivity use cases for customers to help you select and set up the best connectivity option for your environment.
Understanding cloud network connectivity
Cloud networking refers to the ability to connect two resources together inside a cloud, across clouds and with on-premises data centers. A cloud provider needs to provide three main types of connectivity:
- Site-to-cloud – Between on-premises equipment and cloud resources
- Site-to-site – To connect on-premises resources together
- VPC-to-VPC – Connectivity between cloud resources
- Let’s take a look at each one.
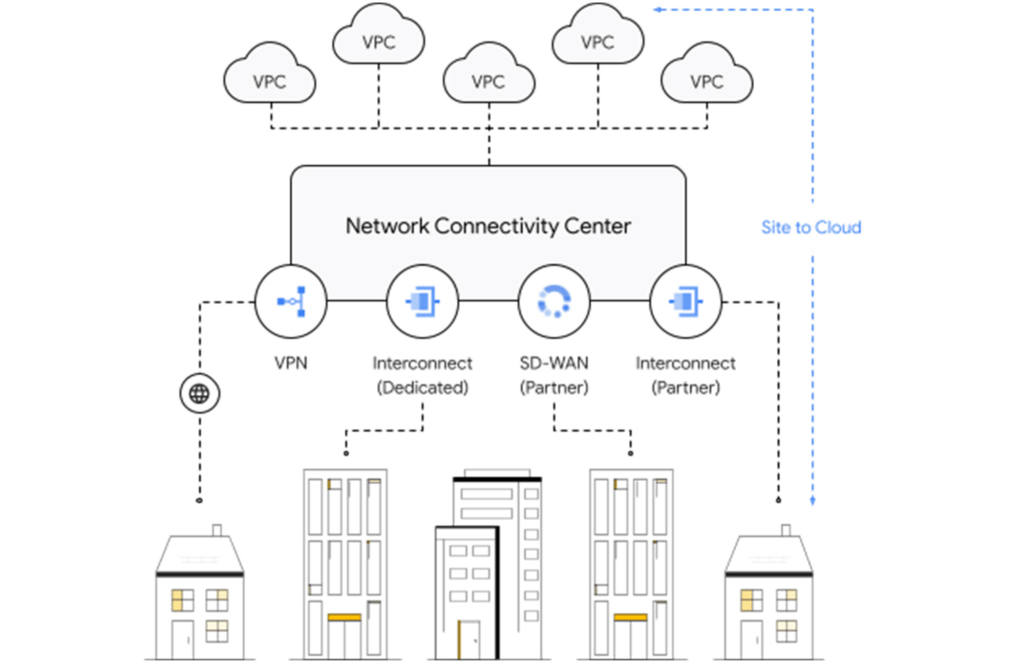
Site-to-cloud connectivity
Site-to-cloud connectivity traditionally is done via a cloud interconnect or a cloud VPN. The automatic exchange of routes between on-premises and multiple VPCs can be done using a transit VPC.
A newer approach is to add cloud providers into an SD-WAN mesh using a router virtual appliance in Google Cloud. Network Connectivity Center brings the capacity to synchronize the appliance routes dynamically via BGP to Cloud Router and hence their VPCs. It enables connectivity between on-premises data centers and branch offices and their cloud workloads via SD-WAN-enabled connectivity. This capability is available globally across all 29+ Google Cloud regions. Several of our partners also support this capability in their router appliances.
Site-to-site connectivity
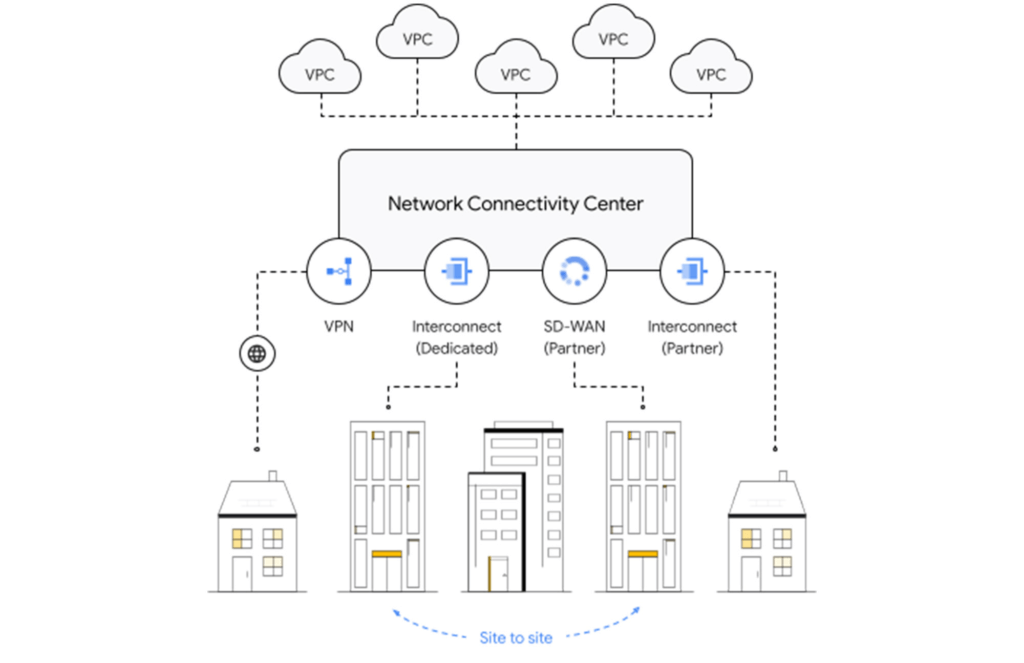
Site-to-site connectivity enables network connectivity directly between two or more hybrid connection points (VPN, Interconnect or SD-WAN). Network Connectivity Center simplifies this model by automating the routing announcements in this environment, such that all sites connected to a single global Network Connectivity Center hub are able to communicate freely in any-any fashion. You can see an example of this for a specific market vertical use case in a recent blog, Voice trading in the cloud — digital transformation of private wires.
VPC-to-VPC connectivity
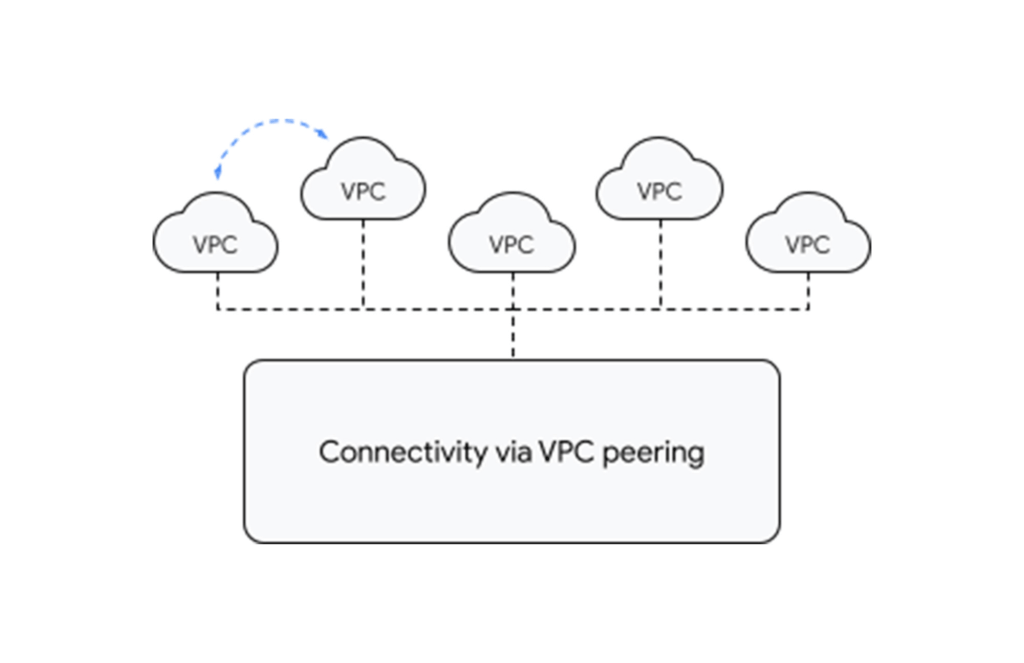
You can create a full or partial mesh of VPC connections using multiple technologies, with VPC peering being the most common. VPC peering provides highly performant, low latency, private connectivity for customer networks connected via hybrid connectivity and Network Connectivity Center to multiple VPCs containing workloads, which can be segmented via granular firewall policies as needed. Alternatively, you can use a transit VPC model to connect multiple VPCs together in a hub and spoke topology.
With tight integration with third-party router appliances as mentioned earlier, you can also leverage their third-party supported solutions such as next-generation firewalls to connect your VPCs together to meet specific compliance and segmentation requirements. Network Connectivity Center allows you to synchronize the routing tables of these appliances with your VPC’s routing table, simplifying the process of setting up redundant configurations.
What’s next for cloud networking connectivity in Google Cloud?
As enterprises continue to migrate different types of workloads to public cloud providers, networking topologies are becoming more complex. In summary, we have solutions for all connectivity needs. We aim to keep our models and solutions understandable and simple. Over time, look for Network Connectivity Center to become Google Cloud’s single point of configuration for all your connectivity needs, with capabilities to handle the most complex network.
How Vertex Vizier’s Automated Hyperparameter Tuning Improves ML Models
5025
Of your peers have already read this article.
1:30 Minutes
The most insightful time you'll spend today!
We recently launched Vertex AI to help you move machine learning (ML) from experimentation into production faster and manage your models with confidence—speeding up your ability to improve outcomes at your organization.
But we know many of you are just getting started with ML and there’s a lot to learn! In tandem with building the Vertex AI platform, our teams are dropping as much best practices content as we can to help you come up to speed. Plus, we have a dedicated event on June 10th, Applied ML Summit, with sessions on how to apply ML technology in your projects, as well as grow your skills in this field.
In the meantime, we couldn’t resist a quick lesson on hyperparameter tuning, because (a) it’s incredibly cool (b) you will impress your coworkers (c) Google Cloud has some unique battle tested tech in this area and (d) you will save time by getting better ML models into production faster. Vertex Vizier, on average, finds optimal parameters for complex functions in over 80% fewer trials than traditional methods.
So it’s incredibly cool, but what is it?
While machine learning models automatically learn from data, they still require user-defined knobs which guide the learning process. These knobs, commonly known as hyperparameters, control, for example, the tradeoff between training accuracy and generalizability. Examples of hyperparameters are the optimizer being used, its learning rate, regularization parameters, the number of hidden layers in a DNN, and their sizes.
Setting hyperparameters to their optimal values for a given dataset can make a huge difference in model quality. Typically, optimal hyperparameter values are found via grid searching a small number of combinations, or tedious manual experimentation. Hyperparameter tuning automates this work for you by searching for the best configuration of hyperparameters for optimal model performance.
Vertex Vizier enables automated hyperparameter tuning in several ways:
- “Traditional” hyperparameter tuning: by this we mean finding the optimal value of hyperparameters by measuring a single objective metric which is the output of an ML model. For example, Vizier selects the number of hidden layers and their sizes, an optimizer and its learning rate, with the goal of maximizing model accuracy.
- When hyperparameters are evaluated, models are trained and evaluated on splits of the data set. If evaluation metrics are streamed to Vizier (e.g. as a function of epoch) as the model is trained, Vizier’s early stopping algorithms can predict the final objective value, and recommend which unpromising trials should be early stopped. This conserves compute resources and speeds up convergence.
- Oftentimes, models are tuned sequentially on different data sets. Vizier’s built in transfer learning learns priors from previous hyperparameter tuning studies, and leverages them to converge faster on subsequent hyperparameter tuning studies.
- AutoML is a variant of #1, where Vertex Vizier performs both model selection, and also tunes architectures/non-architecture modifying hyperparameters. AutoML usually requires more code on top of Vertex Vizier (to ingest data etc), but Vizier is in most cases the “engine” behind the process. AutoML is implemented by defining a tree like (DAG) search space, rather than a “flat” search space (like in #1). Note that you can use DAG search spaces for any other purpose where searching over a hierarchical space makes sense.
- There are times when you may wish to optimize more than one metric. For example, we would like to optimize model accuracy, while minimizing model latency. Vizier can find the Pareto frontier, which presents tradeoffs for multiple metrics, allowing users to choose the appropriate tradeoff. Simple example: I want to make a more accurate model, but would like to minimize serving latency. I do not know ahead of time what’s the tradeoff between the two metrics. Vizier can be used to explore and plot a tradeoff curve, so users can select on the most appropriate one. For example, “a latency decrease of 200ms will only decrease accuracy by 0.5%”
Google Vizier is all yours with Vertex AI
Google published the Vizier research paper in 2017, sharing our work and use cases for black-box optimization—i.e. The process of finding the best settings for a bunch of parameters or knobs when you can’t peer inside a system to see how well the knobs are working. The paper discusses our requirements, infrastructure design, underlying algorithms, and advanced features such as transfer learning that the service provides. Vizier has been essential to our progress with machine learning at Google, which is why we are so excited to make it available to you on Vertex AI.
Vizier has already tuned millions of ML models at Google, and its algorithms are continuously improved for faster convergence and handling of real-life edge cases. Vertex Vizier’s models are very well calibrated and are self-tuning (they adapt to user data), and offer unique power features, such as hierarchical search spaces and multi-objective optimization. We believe Vertex Vizier’s set of features is a unique capability to Google Cloud, and look forward to optimizing the quality of your models by automatically tuning hyperparameters for you.
To learn more about Vertex Vizier, check out these docs and if you are interested in what’s coming in machine learning over the next five years, tune in to our Applied ML Summit on June 10th, or watch the sessions on demand in your own time.

1089
Of your peers have already downloaded this article
4:30 Minutes
The most insightful time you'll spend today!
There is no one-size-fits-all solution to cloud migration. Every approach has unique considerations, so you need to understand the trade-offs of each to execute an effective migration plan.
We’ve outlined the key things to consider when crafting your migration journey, including:
- The benefits of having your applications in the cloud.
- Finding the right migration option for your business needs.
- Getting started with your migration.
More Relevant Stories for Your Company

The Cloud-First Imperative To Accelerate Digital Transformation
In a study of 360 business and technology decision makers and influencers from Indian enterprises, conducted by Forrester Consulting, it is revealed that public cloud adoption in India is on the rise with 2 in 3 organizations planning to increase their cloud spending by 5% or more in the next

Indonesia moves towards advanced education with Cloud, ML & Mobile Development
Indonesia is leading the way for digital transformation in Southeast Asia. According to Google’s e-Conomy South East Asia report, the country’s 2030 Gross Merchandise Value - the value of online retailing to consumers - could be twice the value of the whole of Southeast Asia today. This growth means that

Pacemaker’s Automated Alerts and Alert Reporting: No More Outages for SAP Systems on Google Cloud!
When critical services fail, businesses risk losing revenue, productivity, and trust. That’s why Google Cloud customers running SAP applications choose to deploy high availability (HA) systems on Google Cloud. In these deployments Linux operating system clustering provides application and guest awareness for the application state and automates recovery actions in

How Retailers Can Beat Inflation Like a Pro With These 5 Tips
Budget concerns and inflation shock are causing noticeable shifts in consumer behavior, a head-spinning turnabout since the pandemic days of 2020. We went from not having access to enough goods to now not having the right goods at the right price points. Heading into the holiday season, retailers will need
