





GKE Feature Guide: 5 Ways to Optimize Your Kubernetes Clusters

1572
Of your peers have already read this article.
7:00 Minutes
The most insightful time you'll spend today!
In this post, we’ll be discussing 5 features in GKE you can use to optimize your clusters today. To get started with testing these in GKE, check out our interactive tutorials for getting started with standard and autopilot clusters.
If you find value from running workloads on Kubernetes clusters in your organization, chances are your footprint will grow – be it through larger clusters or more clusters.
Whichever your approach, one thing is certain: you’ll have more resources that you pay for. And you know what they say – more resources, more problems. The more resources you have across clusters, the more critical it becomes to make sure you’re using them efficiently.
Google Kubernetes Engine has numerous features built-in that you as a cluster admin can use to navigate this continuous journey of optimizing your use of resources in GKE.
Let’s review five of them you can get started with today.
#1 – Cluster view cost optimization in the console
If you don’t know where to start with optimizing your clusters, the best place to start is looking for a big problem that stands out. That’s probably most visible by looking at a view that spans all of your clusters.
In GKE, we have a cluster-level cost optimization tab built into the console, rich with information that may be cumbersome to gather on your own otherwise.
You can find this as seen in the following image:
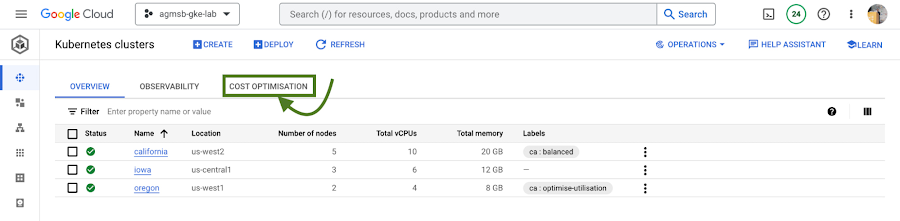
Fig. 1 – Navigating to the cost optimization tab in the cloud console
Once you navigate to this tab, you’re greeted with a time series visualization.
For GKE standard clusters, this visualization is a time series representation that shows three key dimensions for CPU and Memory across all of your clusters in a project:
Total CPU/Memory allocatable– # of CPU or GB of memory that can be allocated to user workloadsTotal CPU/Memory request– # of CPU or GB of memory that has been requested by user workloadsTotal CPU/Memory usage– actual usage by # of CPU or GB of memory by user workloads
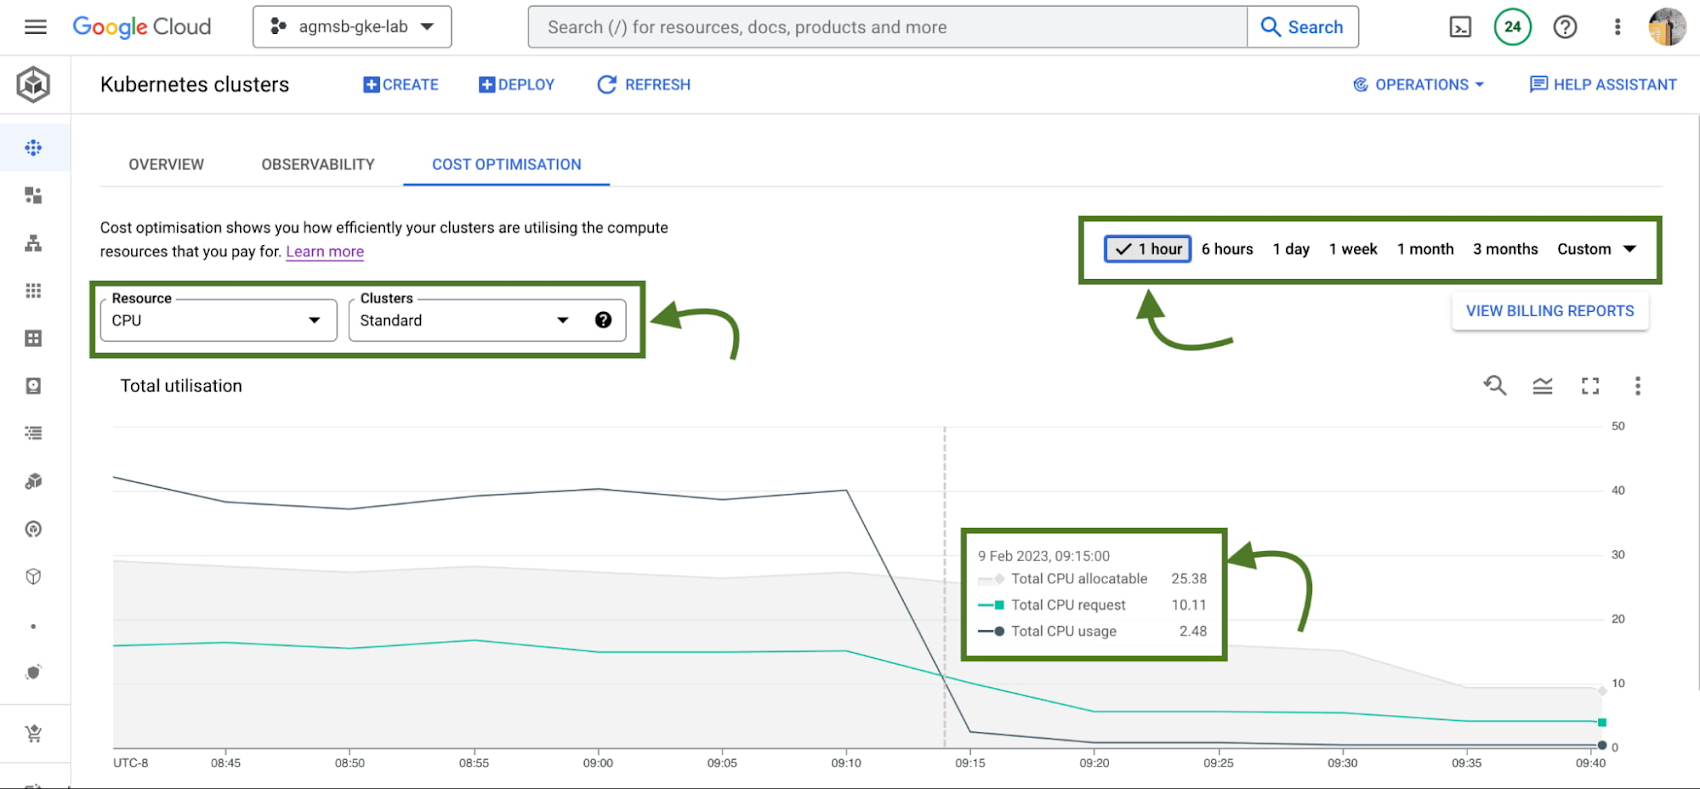
Fig. 2 – Allocatable, requested, and usage time series data across CPU or memory in all standard GKE clusters over a specified window
Analyzing these in relationship to one another can help identify answers to important optimization questions such as:
- Do we have too much allocatable CPU and memory idle across our GKE standard clusters? If so, can we do things like re-evaluate the machine types we use in node pools? This can help us bin pack the cluster, by having a higher percentage of allocatable resources allocated to Pod requests.
- Are workloads running in our GKE standard clusters requesting too much CPU and memory that goes unused? If so, can we do things like work with workload owners to adjust requests? This can help us workload right-size, by setting requests to more closely reflect expected usage.
If we’re using GKE Autopilot, this time series visualization will look slightly different, as seen in the following image:
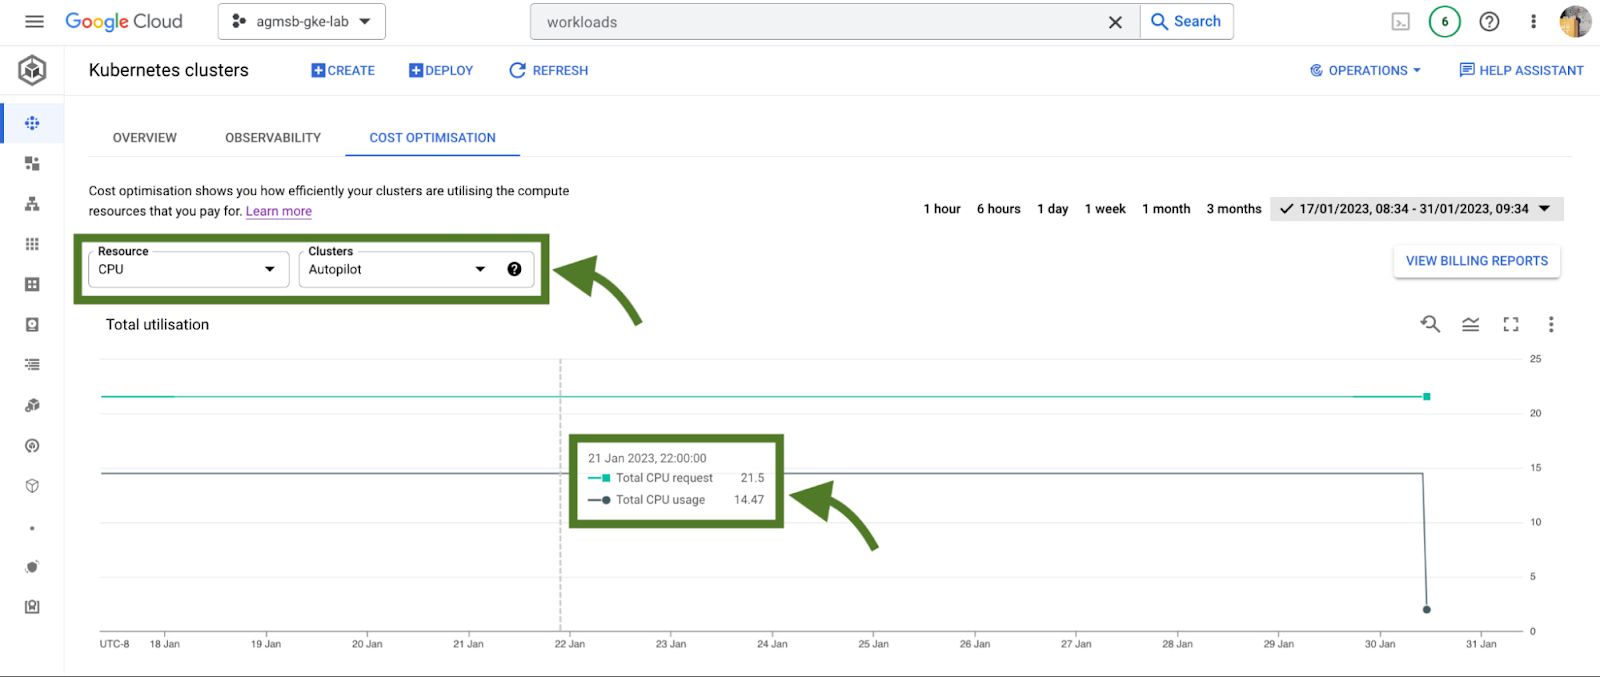
Fig. 3 – Requested and usage time series data across CPU or memory in all GKE Autopilot clusters
In the case of GKE Autopilot clusters, we’re only able to view the Total CPU/Memory request and the Total CPU/Memory usage data. But nothing here is actually missing!
In Autopilot clusters, you only pay per Pod based on its requests; Autopilot automatically handles provisioning the infrastructure that gives us our allocatable resources based on whatever you set Pod requests to. When we trade in that ownership of node provisioning, we also trade in the control to optimize at that layer.
For a cluster administrator, this information can be a spark to spur actions such as diving into individual clusters or meeting with workload teams to work through their requests and limits that they set for workloads. In our research, this is perhaps the most impactful area many teams optimize. We’ll dive into how GKE can enable this exercise a bit further in this blog.
When going down those paths, it helps to have financial data to quantify the impact of the optimization to the business. Gathering this info on your own can require a bit of work (for some, a lot of spreadsheets as well!), but luckily GKE has another native feature to help make this easily accessible to you.
#2 – GKE cost allocation
GKE cost allocation is a native GKE feature that integrates workload usage with Cloud Billing and its reports, allowing you to see and alert on billing not only on a per-cluster level, but on a per-Kubernetes namespace or per-Kubernetes label level.
It must be enabled on your cluster in order for it to function, so if you’re working with an existing GKE cluster and want to enable it, use the following gcloud command once you have set your appropriate zone or region:
$ gcloud beta container clusters create $CLUSTER_NAME \
    --enable-cost-allocation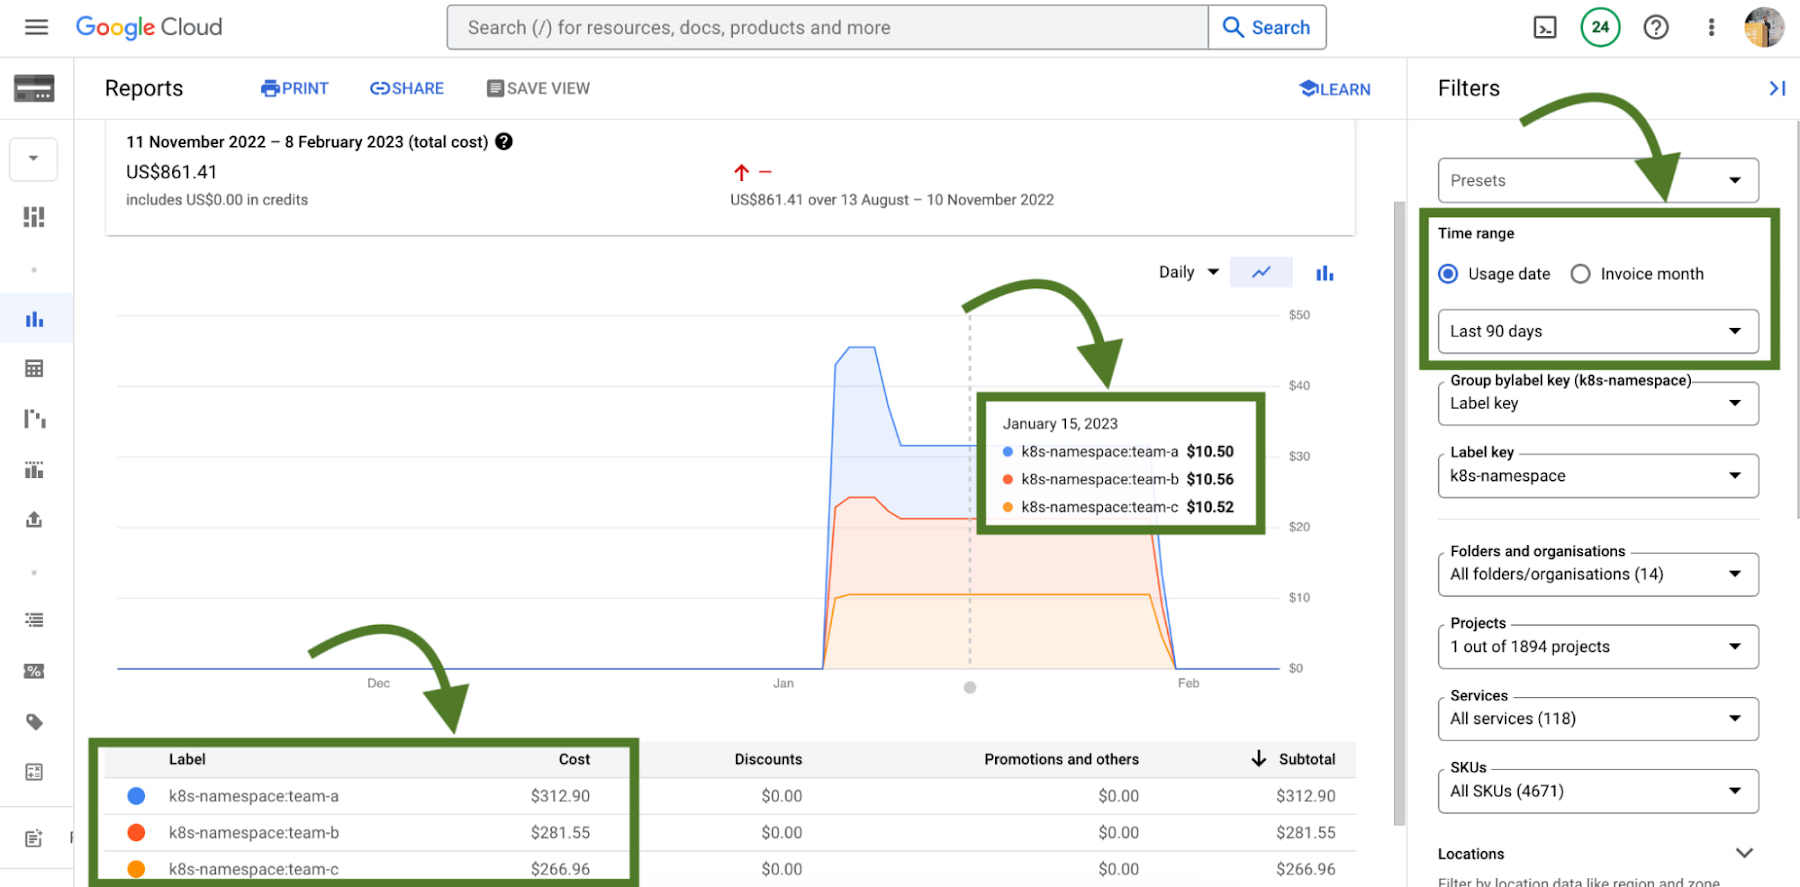
Without GKE cost allocation, the financial impact of a cluster and all of the different workloads it might run were a bit obfuscated. With the cluster as the deepest level of detail in billing, finding areas to optimize or even performing showback and chargeback was a challenge.
With Namespaces and Labels bubbling up into billing reports, you can now understand the cost of the CPU/Memory requests that workloads define in Kubernetes. A caveat – this works best when you are using Namespaces and Labels to logically define and organize teams and their workloads.
This integration also gives the bigger picture of optimization – in that GKE does not typically live on an island! In theory, workloads in a team’s namespace could be using external backing services like Cloud Memorystore that are also a key part of its usage.
Because Cloud Billing data has all GCP services, we can now filter and query across namespaces and their corresponding backing services.
# 3 – Workload view cost optimization in the console
Once you have teams identified that you may want to work with, GKE provides a cost optimization tab at the workload level, where you can then begin to drill down and identify specific workloads that could be optimized through an exercise called “workload right-sizing”. This is the act of making sure that Pod requests more closely reflect their expected usage.
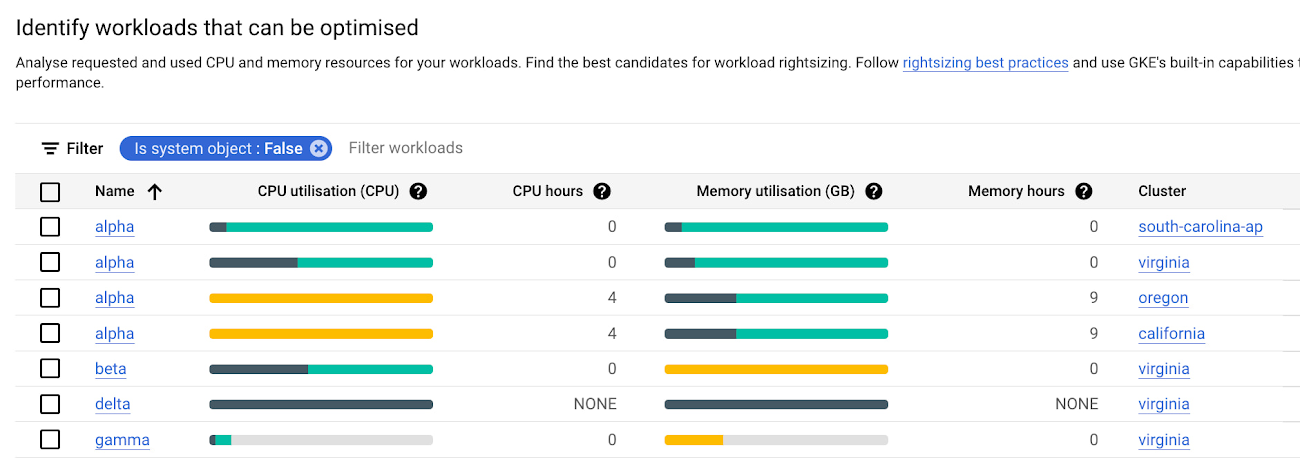
As you can see here, we’re given bar charts to represent the relationship of usage, requests, and limits to one another.
- Dark green: CPU/Memory usage
- Light green: CPU/Memory requests
- Grey: CPU/Memory Limits
- Yellow: Scenarios in which CPU/Memory usage exceeds requests
You can also hover over each individual workload bar chart to reveal a small on-screen report of this data. Similar to the cluster view cost optimization tab, you can filter down to a custom time window; we recommend viewing this data in a window greater than an hour (IE a day, week, month) to potentially uncover diurnal or weekly patterns that would otherwise be obfuscated.
In the preceding screenshot of these charts, we can call out a few patterns that might stand out to you:
- If we have too much light green stacked above dark green in a bar, we may have workloads that are over provisioned.
- If we have a yellow bar, we have a workload where requests are not set high enough, which can be a stability/reliability risk – consuming additional resources on its node and potentially being throttled or OOMKilled if it hits its limits.
- If we have a bar that is all dark green, this means that we don’t have requests set for a workload – which is not best practice! Set those requests.
With this information, it becomes easier to quickly identify workloads that need requests and limits tuned for either cost optimization or stability and reliability.
# 4 – Recommendations for adjusting workload requests
In scenarios where we need to increase or reduce CPU/Memory requests, it is easier to know that it needs to be done than to know how it needs to be done. What should we set the requests to?
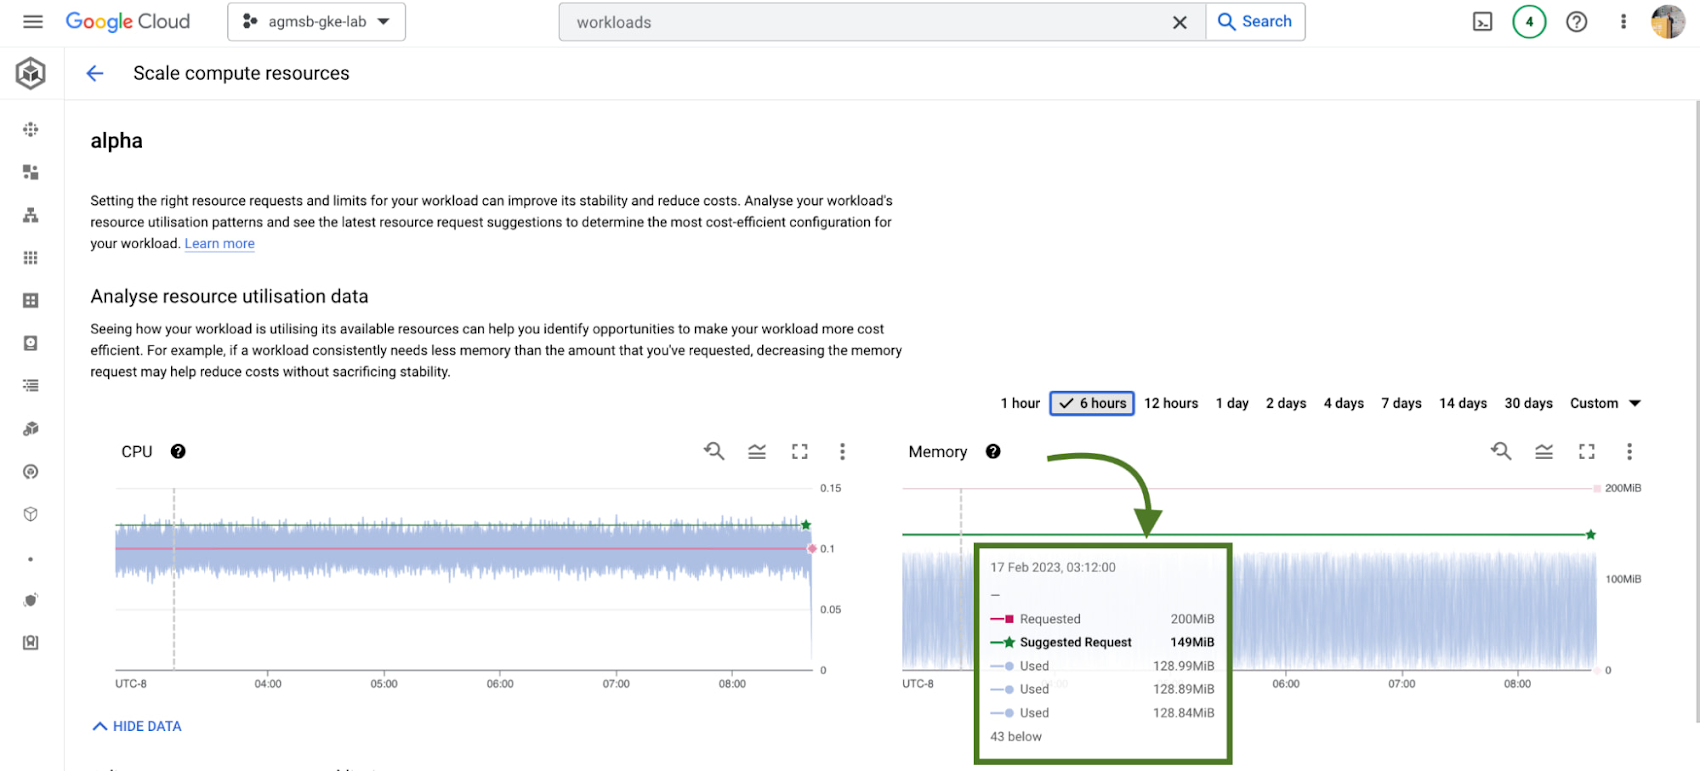
GKE integrates recommendations from the Kubernetes Vertical Pod Autoscaler (VPA) directly into its workload console, currently for all deployments in your clusters. You can find this by navigating to the Actions > Scale > Scale compute resources menu when viewing the page for a specific workload.
It’s important to remember that these recommendations are just that – recommendations. They’re based on historical usage data, so when viewing these values, it’s important to work with workload owners to see if these suggestions make sense to incorporate into their respective Kubernetes manifests.
# 5 – Cost estimation and cluster creation setup guides
Finally, if you’re just getting started with GKE and you want to get started on the right, optimized foot, we have tooling incorporated into the GKE cluster creation page.
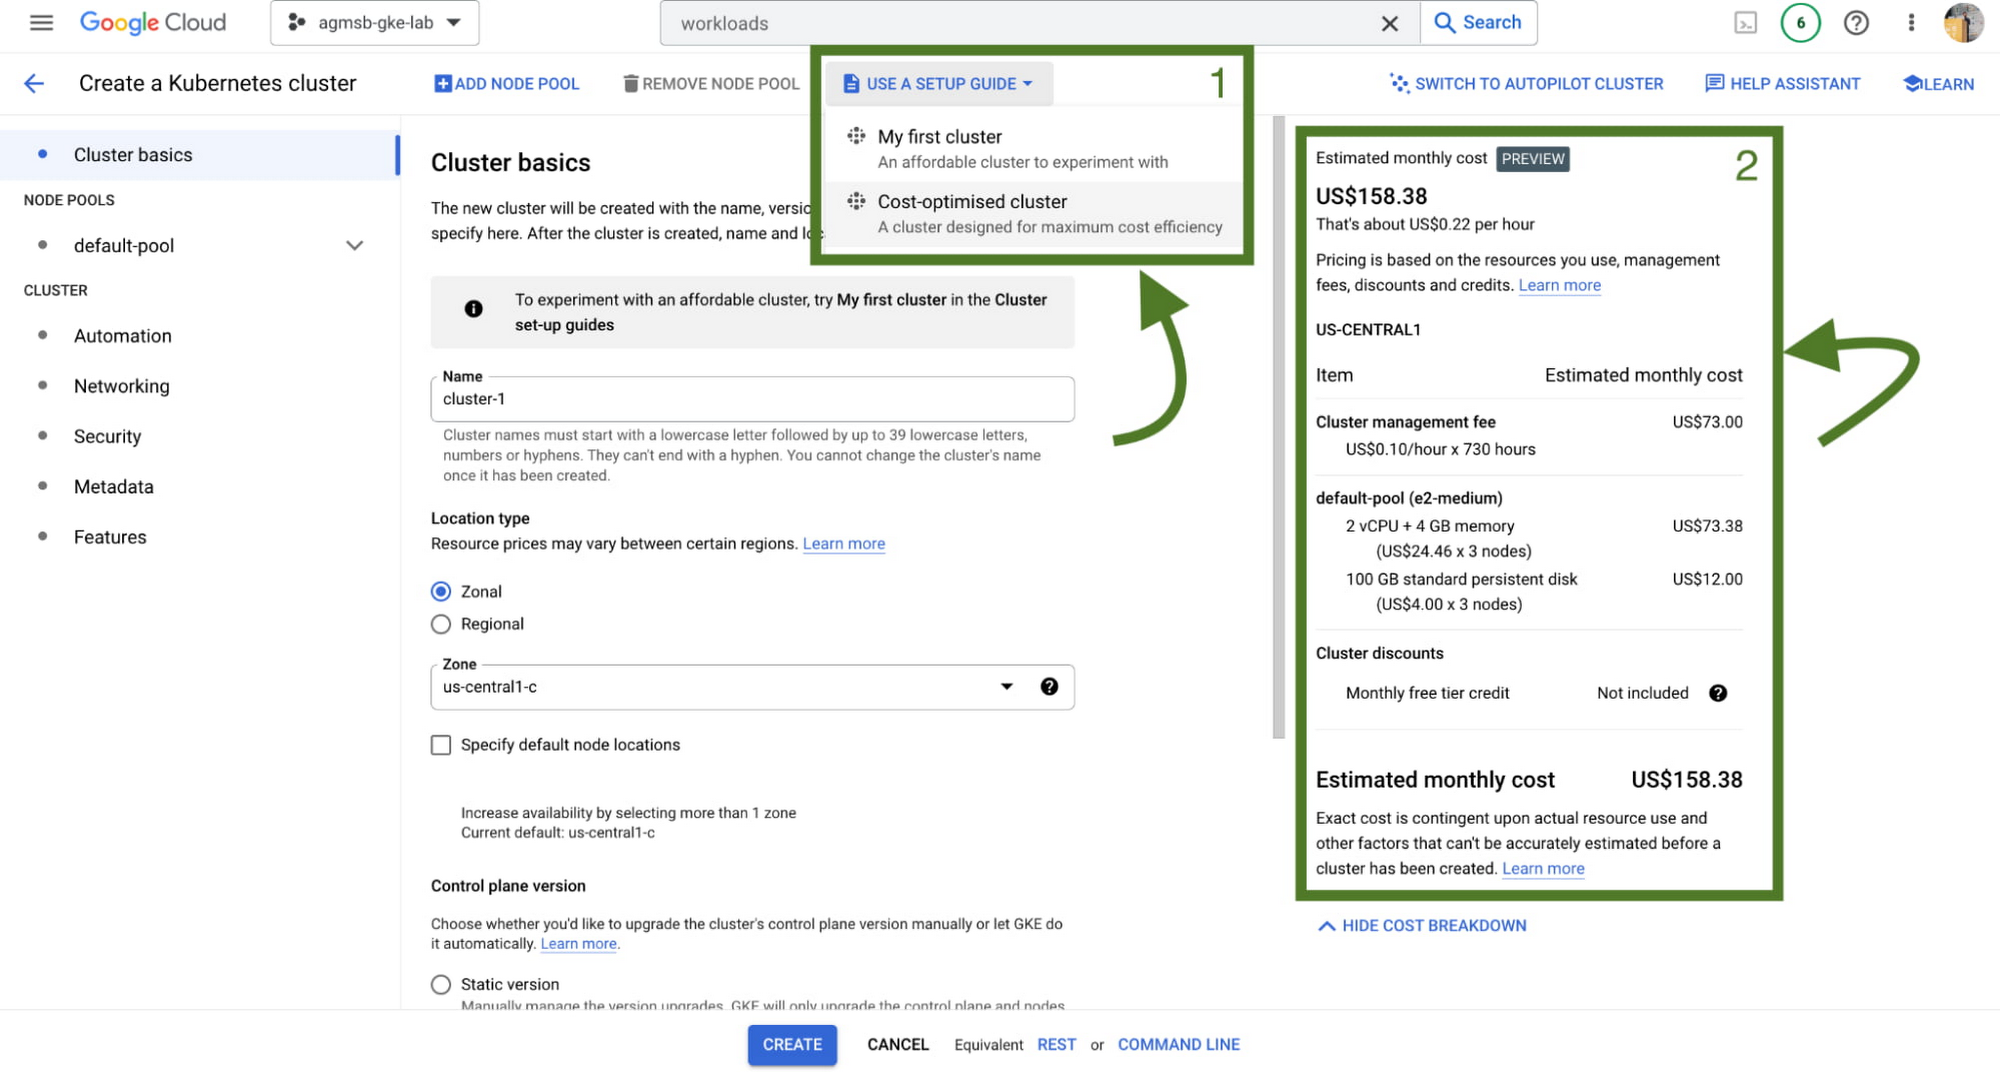
First, we have a setup guide that will help you create an opinionated GKE standard cluster with some things we discussed here already enabled, such as GKE cost allocation and Vertical Pod Autoscaler.
Second, we also have a cost estimation panel that, depending on the configuration of your GKE standard cluster, will show you an estimated monthly cost. This even helps you get a range of potential costs if you expect your cluster to scale up and down!
Now what?
Optimization across a set of GKE clusters can include a handful of areas to think about – and isn’t a one time task! Instead, it’s a continuous journey that cluster administrators, workload owners, and even billing managers all take part in. GKE provides the tooling to make this journey and process easier, with the right data and insights at your fingertips.
To familiarize yourself with these features in GKE, check out our interactive tutorials for getting started with standard and autopilot clusters.
You can also watch a demo showing most of these features in the following video:
A special thanks to Laurie White, Fernando Rubbo, and Bobby Allen for their review on this blog post.
Khan Academy’s Shortcut to Growth: The Trick Behind the Scenes

3590
Of your peers have already read this article.
4:15 Minutes
The most insightful time you'll spend today!
Based in Mountain View, California, Khan Academy is a not-for-profit that produces and posts a vast collection of free educational online videos about math and science topics ranging from algebra and trigonometry to biology and economics.
Millions of students, educators, and self-learners around the world watch the videos, both on the Khan Academy’s YouTube channel and on its hugely popular website (www.khanacademy.org), where students answer some 1.5 million practice questions per school day. The Khan Academy development team continually tweaks the site based on how visitors choose to learn.
Challenge
Khan Academy’s beginnings date back to 2004, when Sal Khan’s cousin asked him to remotely tutor her daughter in math. Khan was happy to help and more than qualified, given his three MIT degrees and his Harvard MBA.
As more relatives and friends asked Khan for tutoring assistance, he began videotaping short lessons and posting them to YouTube. His knack for distilling complex concepts into easy-to-follow tutorials helped the videos go viral.
Sal knew he needed to offload the technical and maintenance concerns so he could work on what was important. To grow, it was important for him to be able to stop worrying about things like deployment issues and running his own server.
Ben Kamens, lead developer for Khan Academy
Khan maintained a website for his growing video library for several years, but the platform experienced limitations as traffic increased.
At the same time, media attention was growing, and technology industry leaders, including Microsoft founder Bill Gates and Silicon Valley venture capitalist John Doerr, began lending their support and evangelizing Khan’s mission and work. It was at this point that Khan quit his job as a hedge fund analyst to devote his full-time attention to the site’s growing potential.
“With Google App Engine, we don’t need a system administrator or anyone dedicated to deploying our app, so 99 percent of our time is spent working on our application,” says Ben Kamens, lead developer, Khan Academy.
“Sal knew he needed to offload the technical and maintenance concerns so he could work on what was important, which was to make more videos for the Khan Academy library,” explains Ben Kamens, lead developer for Khan Academy. “To grow, it was important for him to be able to stop worrying about things like deployment issues and running his own server.”
Solution
Khan Academy chose App Engine as its hosting and application development platform because App Engine could easily house its growing collection of 2,000-plus videos, resolving the organization’s overall server and maintenance issues with a single solution.
Using App Engine freed the team to focus on the user experience and the array of content that makes the academy such a powerhouse.
“A lot of what the Khan Academy is about is collecting data on student behavior so we can teach them better,” Kamens says. “Did they use a hint? Have they watched the video before? That data is being stored on Google App Engine so we can figure out what the most effective videos are, or where students struggle the most.”
Khan Academy provides individual profiles to students so they can analyze their learning progress, which means the organization needs systems running in the background to collect and track of all this data. Because App Engine takes care of server support, Khan Academy’s five developers can spend almost all of their time improving site functionality.
“If we didn’t have Google App Engine, we’d be spending a lot more time figuring out server setup and working on routers,” Kamens says. “Our ability to focus on the actual product is the benefit of Google App Engine.”
With the App Engine dashboard, which provides information like response time, uptime, and error rates, the development team also has an easy way to watch over site performance. “It lets us see what the average response time is, so we can keep it really low,” Kamens explains.
Results
During the US school year, Khan Academy receives more than 3.8 million unique visits a month — all served through App Engine. To support this much traffic, a typical company would need an internal system administration staff.
“With Google App Engine, we don’t need a system administrator or anyone dedicated to deploying our app, so 99 percent of our time is spent working on our application,” explains Kamens. “Our application lives on Google App Engine, and we bank all of our scalability and traffic concerns on Google App Engine. Even huge traffic spikes from Sal’s media appearances don’t worry us since we know that Google App Engine will handle the spike.”
Kamens also likes the fact that he and his team can turn to the Google App Engine support team for assistance when they need it. He also finds helpful tips on the Google App Engine blog.
The Khan Academy staff has come to completely rely on App Engine. “We are constantly using more of Google App Engine’s capabilities and have been happy with the performance,” Kamens says. “It’s nice to have an easy deployment process since we deploy the site on average at least once a day, [and] sometimes up to nine or 10 times [a day].”
Private Services Connect in Google Cloud Regions Enables Customers to Consume Services Faster

4624
Of your peers have already read this article.
2:00 Minutes
The most insightful time you'll spend today!
At Google Cloud, we believe in making it simple and secure to consume services whether they’re from Google, a third party or customer-owned. With Private Service Connect, we have adopted a service-centric approach to our network that abstracts the underlying networking infrastructure. And today, we are announcing Private Service Connect is generally available in all Google Cloud regions.
Private Service Connect allows you to create private and secure connections from your cloud networks to services like Cloud Storage or Cloud Bigtable and third-party services like Elastic, MongoDB or Snowflake. It creates service endpoints in your VPCs that provide private connectivity and policy enforcement, allowing you to easily connect to services across different networks and organizations.
Customers told us they want to consume services faster while making sure that the connectivity is private and secure. In the past, achieving this was a challenge: networking teams had to negotiate IP address blocks, mutually agree on policies and coordinate as applications evolved to newer versions. With Private Service Connect, you can delegate the consumption and delivery of services to different teams without having to coordinate between teams.
How it works
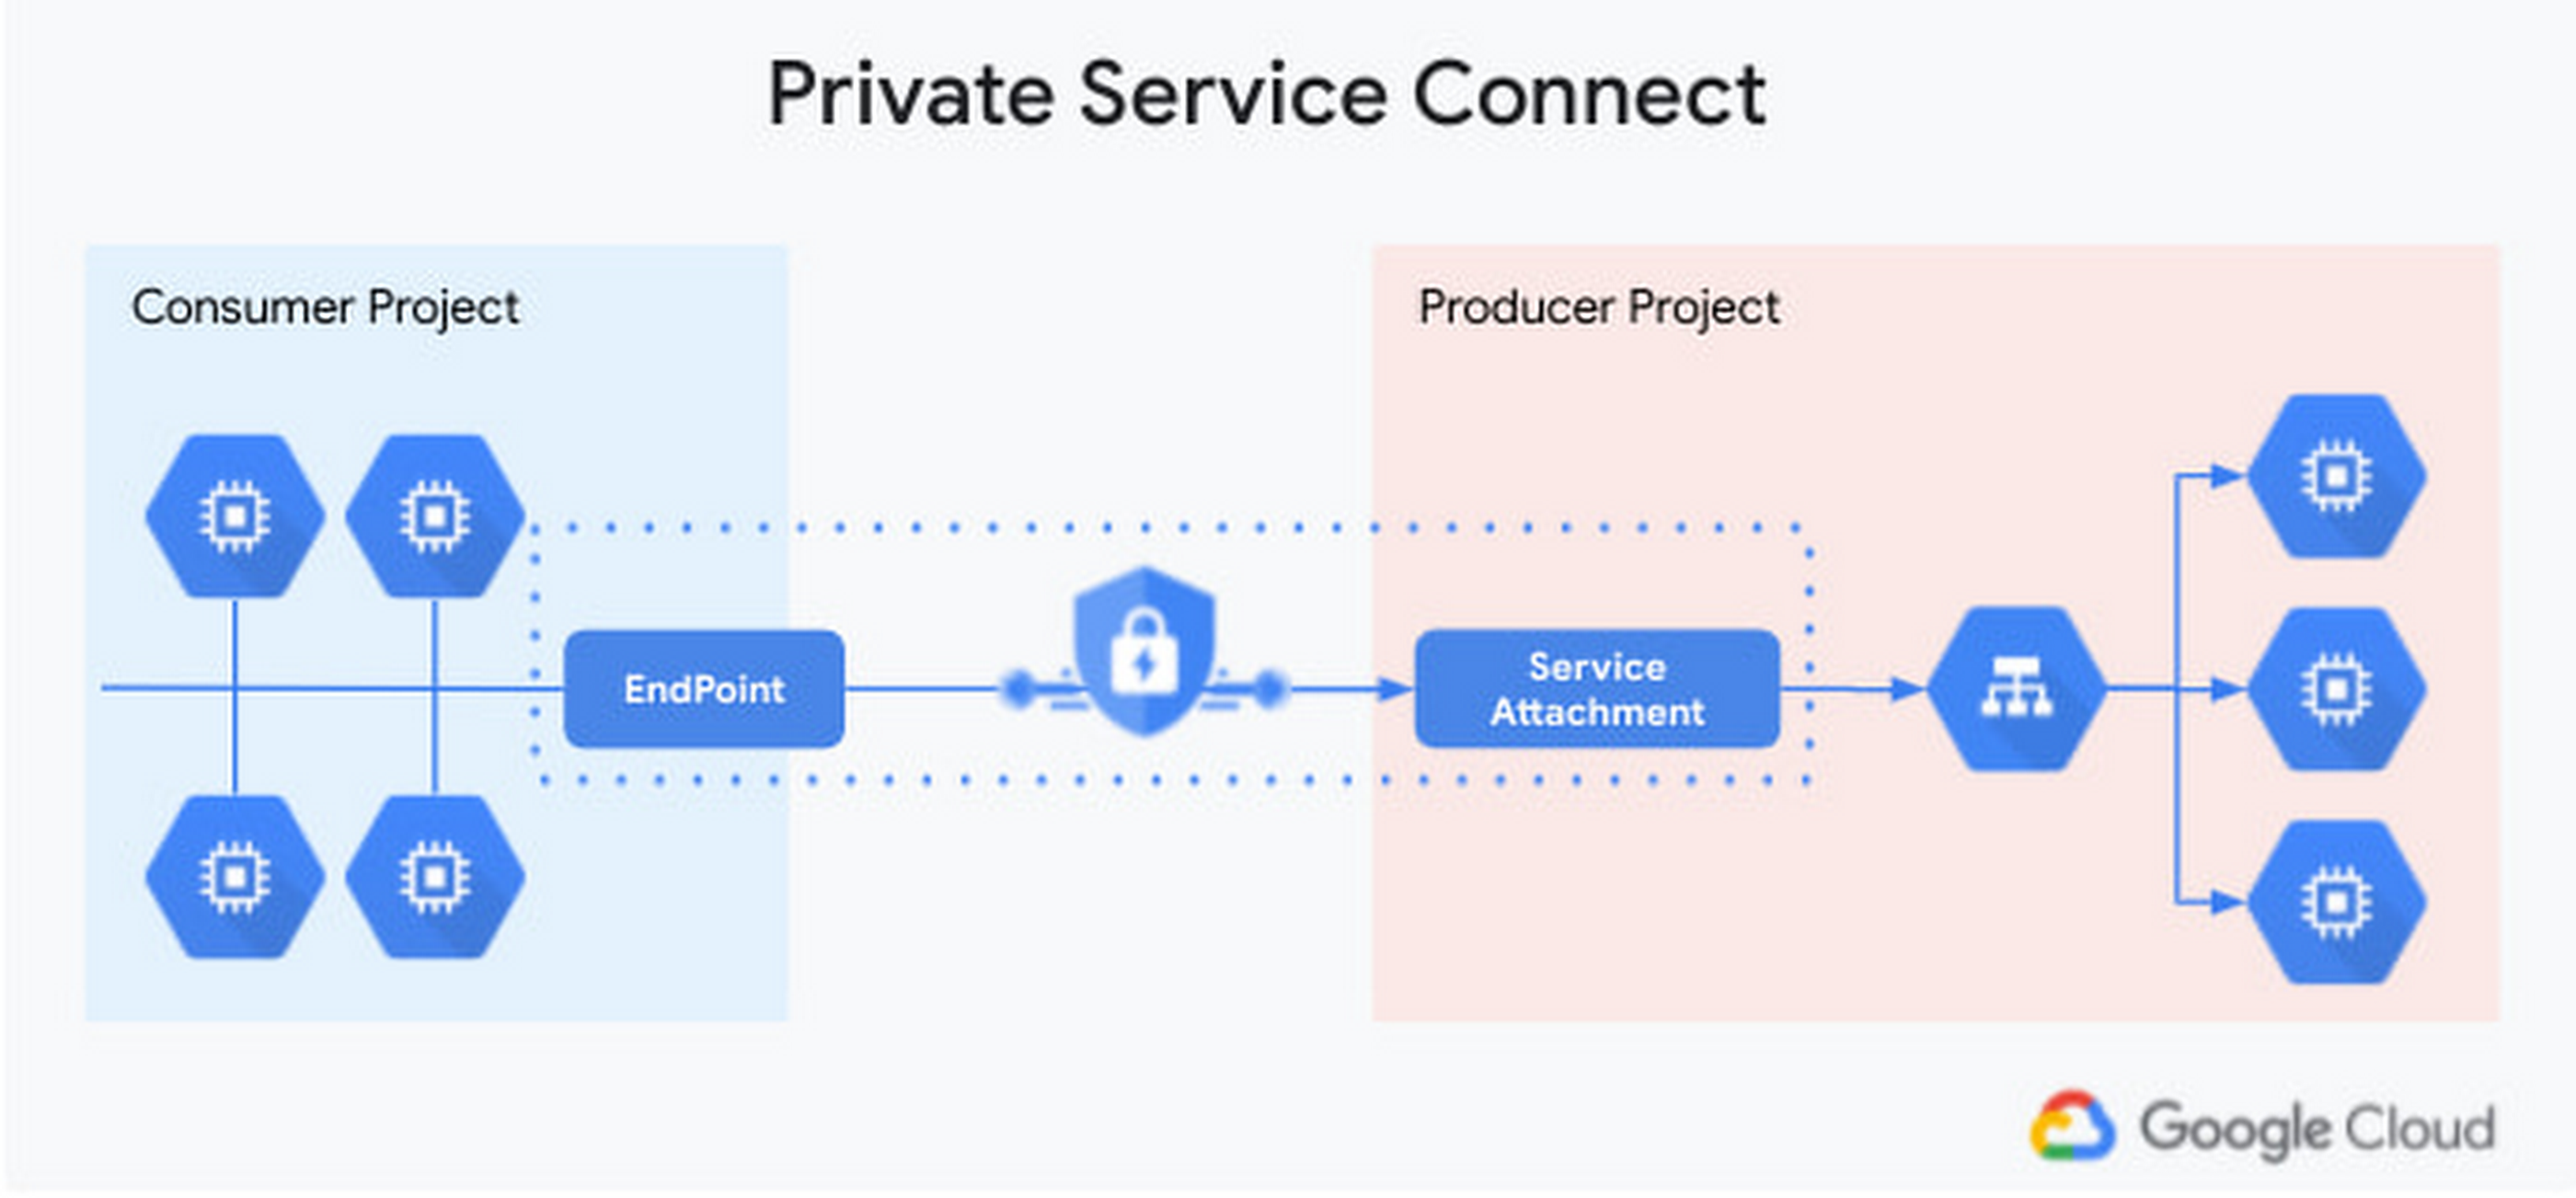
Private Service Connect makes it easy to consume services by leveraging service endpoints that are locally managed. The services can be in different projects or managed by different organizations. Access to the service is controlled by strict governance and IAM policies. Application teams and developers can focus on delivering their services easily by exposing their ‘service attachment’. No more worrying about networking constructs—Private Service Connect takes care of connecting to the service on the Google backbone for them.
Benefits to our partners
Being able to consume services from a variety of software vendors and service providers makes it possible for enterprises to innovate faster. For that, developers need to be able to compose services from third-party vendors, Google managed services, as well as their own services. To help, third-party partners can use Private Service Connect to deliver multi-tenant services securely and at massive scale, and make the connectivity to their services appear as if they are running on the enterprises’ network. Private Service Connect will also integrate with Service Directory to register many producer services, making service consumption even simpler.
“In today’s environment, where seamless access to real-time market information and the ability to handle increasingly vast volumes of data is essential, our clients are demanding native connectivity in the cloud. Google’s Private Service Connect offers the performance and reliability required by the types of mission critical apps that rely on Bloomberg’s tick for tick market data feed, B-PIPE.” —Cory Albert, Global Head of Cloud Strategy, Enterprise Data at Bloomberg
“One of the key goals for Elastic on Google Cloud is to monitor and protect our customers’ data. Google Cloud’s Private Service Connect with Elastic Cloud furthers our commitment to our customers that together we make it quick, easy and secure to gain insights and intelligence from their data.” —Uri Cohen, Product Lead for Elastic Cloud
“MongoDB’s partnership with Google is an integral part of our strategy to support modern apps and mission-critical databases and to become a cloud data company. Private Service Connect allows our customers to connect to MongoDB Atlas on Google Cloud seamlessly and securely and we’re excited for customers to have this additional and important capability.”—Andrew Davidson, VP of Cloud Product, MongoDB
Check out the Google Cloud Console to try it today.
PaGaLGuY Turns to Google Cloud Platform to Power Leading India Education Network

8156
Of your peers have already read this article.
2:30 Minutes
The most insightful time you'll spend today!
Founded in 2006, PaGaLGuY started as a forum that enabled students, typically aged between 20 and 30 to discuss and seek advice on academic issues. By 2011, PaGaLGuY had increased its traffic to about 250,000 page views per month. The business is now one of India’s largest education networks and provides an app that users can download to their Android and iOS devices.
Over the past six years, PaGaLGuY has extended its service to include video advice from experts on education topics and grown the number of views of its pages to 1.5 million per day. As Head of Technology for the business, Sandeep Kalidindi has played a key role in ensuring PaGaLGuY is as engaging as possible to users. “Because the product is advertising based, the greater the user engagement, the greater the advertising revenue,” Kalidindi explains.
Google Cloud Platform Results
- Supported growth to 1.5 million page views per day and demand spikes that see requests increase from about 90 per second to about 1,200 per second
- Reduced API latency from about 1 second to about 40 milliseconds
- Reduced system administration time from three to four days per week to 30 minutes every two weeks
In 2015, PaGaLGuY’s senior management team decided to deliver an even more relevant experience for users of the education network. “The core thing we had to do was personalise the experience for each and every student that visited PaGaLGuY,” Kalidindi says. “So we had to capture each student’s data to customise what they see when they open the site.”
The business also found traffic to the network was straining its infrastructure. During demand peaks, created by exams involving as many as 5 million students, PaGaLGuY would be inaccessible for periods of 30 minutes to one hour. Furthermore, average API latency had climbed to an unacceptable 1 second, compromising performance.
PaGaLGuY needed to access extensive compute resources to undertake its planned change. Had the business relied on a physical technology architecture to undertake the transformation, it would have had to purchase capacity equivalent to 16 new servers. “There was no way with a small team we could grow to that extent in a short time,” Kalidindi says. “This was the right moment for us to explore cloud services.”
The business established two primary requirements the selected cloud service needed to meet. First, PaGaLGuY had to be able to scale the platform with costs rising only in proportion to the increase in resources consumed. Accordingly, the business would have to minimise the number of employees required to manage the cloud environment. Second, the platform had to give PaGaLGuY easy access to student data and the ability to undertake prompt, granular analysis.
PaGaLGuY reviewed available public cloud services and determined that Google Cloud Platform (GCP) was the best fit for its business. “Google Cloud Platform was considerably more mature than the alternatives, with a high degree of automation and a suite of managed services,” Kalidindi says. PaGaLGuY management then discussed with Google how to optimise cost, performance and availability of its personalised education network on GCP.
With assistance from Google and business transformation specialists Searce, PaGaLGuY was able to deliver the platform into production on GCP in 10 months. “Searce was very proactive in ensuring the environment met our needs and allowing us to gain priority access to Google services in development,” Kalidindi says. “Their team was integral to the success of the migration.”
PaGaLGuY has been running in production in GCP for two years. The education network’s GCP architecture comprises a scalable back-end built on Google App Engine; a managed environment for its containerised applications in Google Kubernetes Engine; messaging-oriented middleware through Google Cloud Pub/Sub; a relational database in Google Cloud SQL; a managed data analytics warehouse running in Google BigQuery; stream and batch data processing through Google Cloud Dataflow; and object storage in Google Cloud Storage.
PaGaLGuY has leveraged GCP services to break down its platform application from a monolithic build to a series of microservices running in Google App Engine that enable independent deployment cycles, minimise test and quality assurance overheads and provide clearer monitoring and logging.
Running on GCP has enabled PaGaLGuY to add new personalisation features and grow fourfold without having to add any new engineers or administrators to accommodate the increased traffic. The business has also used the platform to seamlessly collect and aggregate students’ data for analysis, reporting and delivering a more targeted user experience. Furthermore, PaGaLGuY has been able to provide its management team with direct access to Google BigQuery to scrutinise data rather than require them to wait at least a day to view reports created by the product or technology teams.
Support demand peaks of 1,200 requests per second
“Thanks to Google Cloud Platform, we can easily support demand peaks that see requests per second rise from an average 90 per second to about 1,200 per second for as long as 45 minutes,” Kalidindi says. Due to GCP’s scalability, PaGaLGuY can ensure its education network remains available and performance remains consistent during those periods.
Latency cut to 40 milliseconds
The business has also reduced average API latency from 1 second to about 40 milliseconds. Furthermore, using GCP has enabled PaGaLGuY to automate most of its processes and reduce system administration requirements from three to four days a week across its team members to about half an hour per week.
The performance of GCP has transformed PaGaLGuY’s culture and processes. “Once our team was exposed to Google Cloud Platform and understood the superiority of the platform, our mindset changed from ‘let us do everything on our own’ to ‘let us do what we do best’ and delegate the remainder,” Kalidindi says. The quality of the service provided by GCP means PaGaLGuY effectively considers the cloud provider as part of its team. “We are always eager to see what new services are being launched and are extremely excited about what Google Cloud Platform can provide as part of its roadmap.” he concludes.

Google Cloud Garners Highest Score in Forrester New Wave for Computer Vision Platforms
DOWNLOAD WHITEPAPER5338
Of your peers have already downloaded this article
8:30 Minutes
The most insightful time you'll spend today!
In Forrester’s evaluation of the emerging market for computer vision platforms, it identified the 11 most significant providers in the category — Amazon Web Services, Chooch AI, Clarifai, Deepomatic, EdgeVerve, Google, Hive, IBM, Microsoft, Neurala, and SAS — and evaluated them.
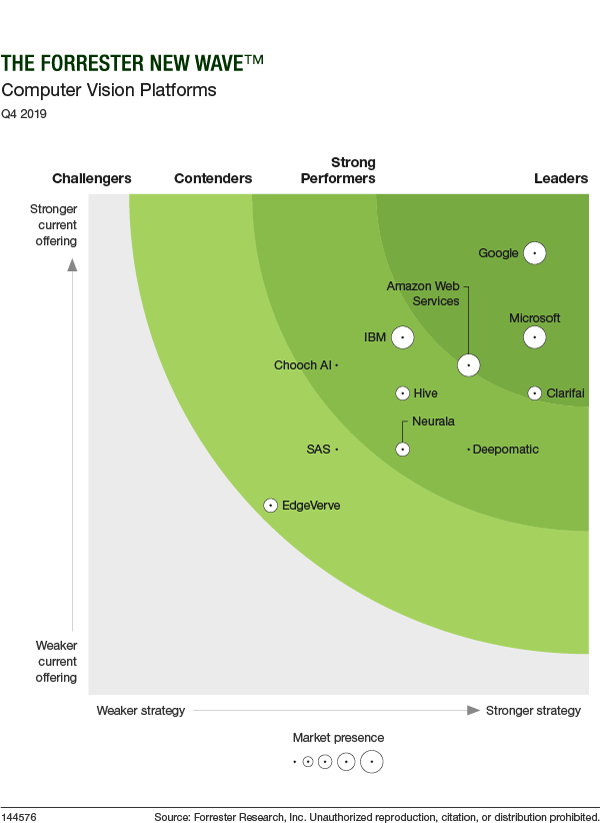
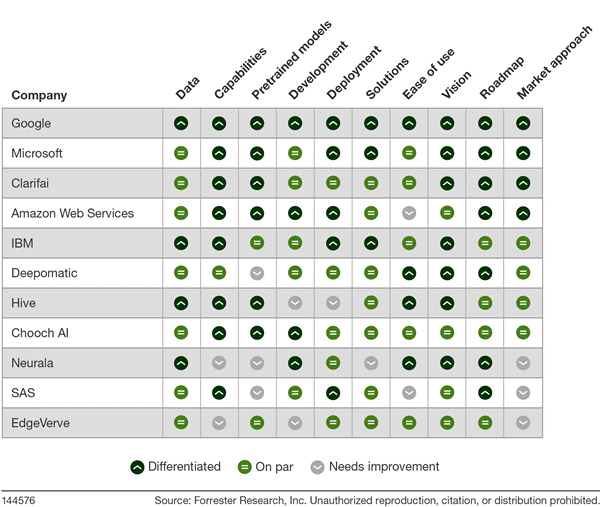
Its report details its findings about how well each vendor scored against 10 criteria and where they stand in relation to each other.
Google Cloud was classified as “differentiated” (the highest class) across all 10 criteria.
Find out more. Download The Forrester New Wave™: Computer Vision Platforms, Q4 2019.
The Latest in Spring Cloud GCP: Upgrading the Sample Bank of Anthos App

1410
Of your peers have already read this article.
3:30 Minutes
The most insightful time you'll spend today!
We’re excited to announce that Spring Cloud GCP version 4.0 is now generally available! In this post, we’ll be describing what the new major version has to offer, and demonstrating the process of using the migration guide on one of our reference architectures, Bank of Anthos.
What’s new?
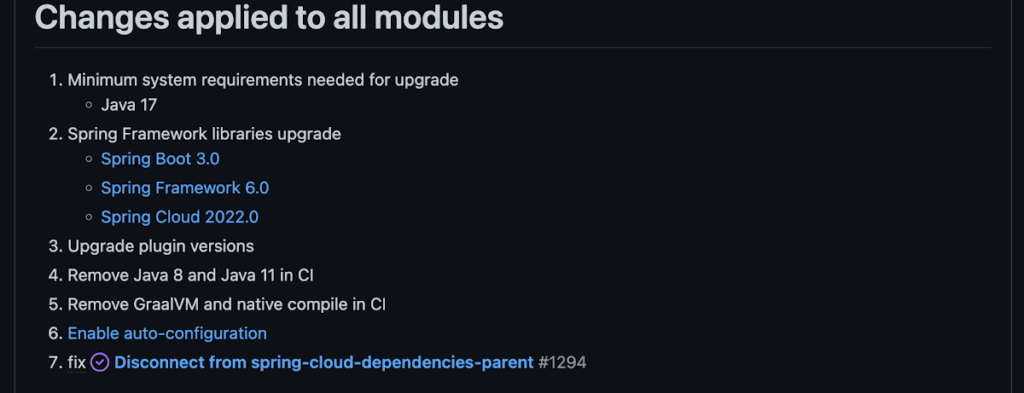
With this release, Spring Cloud GCP officially supports Spring Boot 3.x. However, this migration involves a number of breaking changes as outlined in the migration guide. The full list of changes made is available on Github, but the one of the most significant differences is that Java 17 is now a minimum requirement.
Another notable feature of this release is the addition of starter artifacts – Spring Boot starters for Google Cloud – that provide dependencies and auto-configurations for 80+ Google Client libraries. Just as the name suggests, these starters can serve as helpful starting points when working with a new client library. For now, they’re in preview.
These starters are not included in the BOM by default and need to be added as a dependency to your project before they can be used. For example, if you wanted to get started with Cloud Text-to-Speech, you would include the following:
<dependency>
    <groupId>com.google.cloud</groupId>
    <artifactId>google-cloud-texttospeech-spring-starter</artifactId>
    <version>4.0.0-preview</version>
  </dependency>
The upgrade process
We prepared a migration guide to help answer any questions involved with moving from 3.x to 4.x. Let’s follow those instructions to migrate Bank of Anthos.
We’ll start by cloning and building the application before the upgrade, according to the quickstart and development guide:
PROJECT_ID=<YOUR-PROJECT-ID>
gcloud services enable container --project ${PROJECT_ID}

git clone https://github.com/GoogleCloudPlatform/bank-of-anthos.git
cd bank-of-anthos/

gcloud services enable container.googleapis.com monitoring.googleapis.com \
  --project ${PROJECT_ID}

REGION=us-central1
gcloud container clusters create-auto bank-of-anthos \
  --project=${PROJECT_ID} --region=${REGION}

gcloud container clusters get-credentials bank-of-anthos \
  --project=${PROJECT_ID} --region=${REGION}

skaffold run --default-repo=gcr.io/${PROJECT_ID}/bank-of-anthos
At the end of this, you should see a “deployment stabilized” message:
Deployments stabilized in 9.657 secondsWith the environment set up for development, we’re ready to move on to the actual migration. The migration is already complete at time of writing, but here’s the full list of changes made:
- We began by checking the current Java, Spring Boot and Spring Cloud GCP versions.
- Our Java version is okay, but the other two are out of date, and will need to be updated.
We can also add the Spring Cloud GCP BOM to manage our versions going forward while we’re here.
- Our Java version is okay, but the other two are out of date, and will need to be updated.
- Then, in no particular order, we can make the following code changes:
- Remove the explicit type declarations from our ResponseEntity instantiations.
- Replace all javax.* imports with Jakarta.* counterparts, since Spring 3.0 makes use of Jakarta EE 9.0
With those changes in place, the app is upgraded and ready to re-deploy!
Live example
For a finished example of this migration, check out the Bank of Anthos repository on Github. It’s an excellent sample application that showcases a polyglot Java & Python app, served on Kubernetes and Google Cloud. All CI/CD and configurations are open source, so it may be instructive as you approach this migration.
Thanks for reading, and feel free to provide comments or feedback on Twitter, or in the issues section of the repository.
More Relevant Stories for Your Company

How to Decide Whether to Run a Database on Kubernetes
Today, more and more applications are being deployed in containers on Kubernetes—so much so that we’ve heard Kubernetes called the Linux of the cloud. Despite all that growth on the application layer, the data layer hasn’t gotten as much traction with containerization. That’s not surprising, since containerized workloads inherently have

APIs and IT Rationalization: Cost Avoidance and Cost Savings for Enterprise IT
The dynamic and fast-moving business environments of today demands that technology leaders and teams deliver more at a lightning speed, all the while working within the constraints of shoe-string budgets and tight project timelines. Winning in today’s environment requires a more strategic approach to optimize utilization of resources, remove unnecessary

A French News Company’s Web Modernization Journey with Cloud Run
Editor's note: Today's post documents the solution to a problem of how to scale website infrastructure as it moves from on-prem to the cloud. It is the result of collaboration between technical teams of Les Echos Le Parisien Annonces (a division of Groupe Les Echos, subsidiary company of LVMH) and

How Cloud Networks Enable CSPs to Deliver 5G
Communication services providers (CSPs) are experiencing a period of disruption. Overall revenue growth is decelerating and is projected to remain below 1 percent per year, following a trend that started even before the pandemic.1 At the same time, driven by the pandemic, data consumption in 2020 increased by 30 percent relative
