





Enhancing Data Governance through Automation with Dataplex and BigLake

2999
Of your peers have already read this article.
2:00 Minutes
The most insightful time you'll spend today!
Unlocking the full potential of data requires breaking down the silo between open-source data formats and data warehouses. At the same time, it is critical to enable data governance team to apply policies regardless of where the data happens, whether – on file or columnar storage.
Today, data governance teams have to become subject matter experts on each storage system the corporate data happens to reside on. Since February 2022, Dataplex has offered a unified place to apply policies, which are propagated across both lake storage and data warehouses in GCP. Rather than specifying policies in multiple places, bearing the cognitive load of translating policies from “what you want the storage system to do” to “how your data should behave” Dataplex offers a single point for unambiguous policy management. Now, we are making it easier for you to use BigLake.
Earlier this year, we launched BigLake into general availability, BigLake unifies data fabric between Data Lakes and Data Warehouses by extending BigQuery storage to open file formats. Today, we announce BigLake Integration with Dataplex (available in preview). This integration eliminates the configuration steps for the admin taking advantage of BigLake and managing policies across GCS and BigQuery from a unified console.
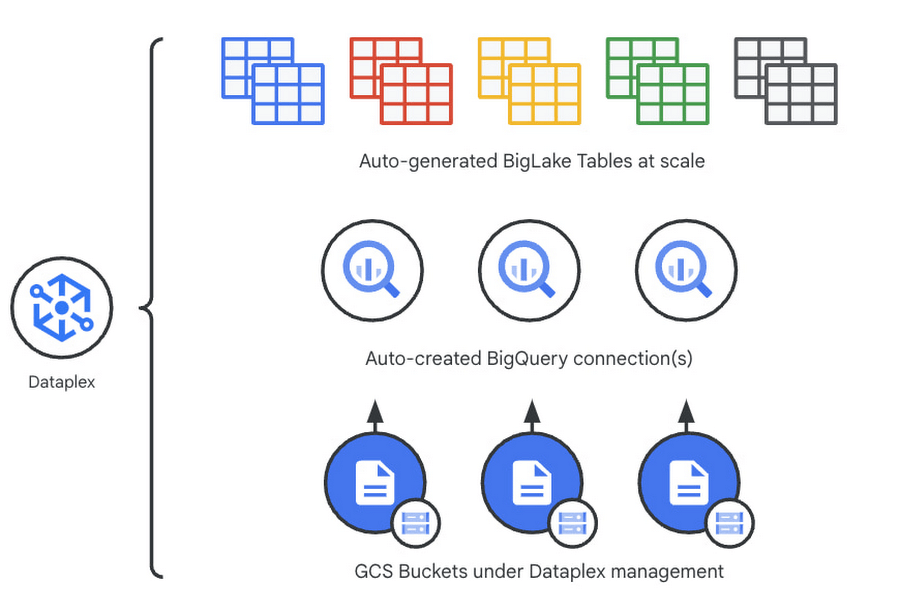
Previously, you could point Dataplex at a Google Cloud Storage (GCS) bucket, and Dataplex will discover and extract all metadata from the data lake and register this metadata in BigQuery (and Dataproc Metastore, Data Catalog) for analysis and search. With the BigLake integration capability, we are building on this capability by allowing an “upgrade” of a bucket asset, and instead of just creating external tables in BigQuery for analysis – Dataplex will create policy-capable BigLake tables!
The immediate implication is that admins can now assign column, row, and table policies to the BigLake tables auto-created by Dataplex, as with BigLake – the infrastructure (GCS) layer is separate from the analysis layer (BigQuery). Dataplex will handle the creation of a BigQuery connection and a BigQuery publishing dataset and ensure the BigQuery service account has the correct permissions on the bucket.
But wait – there’s more.
With this release of Dataplex, we are also introducing advanced logging called governance logs. Governance logs allow tracking the exact state of policy propagation to tables and columns – adding an additional level of detail going beyond the high-level “status” for the bucket and into fine-grained status and logs for tables, columns.
What’s next?
- We have updated our documentation for managing buckets and have additional detail regarding policy propagation and the upgrade process.
- Stay tuned for an exciting roadmap ahead, with more automation around policy management.
For more information, please visit:
How Google Cloud & NGIS’ Partnership Powers Sustainability & Responsible Sourcing for Consumer Brands

6208
Of your peers have already read this article.
2:00 Minutes
The most insightful time you'll spend today!
In the competitive world of consumer goods, sustainability matters more than ever. In recent Google survey, 82% of consumers said sustainability is more top of mind now than it was before COVID-191 and 78% said that big businesses have a role to play in helping to fight climate change.2 As well as delivering on customers’ heightened expectations, sustainable business practices can help organizations reduce waste and lower operational costs and even help attract top talent.
Not only is sustainability good for business performance and the bottom line, it’s great for the planet, too. And it’s something we care deeply about at Google. Since our earliest days, we have focused on developing services that significantly improve the lives of billions of people while operating our business in an environmentally sustainable way. In 2007, we were the first major company to become carbon neutral, and in 2017 we were the first to achieve 100% renewable energy. Today, we proudly operate the cleanest cloud in the industry. We’ve also been powering humanitarian, scientific, and environmental initiatives studying geospatial information and making it available for analysis via Google Earth Engine.
Powering the future of responsible sourcing
How does all this relate to CPG supply chains? The world relies on raw materials like palm oil, soy, and cocoa to produce the items we consume every day—such as coffee, chocolate, frozen foods, shampoo, toothpaste, cosmetics, and even household cleaning products. Yet as demand for these materials continues to grow, forests are under threat. Change is needed.
As sustainability moves further into the spotlight, in-demand crops face increased supplier scrutiny. Environmentally conscious companies want to know what percentage of their raw materials is sourced from deforestation-free suppliers—and how they can improve that number. Until recently, many CPG brands have found it hard to get real-time, reliable visibility into operations at a local supplier level, globally.
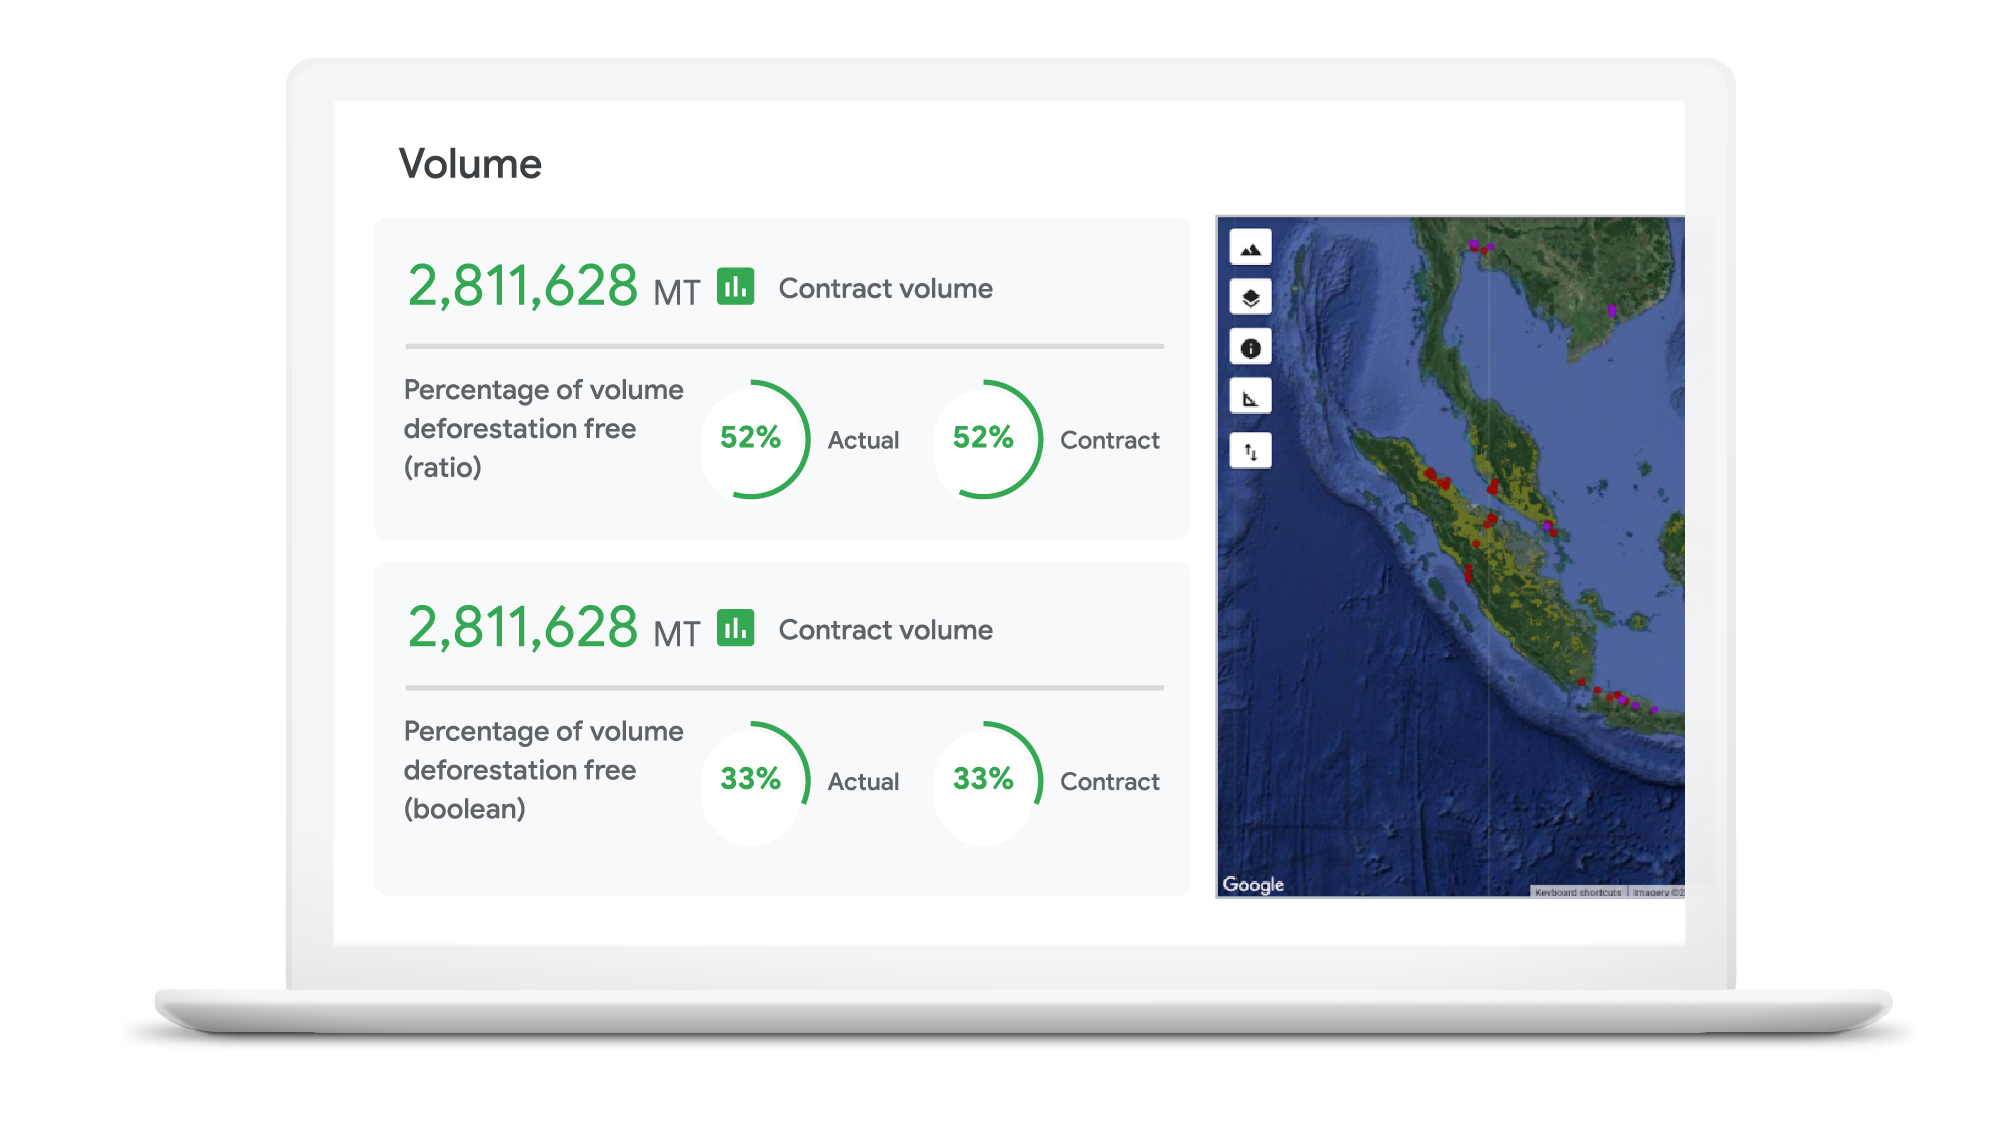
Google Cloud, in partnership with NGIS, is helping brands gain a deeper understanding of raw material sourcing practices across supplier networks, so they can improve supplier performance and compliance in the fight against deforestation. The TraceMark solution, developed by NGIS, uses Google Earth Engine and BigQuery to analyze and visualize how suppliers behave over time.
Google Earth Engine is the world’s largest archive of open Earth data. It combines a multi-petabyte catalog of satellite imagery and geospatial datasets with planetary-scale analysis capabilities to help people detect changes, map trends, and quantify differences on the Earth’s surface.With Earth Engine, organizations can analyze the potential social, and environmental impacts of the decision they make.
Together, TraceMark, Google Earth Engine and BigQuery help companies visualize, monitor, and measure the impact of suppliers’ farming practices. The process starts with Earth Engine, which aggregates and harmonizes planetary data into images that it has been collecting for decades. Then, boundary maps for different suppliers are created and NGIS applies climate data science and machine learning to turn pixels into insights. Finally, BigQuery and Vertex AI -Google Cloud’s unified artificial intelligence platform are used to produce supplier scoring, which is integrated into downstream ERP and procurement systems to support more informed decision-making.
These efforts support the responsible sourcing of raw materials by making supply chains more agile, transparent and traceable.
“NGIS is thrilled to work with Google Cloud and its partners to enable business accountability for sustainable practices at all levels of their supply chain,” said Nathan Eaton, Executive Director, NGIS. “Google Earth Engine provides unique geospatial capability that [gives] leaders visibility and control over their environmental footprint and that of their suppliers in a way that was not previously possible.”
Unilever commits to working towards a deforestation-free supply chain
Unilever is a great example of a company committed to using technology in the quest to become more sustainable. Since 2020, Unilever has partnered with Google Cloud to use data for eco-friendly decision-making, particularly when it comes to sustainable commodity sourcing.
By combining the power of cloud computing with satellite imagery and AI, we’re helping Unilever build a more holistic view of the forests, water cycles, and biodiversity that intersect its supply chain. By gaining a complete picture of these ecosystems, Unilever can detect deforestation while simultaneously prioritizing critical areas of forest and habitats in need of protection.
The cleanest cloud for your sustainable transformation
We are excited to bring Google Earth Engine and NGIS to our CPG customers to help them meet their sustainability goals. Looking ahead, we’re committed to furthering our own ambitious sustainability goals and empowering CPG brands with the technology to do more for our environment and our shared future.
Contact your cloud seller to learn more about Tracemark sustainable sourcing solutions and how Google Cloud can help you advance your sustainability initiatives.
Explore TraceMark on the Google Cloud Marketplace
To know more about how we are helping CPGs transform digitally read this ebook
1. Google/C Space, BR, FR, DE, IN, MX, U.K., U.S., qualitative survey activity, n = 528, Nov. 24–Nov. 26, 2020.
2. Google/Ipsos, Google Sustainability, BR, FR, DE, IN, JP, U.K., U.S., n=16,959 online population 18–70, July 2021.
Become Truly Data-driven with Unified Analytics Platform Built on Google Cloud

3675
Of your peers have already read this article.
2:00 Minutes
The most insightful time you'll spend today!
Every company these days is becoming a data company whether they know it or not. This results in preparing the company to create an ecosystem for data processing. Traditionally, organisations’ data ecosystems consisted of point solutions that used to provide data services. For example, one of the most common questions we get from customers is, “Do I need a data lake, or should I consider a data warehouse? Do you recommend I consider both?” Traditionally, these two architectures have been viewed as separate systems, applicable to specific data types and user skill sets. Increasingly, we are seeing a blurring of lines between data warehouses and data lakes, which provide customers with an opportunity to create a more comprehensive platform that gives them the best of both worlds.
What if we don’t need to compromise? And we create an end-to-end solution compromising the entire data management and processing stages, from data collection to serving. Thus, Data platforms are typically used to store vast amounts of data in varying formats and doing so without compromising on latency. At the same time, providing a platform for all users throughout the data lifecycle.
Emerging Trends
There are data solutions and architectures we’re seeing and anticipating. Emerging concepts include data lakehouses, data meshes, and data vaults. Some are not new and have been around in different shapes and formats, however, all of them work naturally within a Google Cloud environment. Lets look into both ends of the spectrum of enabling data and enabling teams.
Data mesh facilitates a decentralized approach to data ownership, allowing individual lines of business to publish and subscribe to data in a standardized manner, instead of forcing data access and stewardship through a single, centralized team. On the other hand, a data lake house brings raw and processed data closer together, allowing for a more streamlined and centralized repository of data needed throughout the organization. Processing can be done in transit via ELT, reducing the need to copy datasets across systems. This allows for easier data exploration and easier governance. Data vault is designed to separate data driven and model driven parts, so the way data is integrated in the raw vault enables parallel loading so that large implementations can scale out easily.
In Google Cloud, there is no need to keep them separate. In fact, with interoperability among our portfolio of data analytics products, you can easily provide access to data residing in different places, effectively bringing your data lake and data warehouse together on a single platform.
Let’s look at some of the technological innovations that make this reality. BigQuery’s storage API allows treating a data warehouse like a data lake, letting you access the data residing in BigQuery. For example, you can use Spark to access data residing in the data warehouse without it affecting performance of any other jobs accessing it. This is all made possible by the underlying architecture, which separates compute and storage.
We continue to offer specialized products and solutions around data lake and data warehouse functionality but over time we expect to see a significant enough convergence of the two systems that the terminology will change. At Google Cloud, we consider this combination an “analytics data platform”.
Tactical or Strategical
Key differentiators of Google Cloud’s data analytics platform are being open, intelligent, flexible, and tightly integrated. There are many technologies in the market which provide tactical solutions that may feel comfortable and familiar. However, this can be a rather short-term approach that simply lifts and shifts a siloed solution into the cloud. In contrast, an analytics data platform built on Google Cloud provides modern data warehousing and data lake capabilities with close integration to our AI Platform. It also provides built-in streaming, ML, and geospatial capabilities and an in-memory solution for BI use cases. Depending on your organizational data needs, Google Cloud has the set of products, tools, and services to create the right data platform for you.
To become a truly data-driven organization, the first step is to design and implement an analytics data platform that meets your technical and business needs. Whether you want to empower teams to own, publish, and share their data across the organization, or you want to create a streamlined store of raw and processed data for easier discovery, there is a solution that best meets the needs of your company.
To learn more about the elements of a unified analytics data platform built on Google Cloud, and the differences in platform architectures and organizational structures, read our Unified Analytics Platform paper.
Analytics Hub for Secure Data Sharing and Analytics Unlocks True Data Value and Insights

6758
Of your peers have already read this article.
2:30 Minutes
The most insightful time you'll spend today!
Customers tell us that sharing and exchanging data with other organizations is a critical element of their analytics strategy, but it’s hamstrung by unreliable data and processes, and only getting harder with security threats and privacy regulations on the rise.
Furthermore, traditional data sharing techniques use batch data pipelines that are expensive to run, create late arriving data, and can break with any changes to the source data. They also create multiple copies of data, which brings unnecessary costs and can bypass data governance processes. These techniques do not offer features for data monetization, such as managing subscriptions and entitlements. Altogether, these challenges mean that organizations are unable to realize the full potential of transforming their business with shared data.
To address these limitations, we are introducing Analytics Hub, a new fully managed service, available in Q3, in preview, that helps you unlock the value of data sharing, leading to new insights and increased business value. With Analytics Hub you get:
- A rich data ecosystem by publishing and subscribing to analytics-ready datasets.
- Control and monitoring over how your data is being used, because data is shared in one place.
- A self-service way to access valuable and trusted data assets, including data provided by Google. For example, a unique dataset from Google Search Trends will be available, that you can query and combine with your own data.
- An easy way to monetize your data assets without the overhead of building and managing the infrastructure.
Built on a decade of cross-organizational sharing
While Analytics Hub is a new service, it builds on BigQuery, Google’s petabyte-scale, serverless cloud data warehouse. BigQuery’s unique architecture provides separation between compute and storage, enabling data publishers to share data with as many subscribers as you want without having to make multiple copies of your data. With BigQuery, there are no servers to deploy or manage, which means that data consumers get immediate value from shared data. Data can be provided and consumed in real-time using the streaming capabilities of BigQuery and you can leverage the built in machine learning, geospatial, and natural language capabilities of BigQuery or take advantage of the native business intelligence support with tools like Looker, Google Sheets, and Data Studio.
BigQuery has had cross-organizational, in-place data sharing capabilities since it was introduced in 2010. We took a look at usage metrics in BigQuery and found that over a 7 day period in April, we had over 3,000 different organizations sharing over 200 petabytes of data. These numbers don’t include data sharing between departments within the same organization.
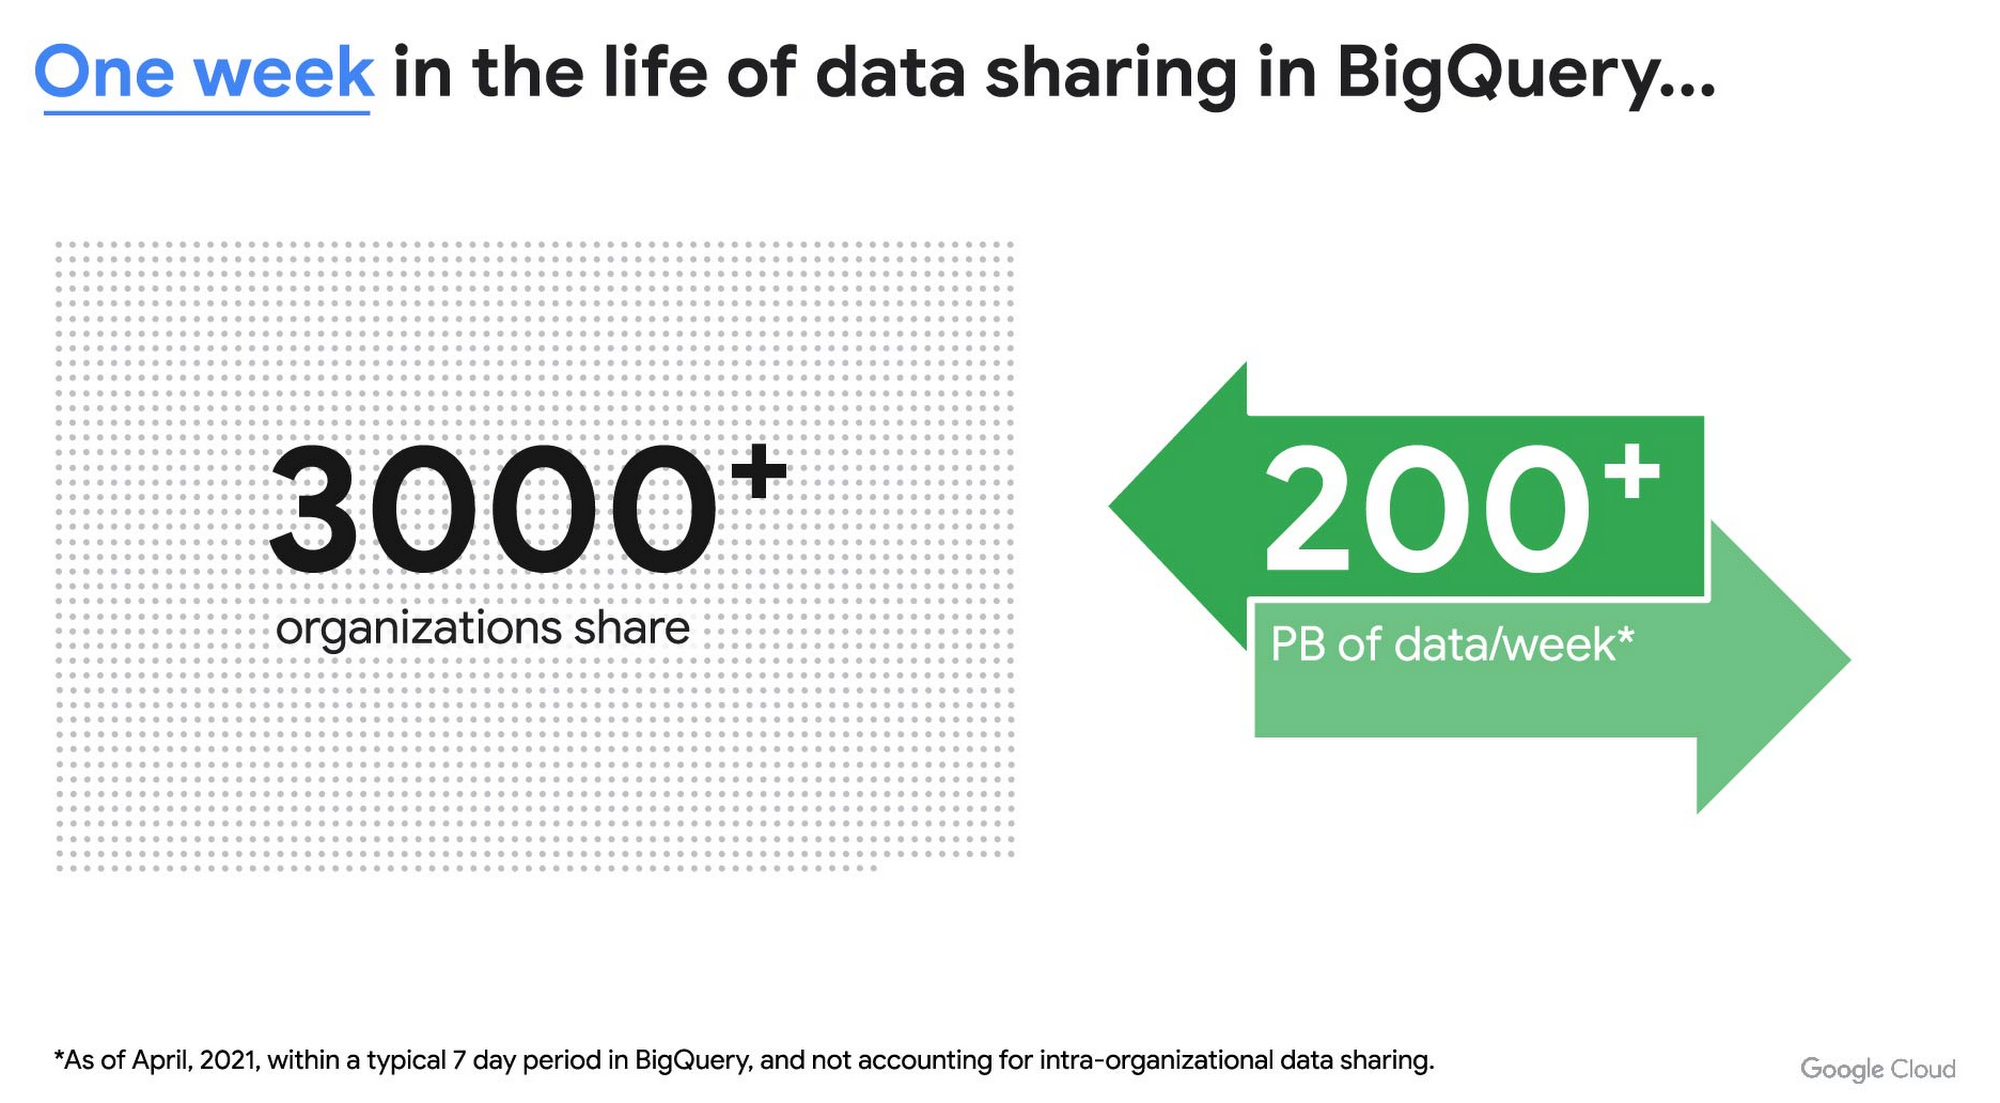
As you can see, data sharing in BigQuery is already popular. But we want to make it easier and even more scalable.
Raising the bar on data sharing
To make data sharing easier and more scalable in BigQuery, Analytics Hub introduces the concepts of shared datasets and exchanges. As a data publisher, you create shared datasets that contain the views of data that you want to deliver to your subscribers. Next, you create exchanges, which are used to organize and secure shared datasets. By default, exchanges are completely private, which means that only the users and groups that you give access to can view or subscribe to the data. You can also create internal exchanges or leverage public exchanges provided by Google. Finally, you publish shared datasets into an exchange to make them available to subscribers.
Data subscribers search through the datasets that are available across all exchanges for which they have access and subscribe to relevant datasets. This creates a linked dataset in their project that they can query and join with their own data. Subscribers pay for the queries that they run against the data while the publisher pays for the storage of the data. Data providers can add new data, new tables, or new columns to the shared dataset and these will be immediately available to subscribers. In addition, the publisher can track subscribers, disable subscriptions, and see aggregated usage information for the shared data.
Analytics Hub makes it easy for you to publish, discover, and subscribe to valuable datasets that you can combine with your own data to derive unique insights. Here are some types of data that will be available through Analytics Hub:
- Public datasets: Easy access to the existing repository of over 200 public datasets, including data about weather and climate, cryptocurrency, healthcare and life sciences, and transportation.
- Google datasets: Unique, freely-available datasets from Google. One example of this is the COVID-19 community mobility dataset. Another example is the forthcoming Google Trends dataset, which will provide the top 25 search terms and top 25 rising search terms over a 5 year window in 210 distinct locations in the US. Trends data can be used by everyone in the organization to gain insights into what customers care about.
- Commercial (paid for) datasets: We are working with leading commercial data providers to bring their data products to Analytics Hub. If you are interested in delivering your data via Analytics Hub, we’re also introducing Data Gravity, an initiative that provides storage benefits and new distribution paths for data published through Analytics Hub.
- Internal datasets: We know that data sharing can be challenging in larger organizations. Analytics Hub can be used for internal data, for example, to share standardized customer demographics with your sales engineering and data science teams.
Customers and partners using Analytics Hub

“Google Search Trends data has always been an important tool for our WPP agency data teams. At WPP we believe that data variety is a superpower which is why we are excited to use the new Trends dataset availability within BigQuery, plus the launch of Analytics Hub. The best creativity in the world is informed by data insights, and influenced by what people search for, so the operational efficiencies we’ll gain via the Analytics Hub and the insights we can drive with Trends data are just phenomenal.”
—Di Mayze Global Head of Data and AI, WPP

“Equifax Ignite is our shared data analytics environment within our Equifax data fabric. We are excited to partner with Google to leverage Analytics Hub and BigQuery to deliver data to over 400 statisticians and data modelers as well as securely sharing data with our partner financial institutions.”
—Kumar Menon, SVP Data Fabric and Decision Science, Equifax

“The flow of data and insights between our teams at Deloitte and our clients is paramount for building truly transformational data cultures. With its purpose-built architecture for secure data exchanges and sharing analytics resources, Google Cloud’s Analytics Hub can help provide significant operational efficiencies for how Deloitte teams support our clients’ data-driven initiatives within their industry ecosystems. It will also help minimize the worries about scale, privacy and security, or the administrative burden associated with each.”
—Navin Warerkar, Managing Director, Deloitte Consulting LLP, and US Google Cloud Data & Analytics GTM Lead

“Crux Informatics is proud to partner with Google to support the launch of Analytics Hub, removing friction for those who need access to analytics-ready data. With thousands of datasets from over 140 sources, Crux Informatics will accelerate access to data on Analytics Hub and together provide a more efficient and cost effective solution to deliver datasets in Google Cloud’s ecosystem.”
—Will Freiberg, CEO, Crux Informatics
Next steps for Analytics Hub
This is just the beginning for Analytics Hub. As we get to preview and general availability, we will be adding additional capabilities, including workflows for publishing and subscribing, publishing analytics assets (Looker Blocks, Data Studio reports, Connected Google Sheets) along with the shared data, the ability for data publishers to specify query restrictions on the usage of their data, and making it easy for data publishers to create sandbox environments for subscribers to work with their data, even if they are not yet on Google Cloud. We will provide features in Analytics Hub for monetization of data, including managing subscriptions, data entitlements, and billing.
Please sign up for the preview, which is scheduled to be available in the third quarter of 2021. In the meantime, you can learn more about BigQuery and how to leverage its built-in data sharing capabilities. Please go to g.co/cloud/analytics-hub to register your interest in Analytics Hub.
BigQuery ML for Sentiment Analysis: How to Make the Most of Your Data

1817
Of your peers have already read this article.
4:30 Minutes
The most insightful time you'll spend today!
Introduction
We recently announced BigQuery support for sparse features which help users to store and process the sparse features efficiently while working with them. That functionality enables users to represent sparse tensors and train machine learning models directly in the BigQuery environment. Being able to represent sparse tensors is a useful feature because sparse tensors are used extensively in encoding schemes like TF-IDF as part of data pre-processing in NLP applications and for pre-processing images with a lot of dark pixels in computer vision applications.
There are numerous applications of sparse features such as text generation and sentiment analysis. In this blog, we’ll demonstrate how to perform sentiment analysis with the space features in BigQuery ML by training and inferencing machine learning models using a public dataset. This blog also highlights how easy it is to work with unstructured text data on BigQuery, an environment traditionally used for structured data.
Using sample IMDb dataset
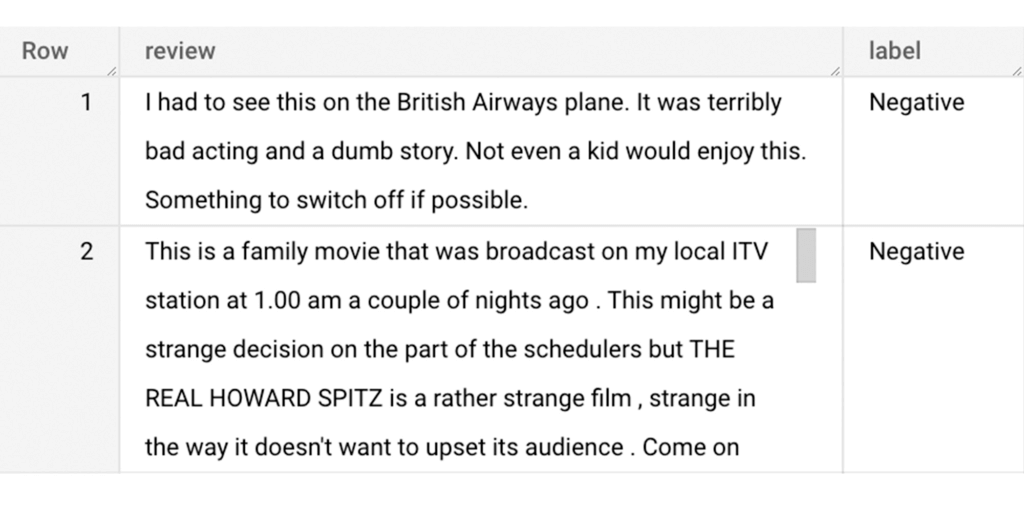
Let’s say you want to conduct a sentiment analysis on movie reviews from the IMDb website. For the benefit of readers who want to follow along, we will be using the IMDb reviews dataset from BigQuery public datasets. Let’s look at the top 2 rows of the dataset.
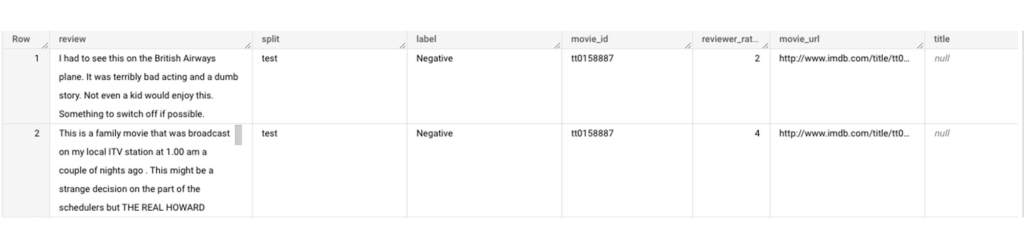
Although the reviews table has 7 columns, we only use reviews and label columns to perform sentiment analysis for this case. Also, we are only considering negative and positive values in the label columns. The following query can be used to select only the required information from the dataset.
SELECT
 review,
 label,
FROM
 `bigquery-public-data.imdb.reviews`
WHERE
 label IN ('Negative', 'Positive')
The top 2 rows of the result is as follows:
Methodology
Based on the dataset that we have, the following steps will be carried out:
- Build a vocabulary list using the review column
- Convert the review column into sparse tensors
- Train a classification model using the sparse tensors to predict the label (“positive” or “negative”)
- Make predictions on new test data to classify reviews as positive or negative.
Feature engineering
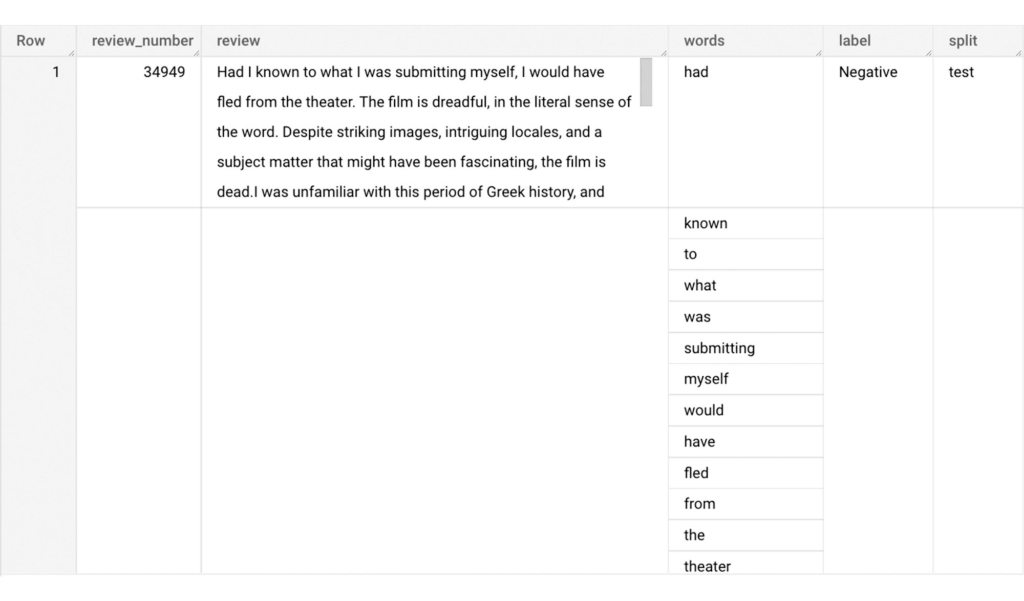
In this section, we will convert the text from the reviews column to numerical features so that we can feed them into a machine learning model. One of the ways is the bag-of-words approach where we build a vocabulary using the words from the reviews and select the most common words to build numerical features for model training. But first, we must extract the words from each review. The following code creates a dataset and a table with row numbers and extracted words from reviews.
-- Create a dataset named `sparse_features_demo` if doesn’t exist
CREATE SCHEMA IF NOT EXISTS sparse_features_demo;


-- Select unique reviews with only negative and positive labels
CREATE OR REPLACE TABLE sparse_features_demo.processed_reviews AS (
 SELECT
   ROW_NUMBER() OVER () AS review_number,
   review,
   REGEXP_EXTRACT_ALL(LOWER(review), '[a-z]{2,}') AS words,
   label,
   split
 FROM (
   SELECT
     DISTINCT review,
     label,
     split
   FROM
     `bigquery-public-data.imdb.reviews`
   WHERE
     label IN ('Negative', 'Positive')
 )
);
The output table from the query above should look like this:
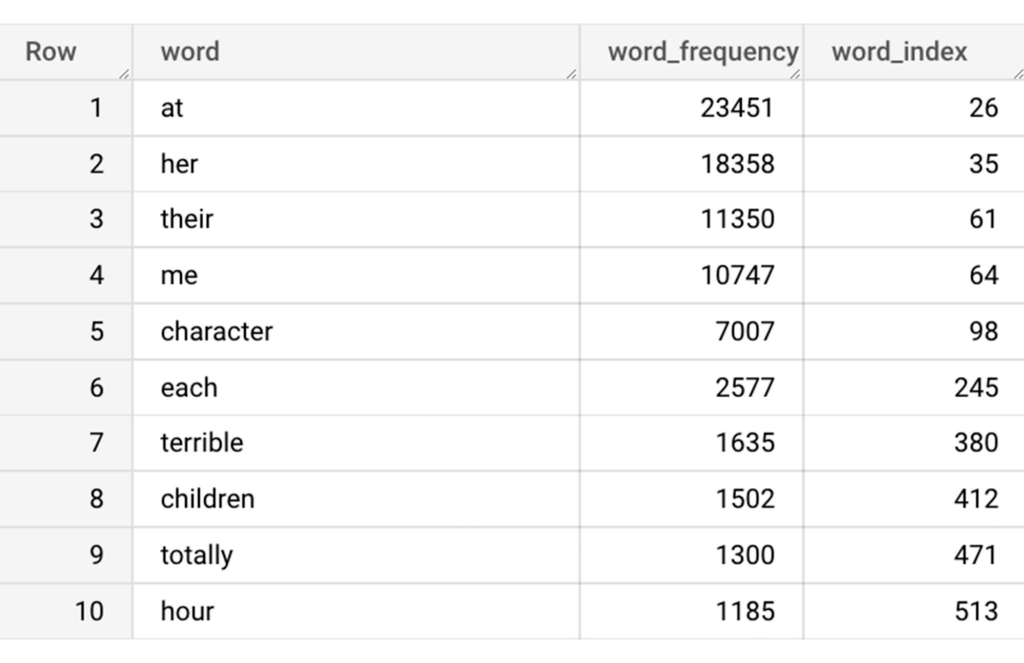
The next step is to build a vocabulary using the extracted words. The following code creates a vocabulary including word frequency and word index from reviews. For this case, we are going to select only the top 20,000 words to reduce the computation time.
-- Create a vocabulary using train dataset and select only top 20,000 words based on frequency
CREATE OR REPLACE TABLE sparse_features_demo.vocabulary AS (
 SELECT
   word,
   word_frequency,
   word_index
 FROM (
   SELECT
     word,
     word_frequency,
     ROW_NUMBER() OVER (ORDER BY word_frequency DESC) - 1 AS word_index
   FROM (
     SELECT
       word,
       COUNT(word) AS word_frequency
     FROM
       sparse_features_demo.processed_reviews,
       UNNEST(words) AS word
     WHERE
       split = "train"
     GROUP BY
       word
   )
 )
 WHERE
   word_index < 20000 # Select top 20,000 words based on word count
);
The following shows the top 10 words based on frequency and their respective index from the resulting table of the query above.
Creating a sparse feature
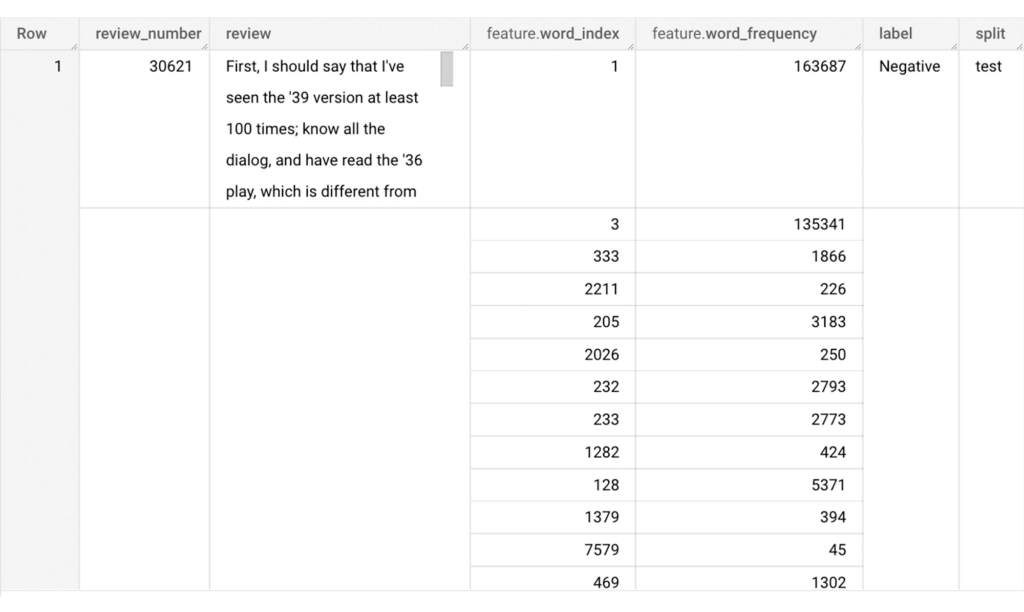
Now we will use the newly added feature to create a sparse feature in BigQuery. For this case, we aggregate word_index and word_frequency in each review, which generates a column as ARRAY[STRUCT] type. Now, each review is represented as ARRAY[(word_index, word_frequency)].
-- Generate a sparse feature by aggregating word_index and word_frequency in each review.
CREATE OR REPLACE TABLE sparse_features_demo.sparse_feature AS (
 SELECT
   review_number,
   review,
   ARRAY_AGG(STRUCT(word_index, word_frequency)) AS feature,
   label,
   split
 FROM (
   SELECT
     DISTINCT review_number,
     review,
     word,
     label,
     split
   FROM
     sparse_features_demo.processed_reviews,
     UNNEST(words) AS word
   WHERE
     word IN (SELECT word FROM sparse_features_demo.vocabulary)
 ) AS word_list
 LEFT JOIN
   sparse_features_demo.vocabulary AS topk_words
   ON
     word_list.word = topk_words.word
 GROUP BY
   review_number,
   review,
   label,
   split
);
Once the query is executed, a sparse feature named `feature` will be created. That `feature` column is an `ARRAY of STRUCT` column which is made of `word_index` and `word_frequency` columns. The picture below displays the resulting table at a glance.
Training a BigQuery ML model
We just created a dataset with a sparse feature in BigQuery. Let’s see how we can use that dataset to train with a machine learning model with BigQuery ML. In the following query, we will train a logistic regression model using the review_number, review, and feature to predict the label:
-- Train a logistic regression classifier using the data with sparse feature
CREATE OR REPLACE MODEL sparse_features_demo.logistic_reg_classifier
 TRANSFORM (
   * EXCEPT (
       review_number,
       review
     )
 )
 OPTIONS(
   MODEL_TYPE='LOGISTIC_REG',
   INPUT_LABEL_COLS = ['label']
 ) AS
 SELECT
   review_number,
   review,
   feature,
   label
 FROM
    sparse_features_demo.sparse_feature
 WHERE
   split = "train"
;
Now that we have trained a BigQuery ML Model using a sparse feature, we evaluate the model and tune it as needed.
-- Evaluate the trained logistic regression classifier
SELECT * FROM ML.EVALUATE(MODEL sparse_features_demo.logistic_reg_classifier);
The score looks like a decent starting point, so let’s go ahead and test the model with the test dataset.

-- Evaluate the trained logistic regression classifier using test data
SELECT * FROM ML.EVALUATE(MODEL sparse_features_demo.logistic_reg_classifier,
 (
   SELECT
     review_number,
     review,
     feature,
     label
   FROM
     sparse_features_demo.sparse_feature
   WHERE
     split = "test"
 )
);
The model performance for the test dataset looks satisfactory and it can now be used for inference. One thing to note here is that since the model is trained on the numerical features, the model will only accept numeral features as input. Hence, the new reviews have to go through the same transformation steps before they can be used for inference. The next step shows how the transformation can be applied to a user-defined dataset.
Sentiment predictions from the BigQuery ML model
All we have left to do now is to create a user-defined dataset, apply the same transformations to the reviews, and use the user-defined sparse features to perform model inference. It can be achieved using a WITH statement as shown below.
WITH
 -- Create a user defined reviews
 user_defined_reviews AS (
   SELECT
     ROW_NUMBER() OVER () AS review_number,
     review,
     REGEXP_EXTRACT_ALL(LOWER(review), '[a-z]{2,}') AS words
   FROM (
     SELECT "What a boring movie" AS review UNION ALL
     SELECT "I don't like this movie" AS review UNION ALL
     SELECT "The best movie ever" AS review
   )
 ),


 -- Create a sparse feature from user defined reviews
 user_defined_sparse_feature AS (
   SELECT
     review_number,
     review,
     ARRAY_AGG(STRUCT(word_index, word_frequency)) AS feature
   FROM (
     SELECT
       DISTINCT review_number,
       review,
       word
     FROM
       user_defined_reviews,
       UNNEST(words) as word
     WHERE
       word IN (SELECT word FROM sparse_features_demo.vocabulary)
   ) AS word_list
   LEFT JOIN
     sparse_features_demo.vocabulary AS topk_words
     ON
       word_list.word = topk_words.word
   GROUP BY
     review_number,
     review
 )


-- Evaluate the trained model using user defined data
SELECT review, predicted_label FROM ML.PREDICT(MODEL sparse_features_demo.logistic_reg_classifier,
 (
   SELECT
     *
   FROM
     user_defined_sparse_feature
 )
);
Here is what you would get for executing the query above:
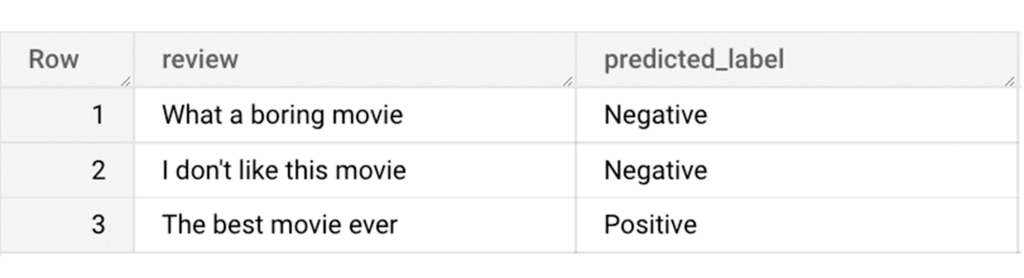
And that’s it! We just performed a sentiment analysis on the IMDb dataset from a BigQuery Public Dataset using only SQL statements and BigQuery ML. Now that we have demonstrated how sparse features can be used with BigQuery ML models, we can’t wait to see all the amazing projects that you would create by harnessing this functionality.
If you’re just getting started with BigQuery, check out our interactive tutorial to begin exploring.
Wunderkind Leverages Google Cloud to Address the Growing Needs of its Customer Base

5345
Of your peers have already read this article.
1:30 Minutes
The most insightful time you'll spend today!
Editor’s note: We’re hearing here how martech provider Wunderkind easily met the scaling demands of their growing customer base on multiple use cases with Cloud Bigtable and other Google Cloud data solutions.
Wunderkind is a performance marketing channel and we mostly have two kinds of customers: online retailers, and publishers like Gizmodo Media Group, Reader’s Digest, The New York Post and more. We help retailers boost their e-commerce revenue through real-time messaging solutions designed for email, SMS, onsite, and advertising. Brands want to provide a one-to-one experience to more of their customers, and we use our extensive history with best practices in email marketing and technology to help brands reach more customers through targeted messaging and personalized shopping experiences. With publishers, it’s a different value proposition, we use the same platform to provide a non disruptive and personalized ad experience for their website. For example, if you are on their site and then you left, we might show an ad tailored to you when you come back later – depending on the campaign.
After running into limitations with our legacy database system, we turned to Cloud Bigtable and Google Cloud, which helped us be more flexible and easily scale for high traffic demand – which can be a stable 40,000 requests per second, and meet the needs of our growing number of data use cases.
Three different databases power our core product
In our core offering, companies send us user events from their websites. We store these events and later decide (using our secret sauce) if and how to reach out to those users on behalf of our customers. Because many of our customers are retailers, Black Friday and Cyber Monday are big traffic days for us as. On such days, we can get 31 billion events, sometimes as many as 200K events per second. We show 1.6 billion impressions that have seen close to 1 billion pageviews. And at the end of all this, we securely send about 100 million emails. We noticed the same thing for election time; traffic reached the same high volume. We need scalable solutions to support this level of traffic as well as the elasticity to let us pay only for what we use, and that’s where Google Cloud comes in.
So how does this work? Our externally facing APIs, which are running on Google Kubernetes Engine, receive those user events—up to hundreds of thousand per second. All the components in our architecture need to be able to handle this demand. So from our APIs, those events go to Pub/Sub, Dataflow and from there they are written to Bigtable and BigQuery, Google Cloud’s serverless, and highly scalable data warehouse. This business user activity data underpins almost all our products. Events can be things like product views or additions to shopping carts. When we store this data in Bigtable, we use a combination of email address and the customer ID as the Bigtable key and we record the event details in that record.
What do we do with this information next? It’s important to mention that we also mark the last time we received an event about a user in Memorystore for Redis, Google Cloud’s fully managed Redis service. This is important because we have another service that is periodically checking Memorystore for users that have not been active for a campaign-specific period of time (it can be 30 minutes, for example), then deciding whether to reach out to them.
How we decide when we reach out is an intelligent part of our product offering, based on the channel, message, product, etc. When we do reach out, we use Memorystore for Redis as a rate limiter or token bucket. In order not to overwhelm the email or texting providers we send API requests to, we throttle those requests using Memorystore. (We prefer to preemptively throttle the outgoing API requests as opposed to handling errors later.)
When we do reach out, often we will need details for a specific product—let’s say if the website belongs to a retailer. We usually get that information from the retailer through various channels and we store product information in Cloud SQL for MySQL. We pull that information when we need to send an email with product information, and we use Memorystore for Redis to cache that information, since many of the products are repeatedly called. Our Cloud SQL instance has 16 vCPUs, 60GBs of memory and 0.5TB of disk space and when we perform those product information updates, we have about a thousand write transactions per second. We are also in the process of migrating some tables from a self managed MySQL instance, and we keep those tables synchronized with Cloud SQL using Datastream.
Our user history database was originally stored in AWS DynamoDB, but we were running into problems with how they structured the data, and we’d often get hot shards but with no way to determine how or why. That led to our decision to migrate to Bigtable. We set up the migration first by writing the data to two locations from Pub/Sub, performed some backfill of data until that was up and running, and then started working on the reading. We performed this over a few short months, then switched everything to Bigtable.
So, as mentioned, we are using Bigtable for multiple databases. The instance that stores our user events has about 30 TB with about 50 nodes.
Profile management
A second use case for Bigtable is for user profile management, where we track, for example, user attributes based on subscription activity, whether they’ve opted in or out of various lists, and where we apply list-specific rules that determine which targeted emails we send out to users.
Our very own URL shortener
Our third use case for Bigtable is our URL shortener. When our customers build out campaigns and choose a URL, we append tracking information to the query string of the URLs and they become long. Many times, we are sending them via SMS texts, so the URLs need to be short. We originally used an external solution, but made the determination that they couldn’t support our future demands. Our calls tend to be very bursty in nature, and we needed to plan for a future state of supporting higher throughput. We use a separate table in Bigtable for this shortened URL. We generate the short slug that is 62 bit-encoded and use it as the rowkey. We use the long slug as a Protobuf-encoded data structure in one of the row cells and we also have a cell for counting how many times it was used. We use Bigtable’s atomic increment to increase that counter to track how many times the short slug was used.
When the user receives a text message on their phone, they click the short URL, which goes through to us, and we expand it to the long slug (from Bigtable) and redirect them to the appropriate site location. Obviously, for the URL shortener use case, we need to make the conversion very quickly. Bigtable’s low latency helps us meet that demand and we can scale it up to meet higher throughput demands.
Meeting the future with Google Cloud
Our business has grown considerably, and as we keep signing up new clients, we need to scale up accordingly, and Bigtable has met our scaling demands easily. With Bigtable and other Google Cloud products powering our data architecture, we’ve met the demand of incredibly high traffic days in the last year, including Black Friday and Cyber Monday. Traffic for these events went much higher than expected, and Bigtable was there, helping us easily scale on demand.
We are working on leveraging a more cloud native approach and using Google Cloud managed services like GKE, Dataflow, pub/sub, Cloud SQL , Memorystore, BigQuery and more. Google has those 1st party products and we don’t see the value in rolling out or self managing such solutions ourselves..
Thanks to Google Cloud, we now have reliable and flexible data solutions that will help us meet the needs of our growing customer base, and delight their users with fast, responsive, personalized shopping messaging and experiences.
Learn more about Wunderkind and Cloud Bigtable. Or check out our recent blog exploring the differences between Bigtable and BigQuery.
More Relevant Stories for Your Company

ActivStat: Enhancing Live Sports Broadcast with Real-time Stats and Metrics
Millions of people annually view esports, as top players and teams compete in thrilling, fast-paced tests of reflexes, strategy, and teamwork. Fans are a diverse group, sharing a passion for action. A new, revolutionary project we’re working on with Call of Duty League just made that action a lot better.

Recommendations for Modelling SAP Data inside BigQuery
Over the past few years, many organizations have experienced the benefits of migrating their SAP solutions to Google Cloud. But this migration can do more than reduce IT maintenance costs and make data more secure. By leveraging BigQuery, SAP customers can complement their SAP investments and gain fresh insights by consolidating enterprise

5 Best Practices for Cloud Cost Optimization
When customers migrate to Google Cloud Platform (GCP), their first step is often to adopt Compute Engine, which makes it easy to procure and set up virtual machines (VMs) in the cloud that provide large amounts of computing power. Launched in 2012, Compute Engine offers multiple machine types, many innovative features, and is available in

Google Cloud Data Heroes Series: Honoring Data Practitioner’s Journey and Learning with GCP
Google Cloud Data Heroes is a series where we share stories of the everyday heroes who use our data analytics tools to do amazing things. Like any good superhero tale, we explore our Google Cloud Data Heroes’ origin stories, how they moved from data chaos to a data-driven environment, what
