





Architecting Data Pipelines Directly Improves Customer Experience at Universe.com

6111
Of your peers have already read this article.
3:30 Minutes
The most insightful time you'll spend today!
At Universe, we serve customers day and night and are always working to make sure they have a great experience, whether online or at one of our live events.
Our technology has to make that possible, and our legacy systems weren’t cutting it anymore. What we needed was a consistent, reliable infrastructure that would help our internal teams provide a fast and innovative ticket-buying experience to customers.
With our data well-managed, we could free up time for our developers to bring new web features to customers, like tailored add-ons at checkout.
Our team of about 20 software engineers needed more flexibility and agility in our infrastructure; we were using various data processing tools, and it wasn’t easy to share data across teams so that everyone saw the same information.
We also needed to incorporate streaming data into the data warehouse to ensure the consistency and integrity of data that’s read in a particular window of time from multiple sources. Our developer teams needed to be able to ship new features faster, and the data back ends were getting in the way.
In addition, when GDPR regulations went into effect, we needed to make sure all our data was anonymized, and we couldn’t do that with our legacy tools.
Finding the right data tools for the job
To make sure our customers were getting a top-notch online experience, we had to make the right technology choices.
Our first step was to centralize multiple data sources and create a single data warehouse that could serve as the foundation for all of our reporting requirements, both internal and external.
The new technology infrastructure we built had to let us move and analyze data easily, so our teams could focus on using that data and insights to better serve our customers.
Previously, we had lots of siloed systems and applications running in AWS. We did a trial using Redshift, but we needed more flexibility than it offered in how we loaded historical data into our cloud data warehouse. Though we were using MongoDB Atlas for our transactional database, it was important to continue using SQL for querying data.
The trial task that really sold us on BigQuery was when we wanted to alter a small table that had about 20 million rows, used for internal reporting.
We needed to add a value, but our PostgreSQL system wouldn’t allow it. Using Apache Beam, we set up a simple pipeline that moved data from the original source into BigQuery to see if we could add the column there.
BigQuery ingested the data and let us add the new value in seconds. That was a significant moment that led us to start looking at how we could build end-to-end solutions on Google Cloud. BigQuery gave us multiple options to load our historical data in batches and build powerful pipelines.
We also explored Google Cloud’s migration tools and data pipeline options. Once we saw how Cloud Dataflow worked, with its Apache Beam back-end, we never looked back. Google Cloud provided us with the data tools we needed to build our data infrastructure.
Cloud for data, and for users
Introducing new technologies isn’t always simple—companies sometimes avoid it altogether because it’s so hard. But our Google Cloud onboarding process has been easy.
It took us less than two months to fully deploy our BigQuery data warehouse using the Cloud Dataflow-Apache Beam combination.
Moving to Google Cloud brought us a lot of technology advantages, but it’s also been hugely helpful for our internal users and customers. The data analytics capabilities that we’re now able to offer users has really impressed our internal teams, including developers and DevOps, even those who haven’t used this type of technology before.
Some internal clients are already entirely self-service. We’ve hosted frequent demos, and also hosted some “hack days,” where we share knowledge with our internal teams to show them what’s possible.
We quickly found that BigQuery helped us solve scale and speed problems.
One of our main pain points had been adding upsell opportunities for customers during the checkout process. The legacy technology hadn’t allowed us to quickly reflect those changes in the data warehouse. With BigQuery, we’re able to do that, and devote fewer resources to making it happen. We’ve also eliminated the time we were spending tuning memory and availability, since BigQuery handles that. Database administration and tuning required specialized knowledge and experience and took up time. With BigQuery, we don’t have to worry about configuring that hardware and software. It just works.
We’ve also eliminated the time we were spending tuning memory and availability, since BigQuery handles that. Database administration and tuning required specialized knowledge and experience and took up time. With BigQuery, we don’t have to worry about configuring that hardware and software. It just works.
Two features in particular that we implemented using BigQuery have helped us improve the performance of our core transactional database. First, using Cloud Dataflow to convert raw MongoDB logs to structured rows under a BigQuery table, which we can then query using SQL to identify slow or underperforming queries. Second, we can now query multiple logging tables using wildcards, since we load Fastly logs to BigQuery.
Along with MongoDB Atlas as our main transactional database, much of our infrastructure now runs as Google Cloud microservices using Google Kubernetes Engine (GKE), including the home page and our payment system. Kubernetes cron jobs power background scheduled jobs, and we also use Cloud Pub/Sub. Cloud Storage handles any data storage if any space constraints emerge.
Our overall performance has increased by about 10x with BigQuery. Both our customers and internal clients, like our sales and finance teams, benefit from the new low-latency reporting. Reports that used to be weekly or monthly are now available in near-real time. It’s not only faster to read records, but faster to move the data, too.
We have Cloud Dataflow pipelines that write to multiple places, and the speed of moving and processing data is incredibly helpful. We stream in financial data using Cloud Dataflow in streaming mode, and plan to have different streaming pipelines as we grow. We have several batch pipelines that run every day. We can move terabytes of data without performance issues, and process more than 100,000 rows of data per second from the underlying database. It used to take us a month to move that volume of data into our data warehouse. With BigQuery, it takes two days.
We’re also enjoying how easy and productive these tools are. They make our life as software engineers easier, so we can focus on the problem at hand, not fighting with our tools.
What’s next for Universe
Our team will continue to push even more into Google Cloud’s data platform. We have plans to explore Cloud Datastore next. We’re also moving our databases to PostgreSQL on GCP, using Cloud Dataflow and Beam. BigQuery’s machine learning tools may also come into play as Universe’s cloud journey evolves, so we can start doing predictive analytics based on our data. We’re looking forward to gaining even more speed and agility to meet our business goals and customer needs.
Fairygoodboss and Google Cloud Tied to Advancing Diversity and Female Leadership at Workplaces

5129
Of your peers have already read this article.
2:00 Minutes
The most insightful time you'll spend today!
May is Asian American Pacific Islander Heritage Month — a time for us to come together to celebrate and remember the important people and history of Asian and Pacific Island heritage. This feature highlights founder Georgene Huang and how her startup Fairygodboss uses easy to use Google Cloud tools to grow and innovate.
Coming from a male-dominated industry like Wall Street, I never thought much about my gender. I was so focused on work that I didn’t feel like I could focus on my identity as a woman of color. That all changed when I found myself thrust into the job market while two months pregnant.
Traditionally, job-seeking sites are built by – and geared towards – men and their professional needs. There was no recruiting site that broke down what candidates who identify as women might expect from a company, let alone women of color like myself. I founded Fairygodboss to create a space where women can crowdsource information about opportunities and employers in order to make informed career decisions.
Fairygodboss
Fair•y•god•boss (noun): A person who elevates women at work.
Fairygodboss is the largest career community for women. In researching potential employers, I had many questions surrounding company culture, maternity leave, and women in leadership positions. While sites like Glassdoor provide high-level details for job seekers, I wanted more concrete examples and data than general salary information and anecdotes about work-life balance.
Fairygodboss began as a job review site geared towards women, but has expanded significantly since our initial launch. In addition to providing free resources like career connections, job listings, virtual recruiting events, community advice, and real research on how companies treat women, we also proactively help companies improve gender diversity. Fairygodboss partners with hundreds of top employers to create a 360-degree recruiting and employer branding program designed to drive female applicants to job postings by showcasing a company’s track record of women in leadership within a company, and their diversity investments.

Google Cloud + Fairygodboss: Data defined
At our core, Fairygodboss is a data-driven company, and we rely on Google Cloud to help us process, store, and analyze user-driven events occurring on the site. As a highly scalable, serverless, and cost-effective data warehousing solution, BigQuery collect millions of events each day, helping us identify where traffic is coming from (and where it goes next), and it produces actionable insights to provide better recommendations, information, and opportunities for women visiting our platform.
After seamlessly connecting our BigQuery data to Data Studio, we have been able to visualize and make sense of all the data we receive on our platform. Unlike some other data visualization tools, Data Studio allows us to analyze data in real time. With tools like BigQuery, we are now able to identify trends and gain a deep understanding for how our users interact with our site.
Google for Startups Accelerator: Women Founders
In order to provide more accurate job recommendations for our users, the Fairygodboss team wanted to build a machine learning prototype to classify our users and jobs into categories to facilitate more effective matching. So we applied for the Google for Startups Accelerator: Women Founders, a three-month digital accelerator program for high-potential Seed to Series A tech startups based in the U.S. and Canada. Along with tailored mentorship and product support from Googlers and industry experts, the Google for Startups Accelerator provided $100K in Google Cloud credits to scale our businesses. The mentorship we received from the Google Cloud technical experts as part of the Accelerator – special shout out to Peter Novig! – empowered us to integrate Cloud AutoML into our systems and ultimately curate more accurate job suggestions for our users.
Not only did the Google for Startups Accelerator program help to achieve our business goals for the year, it was also extremely beneficial to be connected with a cohort of other women founders of color. While we are all building different kinds of businesses across different industries, the guidance around fundraising, scaling teams, and coping with the struggles of being a founder rang true for all of us.
Advancing the community
It can be daunting to launch your own business – and even more so as an AAPI woman. Throughout my career, I am certain I have experienced unconscious bias around my race. Specifically, there have likely been “model minority” stereotypes about my demeanor and math abilities, assumptions that I may be mild-mannered or agreeable. While frustrating, these unfair tropes actually inspired me to see myself beyond others’ perceptions. Why be either analytical or creative, meek or brash, inspiring or agreeable? It’s the ors of life that prevent us from seeing ourselves as truly multi-dimensional individuals. I aspired to be more instead of or, and want my company to be as well.
As an inclusion-focused business, it is extremely important that Fairygodboss mindfully engage with all underrepresented groups. Diversity can be sliced in many different ways, and these intersections lead to great opportunities for change. We have a team of volunteer ‘culture wizards’ at work that provide educational resources and videos for those wanting to learn more about different cultures and identities from members of under-represented groups. We also practice what we preach at Fairygodboss by prioritizing diverse slates and diversity in our own hiring process. We aim for the talent we hire to be representative of the diverse communities we support. It is imperative to take an intentional approach to hiring diverse talent, as it falls on all employers to promote equity and inclusion—there are always ways in which we can all improve. Fairygodboss looks forward to evolving with Google Cloud in 2021 and beyond as we work together to foster inclusive teams around the world.
If you want to learn more about how Google Cloud can help your startup, visit our Startup Program application page here and sign up for our monthly startup newsletter to get a peek at our community activities, digital events, special offers, and more.
The Query Execution Graph: Your Key to Better BigQuery Analytics

3095
Of your peers have already read this article.
2:30 Minutes
The most insightful time you'll spend today!
BigQuery offers strong query performance, but it is also a complex distributed system with many internal and external factors that can affect query speed. When your queries are running slower than expected or are slower than prior runs, understanding what happened can be a challenge.
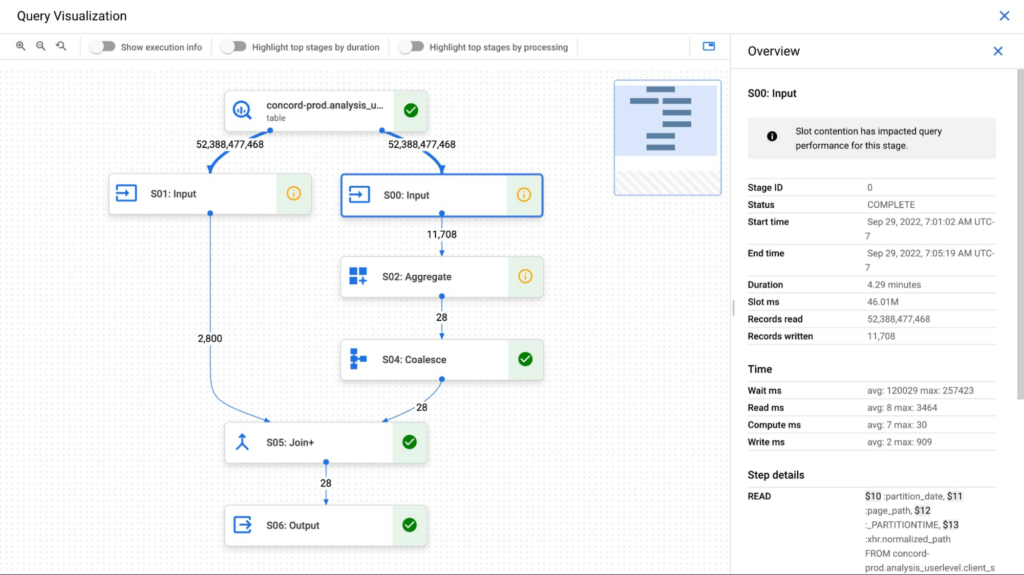
The query execution graph provides an intuitive interface for inspecting query execution details. By using it, you can review the query plan information in graphical format for any query, whether running or completed.
You can also use the query execution graph to get performance insights for queries. Performance insights provide best-effort suggestions to help you improve query performance. Since query performance is multi-faceted, performance insights might only provide a partial picture of the overall query performance.
Execution graph
When BigQuery executes a query job, it converts the declarative SQL statement into a graph of execution, broken up into a series of query stages, which themselves are composed of more granular sets of execution steps. The query execution graph provides a visual representation of the execution stages and shows the corresponding metrics. Not all stages are made equal. Some are more expensive and time consuming than others. The execution graph provides toggles for highlighting critical stages, which makes it easier to spot the potential performance bottlenecks in the query.
Query performance insights
In addition to the detailed execution graph BigQuery also provides specific insights on possible factors that might be slowing query performance.
Slot contention
When you run a query, BigQuery attempts to break up the work needed by your query into tasks. A task is a single slice of data that is input into and output from a stage. A single slot picks up a task and executes that slice of data for the stage. Ideally, BigQuery slots execute tasks in parallel to achieve high performance. Slot contention occurs when your query has many tasks ready for slots to start executing, but BigQuery can’t get enough available slots to execute them.
Insufficient shuffle quota
Before running your query, BigQuery breaks up your query’s logic into stages. BigQuery slots execute the tasks for each stage. When a slot completes the execution of a stage’s tasks, it stores the intermediate results in shuffle. Subsequent stages in your query read data from shuffle to continue your query’s execution. Insufficient shuffle quota occurs when you have more data that needs to get written to shuffle than you have shuffle capacity.
Data input scale change
Getting this performance insight indicates that your query is reading at least 50% more data for a given input table than the last time you ran the query and hence experiencing query slowness. You can use table change history to see if the size of any of the tables used in the query has recently increased.
What’s next?
We continue to work on improving the visualization of the graph. We are working on adding additional metrics to each step and adding more performance insights that will make query diagnosis significantly easier. We are just getting started.
4367
Of your peers have already watched this video.
7:00 Minutes
The most insightful time you'll spend today!
Baking Gets Sweeter: Build ML Models that Help Predict the Best Recipe!
Baking recipes and ML models have one thing in common—they follow a pattern. Machine Learning is all about finding pattern in data sets, you can predict what you are baking based on the core ingredients and their respective amounts! Bread, cake or cookies, watch the video to make you make your baking experiences and learning with ML sweeter.
AutoML Tables, a no-code Google Cloud tool for ML models analyzes data from the databases and spreadsheets to help creates an automatic stats and dashboard with lists of ingredients and their values to predict a new recipe. Watch more episodes from Making with Machine Learning.
How TeamSnap Improved Return on Ad Spend Significantly

5617
Of your peers have already read this article.
3:30 Minutes
The most insightful time you'll spend today!
Anyone who has ever coached or played on a sports team, or had a child involved in sports, knows how difficult scheduling and logistics can be. From game and practice schedules, to uniforms and who’s bringing the snacks, it can be a lot for coaches, administrators, parents, and players to manage.
It’s no wonder that TeamSnap, a sports team, club, and tournament management app, has exploded in popularity worldwide. By syncing events to everyone’s personal calendars and providing messaging and payment tracking, TeamSnap makes communication and organization easy.
TeamSnap markets its app to coaches, players, and clubs via targeted YouTube ads. It also uses Google AdWords and DoubleClick to advertise on search results and run programmatic campaigns. These methods have been highly effective, helping TeamSnap grow to millions of users worldwide and become one of the most popular apps in the iOS app store.
As its business and data grew, TeamSnap was challenged to track ROI and measure the customer journey across channels and devices over time. The company’s marketing budget grew quickly, making it even more important to spend wisely. With data in Google Analytics 360, DoubleClick Campaign Manager, Google AdWords, and Salesforce, TeamSnap needed a way to link and correlate those data sources in a scalable, timely, and cost-effective way to understand the true impact of its digital marketing across websites and mobile apps.
To avoid the painstaking manual process of pulling data from multiple sources, TeamSnap began using Google Analytics 360, which integrates with Google BigQuery, to provide a fully managed big data analysis service. TeamSnap analyzes the data using Tableau, which connects directly to Google BigQuery for fast analytics and helps the company share and collaborate on that information with self-service ease.
The combination allows TeamSnap to easily track the activity of millions of users with self-service ease, without worrying about the scalability or availability of the big data platform.
“Before Google Analytics 360, Google BigQuery, and Tableau, tracking our return on ad spend was difficult because we had so much data,” says Ken McDonald, Chief Growth Officer at TeamSnap. “We didn’t always have insights to make the best choices. We don’t have that problem anymore because we’ve moved to real-time reporting. We find additional revenue growth opportunities almost daily.”
Making Ad Dollars Work Harder
TeamSnap now automatically imports unsampled Google Analytics 360 logs into the Google BigQuery data warehouse. To import data from other sources such as Google AdWords, DoubleClick, and YouTube, TeamSnap uses Google BigQuery Data Transfer Service. With all relevant data consolidated in Google BigQuery, TeamSnap can use Tableau to perform advanced analytics on its digital marketing, executing ad-hoc analyses in seconds, while eliminating data sampling issues, to improve accuracy. These analyses can also be reused and shared with internal and external stakeholders via Tableau Online, promoting governed reuse and consistency.
“Using Google Analytics 360 and Google BigQuery with Tableau to track our return on ad spend is ideal,” says Ken. “It’s easy to use SQL to query the data or explore it with drag-and-drop ease.”
With Google BigQuery, Ken and his team can bring all the data from the TeamSnap billing systems, internal CRM, and other Google services into one straightforward dataset that everyone uses. With Tableau, users are able to perform self-service analytics on this data and provision analyses via shared dashboards that communicate the same consistent truth across the company. These dashboards provide a single view of the business to discover new patterns and questions worth analyzing.
All of this results in enormous time savings because no one is re-inventing the wheel. “Using these tools, we immediately reallocated $300,000 of ad spend that was performing poorly, generating 200% ROI in the first two days,” says Ken.
Ken now spends his time analyzing data instead of trying to pull it all together, identifying pockets of inefficient spend in real time and reallocating those marketing dollars toward better performing campaigns.
“Before, we could only focus on the largest campaign-level datasets because it was so time consuming to pull the data,” he says. “With Google BigQuery and Tableau, we can examine our advertising ROI much more granularly and reallocate more than $10 million in ad spend annually to grow the company faster and more efficiently.”
More Effective A/B Testing
To make sure it is delivering the best customer experiences, TeamSnap uses Google Optimize to run A/B tests on its website. It uses Google BigQuery and Tableau to verify and supplement these findings by measuring longer-term customer behavior across devices, spanning both web and mobile apps.
By pulling in data from Google Optimize, Google Analytics 360, Salesforce, and in-house billing and CRM systems, and understanding it with Tableau, TeamSnap has increased the accuracy and effectiveness of its A/B testing, gaining a more complete picture of customer onboarding and activity. In some cases, it found that short-term indicators it previously trusted were actually poor predictors of long-term behavior.
“Integration between Google Analytics 360 and Google BigQuery is seamless, giving us much more confidence in our A/B testing,” says Ken. “We’re constantly finding new and interesting ways to use our digital marketing data. Often, making a simple change can increase revenue by hundreds of thousands of dollars a year.”
Improving Product Quality
TeamSnap also uses Google BigQuery and Tableau to improve its own product, tracking customer activity at such a granular level that usability and functionality issues can be exposed and addressed faster. It’s also increasing customer engagement by verifying that potential customers are coming in through the right onboarding path—for example, a coach versus a player, or a consumer versus a club or other sports business. Using A/B testing to make sure customers are routed to the appropriate flow, TeamSnap drove $4 million in additional customer value each year.
“We initially chose Google BigQuery and Tableau to help with marketing, but we realized quickly that they could help us on the product side as well,” says Ken. “Most of the testing we do is about making things better and easier for our customers, and we’re accelerating that process with Google BigQuery and Tableau.”

5142
Of your peers have already downloaded this article
7:30 Minutes
The most insightful time you'll spend today!
Sure, machine learning is becoming a business imperative, but how does it work in practice?
That’s the subject of a new step-by-step guide to solving business problems with artificial intelligence and ML, based on insights gathered by IDG Research Services.
Its publication comes at a time when technology leaders face growing pressure to embrace these emerging technologies, yet many have questions about how to get started.
It has real-life examples such as a health services company that used ML to reduce support ticket-resolution time from 48 minutes to six.
In another section, a financial services VP explains that cloud-based ML services enable his company to avoid spending money on computing resources that sit idle.
The guide also includes concrete tips for new ML adopters, provided by the CIOs and other IT leaders who participated in IDG’s research. For example, a real-estate CIO recommends the use of third-party tools that rely on AI and ML technologies, while a financial services VP highlights the challenge and potential of incorporating unstructured data into ML initiatives.
Download the guide now!
More Relevant Stories for Your Company


Value Realization with Google Cloud for Retail SAP Data
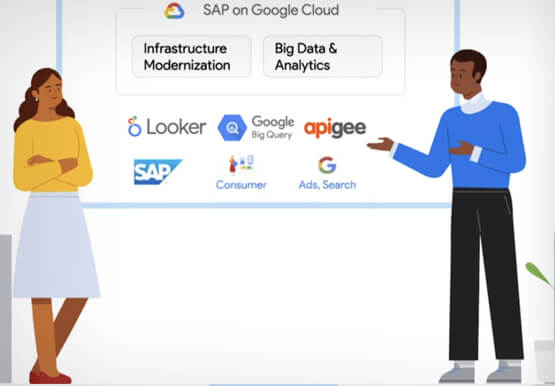
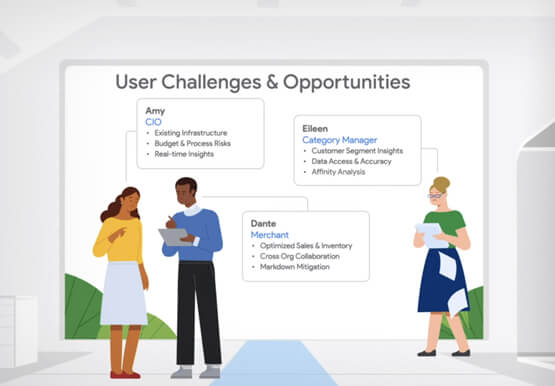
Retail engagements have changed drastically over the last few years, and by the virtue of COVID-19 pandemic, retail data and customers' expectations plummeted. To drive value and transformation across the entire value-chain retailers can make most of Google Cloud's secure, reliable IaaS by migrating their SAP systems and taking advantage

How BigQuery’s Unique Features Support Your Data at Petabyte-scale
Organizations rely on data warehouses to aggregate data from disparate sources, process it, and make it available for data analysis in support of strategic decision-making. BigQuery is the Google Cloud enterprise data warehouse designed to help organizations to run large scale analytics with ease and quickly unlock actionable insights. You

Google Data Studio Makes Reporting a Breeze For Genesys
As a customer experience platform, Genesys helps clients nurture great relationships with customers, and creates seamless user journeys across all channels and devices. Its technologies are used by more than 10,000 companies in over 100 countries, making Genesys the top provider of its kind for 25 years in a row.

Upgrade Your Contact Center with Knowlarity’s AI-powered Speech Analytics for Higher CX
Did you know, everyday about 56 million hours worth of phone conversations, equalling to 420 billion spoken words are handled by contact centers? Knowlarity, a renowned cloud business communication service provider with nearly 6,000 customers and over a million virtual users, leverages AI-powered speech analytics that offer insights to gauge
