





Apache and Dataflow Help with Real-time Indices Processing for Financial Institutions
4901
Of your peers have already read this article.
4:00 Minutes
The most insightful time you'll spend today!
Financial institutions across the globe rely on real-time indices to inform real-time portfolio valuations, to provide benchmarks for other investments, and as a basis for passive investment instruments including exchange-traded products (ETPs). This reliance is growing—the index industry dramatically expanded in 2020, reaching revenues of $4.08 billion.
Today, indices are calculated and distributed by index providers with proximity and access to underlying asset data, and with differentiating real-time data processing capabilities. These providers offer subscriptions to real-time feeds of index prices and publish the constituents, calculation methodology, and update frequency for each index.
But as new assets, markets, and data sources have proliferated, financial institutions have developed new requirements. Financial institutions will need to quickly create bespoke and frequently updating indices that represent a specific actual or theoretical portfolio, with its unique constituents and weightings.
In other words, existing index providers and other financial institutions alike will need mechanisms for rapid creation of real-time indices. This blog post’s focus—an index publication pipeline collaboratively developed by CME Group and Google Cloud—is an example of such a mechanism.
The pipeline closely approximates a particular CME Group index benchmark, but with far greater frequency (in near real time vs. daily) than its official counterpart. It does so by leveraging open-source models such as Apache Beam and cloud-based technologies such as Dataflow, which automatically scales pipelines based on inbound data volume.
Machine learning’s production problem
In the past decade, advances in AI toolchains have enabled faster ML model training—and yet a majority of ML models are still not making it into production. As organizations endeavor to develop their ML capabilities, they soon realize that a real-world ML system is comprised of a small amount of ML code embedded in a network of complex and large ancillary components. Each component brings its own development and operational challenges, which are met by bringing a DevOps methodology to the ML system, commonly referred to as MLOps (Machine Learning Operations). To apply ML to business problems, a firm must develop continuous delivery and automation pipelines for ML.
This index publication collaboration is instructive because it demonstrates MLOps best practices for just such a pipeline. One Apache Beam pipeline, suited for operating on both batch and streaming data, extracts insights and packages them for downstream consumers. These consumers may include ML pipelines that, thanks to Apache Beam, require only one code path for inference across batch and real-time data sources. The pipeline is run inside Google Cloud’s Dataflow execution engine, greatly simplifying management of underlying compute resources.
But the collaboration’s value is not constrained to the ML and data science realm. The project shows that consumers of the Apache Beam pipeline’s insights may also include traditional business intelligence dashboards and reporting tools. It also demonstrates the simplicity and economy of cloud-based time series data such as CME Smart Stream, which is metered by the hour, quickly and automatically provisioned, and consumable at a per-product-code (not per-feed) level.
A focus on real-time processing for financial services
To illustrate the above points, the collaboration applies data engineering and MLOps best practices to a financial services problem. We chose the financial services domain because many financial institutions do not yet have real-time market data processing or MLOps capabilities today, owing to a significant gap on either side of their ML/AI objectives.
Upstream from ML/AI models, financial institutions often experience a data engineering gap. For many financial institutions, batch processes have sufficiently addressed business requirements. As a result, the temporal nature of the time series data underlying these processes is deemphasized. For example, the original purpose of most trade booking systems was to capture a trade and ensure that it found its way to the middle and back office for settlement. It was not built with ML/AI in mind, and its underlying data therefore has not been packaged for consumption by ML/AI processes.
And downstream from ML/AI models, financial institutions often encounter the aforementioned “ML production problem.”
As ML/AI becomes ever more strategic, these two gaps have left many financial institutions in a conundrum—unable to train ML models for lack of properly packaged time series data, and unmotivated to package time series data for lack of ML models. By recreating a key energy market index using open-source libraries and cloud-based tools, this collaboration demonstrates that for the financial services domain a solution to this conundrum is more accessible today than ever.
Creating a new index
We modeled our new index after one of CME Group’s many index benchmarks. The particular index expresses the value of a basket of three New York Mercantile Exchange—listed energy futures as a single price. Today, CME Group publishes the index at the end of the day by calculating the settlement price of each underlying futures contract, and then weighing and summing these values.
While CME Group does not currently publish this index in real time, this collaboration aims to create a near real-time solution leveraging Google Cloud capabilities and CME Group market data delivered via CME Smart Stream. However, in order to publish the value so frequently—every five seconds, with 40-second publish latency—this collaboration’s pipeline has to solve a number of challenges in near-real time.
First, the pipeline must process sparse data from three separate trades feeds in memory to create open-high-low-close (OHLC) bars. More specifically, for five-second windows for each of the three front-month (and sometimes second-month) energy contracts, a bar must be produced. This is solved by using the Apache Beam library to implement functions which, when executed on Dataflow, automatically scale out as input load increases. The bars must be time-aligned across the underlying feeds, which is greatly simplified by Beam’s watermark feature. And for intervals in which no tick data is observed, the Beam library is used to pull forward the last value received, yielding perfect gap-free bars for downstream processors.
Second, the pipeline must calculate volume-weighted average price (VWAP) in near real-time for each front-month contract. The VWAP calculations are also written using the Beam API and executed on Dataflow. Each of these functions requires visibility of each element in the time window, so the functions cannot be arbitrarily scaled out. Nonetheless, this is tractable because their input—OHLC bars—is manageably small.
Third, the pipeline must replicate CME Group’s specific settlement price methodology for each contract. The rules specify whether to use VWAP or another source as price, depending on certain conditions. They also specify how to weigh combinations of monthly contracts during a roll period. The pipeline again encapsulates these requirements as an Apache Beam class, and joins the separate price streams at the correct time boundary.
The end result is a new stream publishing bespoke index data to a Google Cloud Pub/Sub topic thousands of times daily, enabling AI models as well as traditional industry index usage, dashboards, and other tools to assist real-time decision making. The stream’s pipeline uses open source libraries that solve common time series problems out-of-the box, and cloud-based services to reduce the user’s operational and scaling burden.

The importance of cloud-based data
The promise of cloud-based pipeline execution services cannot be realized using legacy data access patterns, which often require market data users to colocate and configure servers and network gear. Such patterns inject expense and scaling complexity into the pipeline’s overall operation, diverting resources from the adoption of MLOps best practices. Instead, a newer, cloud-based access pattern—in which resources subscribe to data streams inexpensively, rapidly and programatically—is necessary.
In 2018, CME Group identified the customer need for accessible futures and options market data. CME Group collaborated with Google Cloud to launch CME Smart Stream, which distributes CME Group’s real-time market data across Google Cloud’s global infrastructure with sub-second latency. Any customer with a CME Group data usage license and a Google Cloud project can consume this data for an hourly usage fee, without purchasing and configuring servers and network gear.
CME Smart Stream met this index pipeline’s requirements for cost-effective, cloud-based streaming data, but this is just one use case. Since the launch of a CME Smart Stream offering on Google Cloud, globally dispersed firms have adopted the solution. For example, Coin Metrics has been using the offering to better inform its customers in the crypto markets. According to CME Group, Smart Stream has become popular with new customers as the fastest, simplest way to access CME Group’s market data from anywhere in the world.
Adapt the design pattern to your needs
By combining cloud-based data, open-source libraries, and cloud-based pipeline execution services, we created a real-time index using the same constituents as its end-of-day counterpart. Additionally, financial institutions will find this approach addresses many other challenges—real-time valuation of a large set of portfolios; benchmark creation for new ETPs; or external publication of new indices.
Give it a try
This approach is available to help you meet your organization’s needs. Please review our user guide, whose Tutorials section provides a step-by-step guide to constructing a simple Apache Beam pipeline to generate metrics on streaming data in real-time, and connecting a new data source to the pipeline. We’ll be discussing this topic in CME Group’s webinar End-to-End Market Data Solutions in the Cloud at 10:30 am ET on June 16th.

How Domino’s Increased Monthly Revenue By 6% with Google Marketing Platform
DOWNLOAD CASE STUDY5764
Of your peers have already downloaded this article
1:30 Minutes
The most insightful time you'll spend today!
Pizza purveyor Domino’s is dominating delivery sales around the world. Today, Domino’s is the most popular pizza delivery chain operating in the U.K., the Republic of Ireland, Germany, and Switzerland — and sales just keep growing.
In these regions in 2014, Domino’s sold 76 million pizzas and generated £766.6 million (1.02 billion USD) in revenue — a 14.6% increase from the previous year.
In the U.K. and Ireland, online sales are increasing 30% year over year and currently account for almost 70% of all sales. Notably, 44% of those online sales are now made via mobile devices.
Multi-Device Purchasing Means Fresh Opportunities
Domino’s is a consistent digital innovator. Much of the company’s success stems from early investments in ecommerce and mobile commerce platforms that help people easily purchase pizzas from different devices.
Domino’s sold its first pizza online in 1999. It then launched an iPhone app in 2010, quickly followed by apps for Android and iPad in 2011, and a Windows app in 2012. By late 2014, Domino’s customers could even order pizzas from Xboxes.
The Domino’s marketing team had assembled a variety of tools to measure marketing performance, keeping pace with the company’s rapid innovations. Unfortunately, measuring siloed analytics and channel-focused tools restricted the team’s ability to fully understand all of the different paths to purchase.
Find out how they worked around this challenge with Google Marketing Platform. Download the case study!
Google Cloud Tools Help U.S. Forest Department Generate Years of Insights into Earth’s Natural Resources

5012
Of your peers have already read this article.
3:00 Minutes
The most insightful time you'll spend today!
For 117 years, the U.S. Department of Agriculture’s Forest Service has been a steward of America’s forests, grasslands, and waterways. It directly manages 193 million acres and supports sustainable management on a total of 500 million acres of private, state, and tribal lands. Its impact reaches far beyond even that, offering its research and learning freely to the world.
At Google, we’re big admirers of the Forest Service’s mission. So we were thrilled to learn in 2011 that its scientists were using Google Earth Engine, our planetary-scale platform for Earth Science data and analysis, to aid its research, understanding, and effectiveness. In the years since, Google has worked with the Forest Service to meet its unique requirements for visual information about the planet. Using both historical and current data, the Forest Service built new products, workflows, and tools that help more effectively and sustainably manage our natural resources. The Forest Service also uses Earth Engine and Google Cloud to study the effects of climate change, forest fires, insects and disease, helping them create new insights and strategies.
Besides gaining newfound depths of insight, the Forest Service has also sped up its research dramatically, enabling everyone to do more. Using Google Cloud and Earth Engine, the Forest Service reduced the time it took to analyze 10 years worth of land-cover changes from three months to just one hour, using just 100 lines of code. The agency built new models for coping with change, then mapped these changes over time, in its Landscape Change Monitoring System (LCMS) project.
Emergency responders can now work better on new threats that arise after wildfires, hurricanes, and other natural disasters. Forest health specialists can detect and monitor the impacts of invasive insects, diseases, and drought. More Forest Service personnel can use new tools and products within Earth Engine, thanks to numerous training and outreach sessions within the Forest Service.
Researchers elsewhere also benefited when the Forest Service created new toolkits, and posted them to GitHub for public use. For example, there’s geeViz, a repository of Google Earth Engine Python code modules useful for general data processing, analysis, and visualization.
This is only the start. Recently, the Forest Service started using Google Cloud’s processing and analysis tools for projects like California’s Wildfire and Forest Resilience Action Plan. Forest Service researchers also use Google Cloud to better understand ecological conditions across landscapes in projects like Fuelcast, which provides actionable intelligence for rangeland managers, fire specialists, and growers, and the Scenario Investment Planning Platform for modeling local and national land management scenarios.
The Forest Service is a pioneer in building technology to help us better understand and care for our planet. With more frequent imaging, rich satellite data sets, and sophisticated database and computation systems, we can view and model the Earth as a large-scale dynamic system.
We are honored and excited to respond to the unique set of requirements of the scientists, engineers, rangers, and firefighters of the USFS, and look forward to years of learning about — and better caring for — our most precious resources.
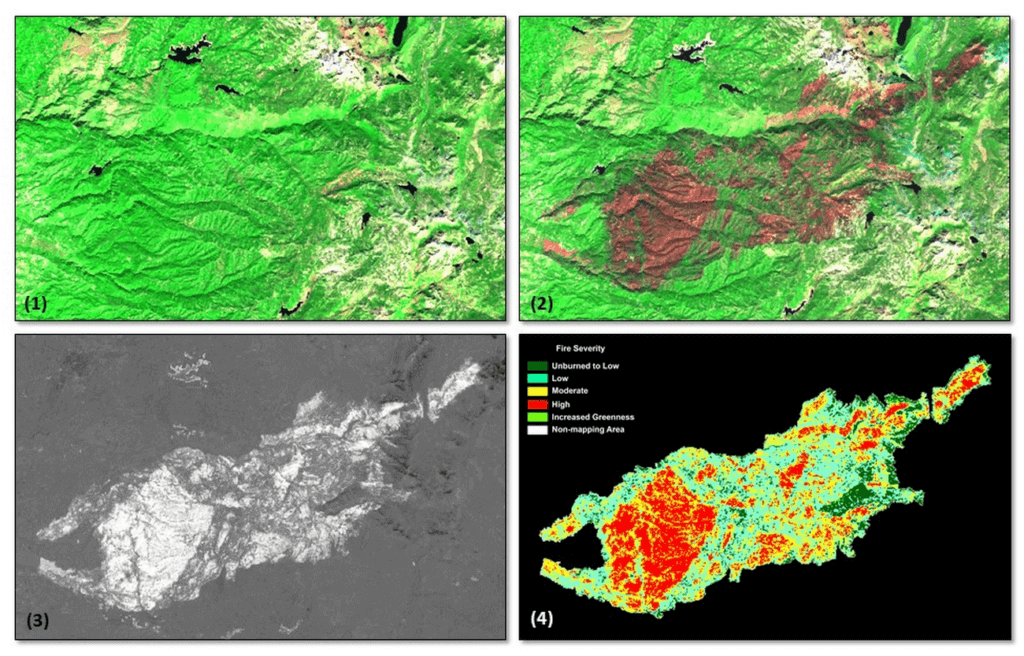
*Image 1: The USDA Forest Service (USFS) Geospatial Technology and Applications Center (GTAC) uses science-based remote sensing methods to characterize vegetation and soil condition after wildland fire events. The results are used to facilitate emergency assessments to support hazard mitigation, to inform post-fire restoration planning, and to support the monitoring of national fire policy effectiveness. GTAC currently conducts these mapping efforts using long-established geospatial workflows. However, GTAC has adapted its post-fire mapping and assessment workflows to work within Google Earth Engine (GEE) to accommodate the needs of other users in the USFS. The spatially and temporally comprehensive coverage of moderate resolution multispectral data sources (e.g., Landsat, Sentinel 2) and analytical power provided by GEE allows users to create geospatial burn severity products quickly and easily. Box 1 shows a pre-fire Sentinel-2 false color composite image. Box 2 shows a post-fire Sentinel-2 false color composite image with the fire scar apparent in reddish brown. Box 3 shows a differenced Normalized Burn Ratio (dNBR) image showing the change between the pre- and post-fire images in Boxes 1 and 2. Box 4 shows a thresholded dNBR image of the burned area with four classes of burn severity (unburned to high severity), which is the final output delivered to forest managers.
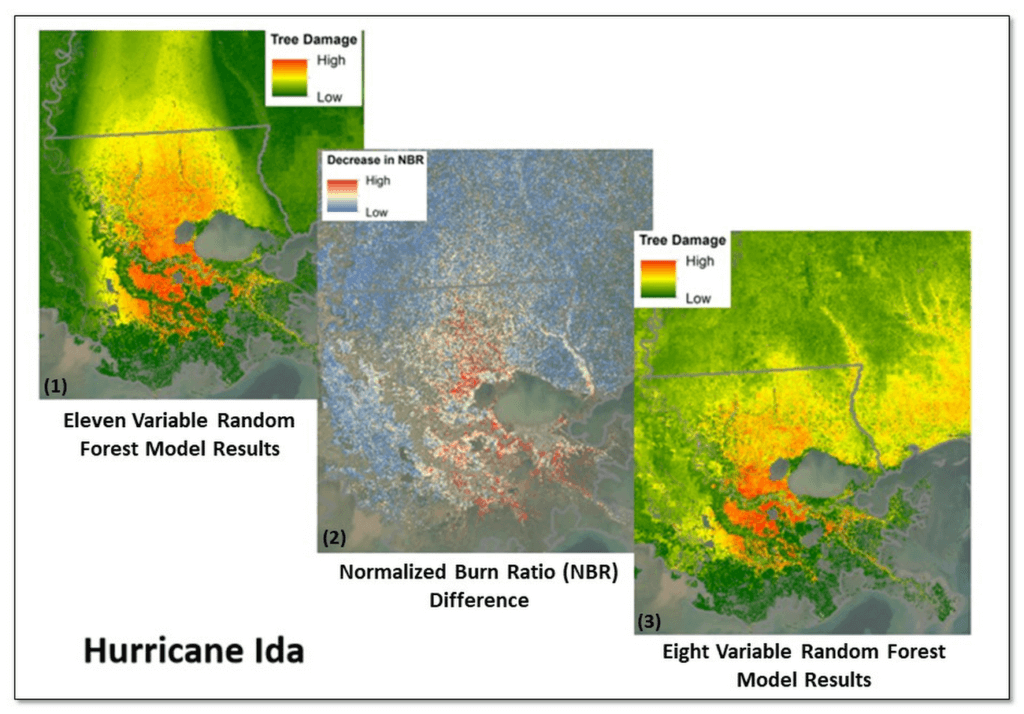
*Image 2: Leveraging Google Earth Engine (GEE), the USDA Forest Service (USFS) Geospatial Technology and Applications Center (GTAC) and USFS Region 8, developed the Tree Structure Damage Impact Predictive (TreeS-DIP) modeling approach to predict wind damage to trees resulting from large hurricane events and produce spatial products across the landscape. TreeS-DIP results become available within 48 hours following landfall of a large storm event to allow allocation of ground resources to the field for strategic planning and management. Boxes 1 and 3 above show TreeS-DIP modeled outputs with varying data inputs and parameters. Box 2 shows changes in greenness (Normalized Burn Ratio; NBR) that was measured with GEE during the recovery from Hurricane Ida and is shown as a visual comparison to the rapidly available products from TreeS-DIP.
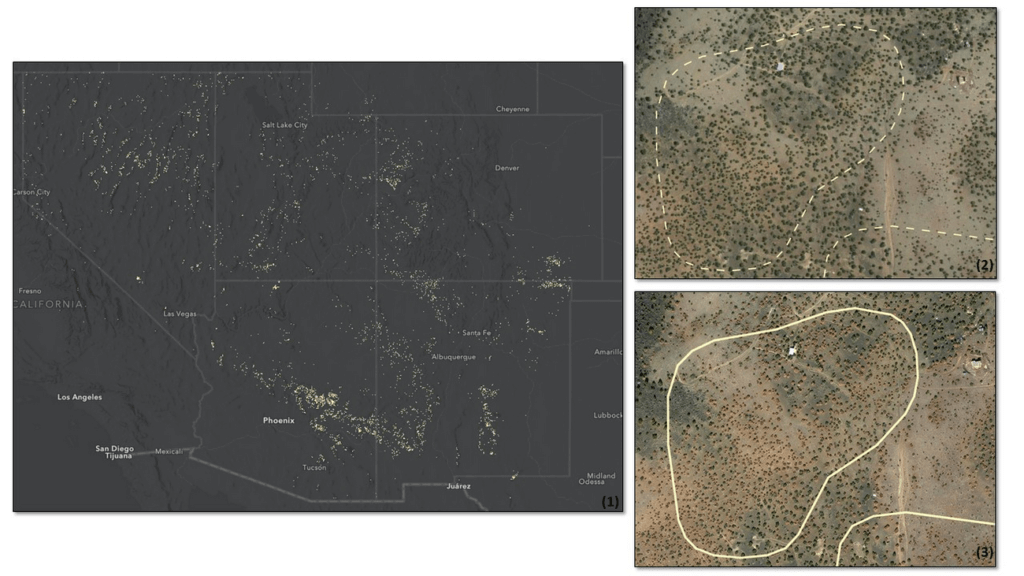
*Image 3: Severe drought conditions across the American West prompted concern about the health and status of pinyon-juniper woodlands, a vast and unique ecosystem. In a cooperative project between the USDA Forest Service (USFS) Geospatial Technology and Applications Center (GTAC) and Forest Health Protection (FHP), Google Earth Engine (GEE) was used to map pinyon pine and juniper mortality across 10 Western US States. The outputs are now being used to plan for future work including on-the-ground efforts, high-resolution imagery acquisitions, aerial surveys, in-depth mortality modeling, and planning for 2022 field season work.
Box 1 contains remote sensing change detection outputs (in white) generated with GEE, showing pinyon-juniper decline across the Southwestern US. Box 2 shows NAIP imagery from 2017 with, with box 3 showing NAIP imagery from 2021. NAIP imagery from these years shows trees changing from healthy and green in 2017 to brown and dying in 2021. In addition, box 2 and box 3 show change detection outputs from Box 1 for a location outside of Flagstaff, AZ converted to polygons (in white). The polygon in box 2 is displayed as a dashed line to serve as a reference, while the solid line in box 3 shows the measured change in 2021. Converting rasters to polygons allows the data to be easily used on tablet computers, as well as the ability to add information and photographs from field visits.
Partnering with Google Cloud is the Key Behind Recent Healthcare Innovations

8833
Of your peers have already read this article.
2:00 Minutes
The most insightful time you'll spend today!
It’s simply amazing to witness how some of our systems integrators employ Google Cloud solutions to drive innovation in ways we at Google may never have considered—especially in healthcare. According to analyst firm MarketsandMarkets, the market for the Cloud in healthcare is projected to grow 43% between 2020 and 2025 to nearly $65 billion, fueled by the need for better technology infrastructures and faster digital transformation.
Healthcare and life sciences communities are looking to Google Cloud and its Service engagement model partners to improve collaboration and activate the power of medical data. These transformations deliver robust data analytics and bring a much deeper perspective into health epidemics like COVID-19 to help save lives.
In the healthcare and life sciences industry, our Google Cloud partners and customers provide constant energy and inspiration–and are the magic in some key healthcare innovations globally.
Let me show you how they are solving real-world business challenges.
Improving collaboration in Healthcare
Cloudbakers and Comanche County Memorial Hospital transitioned 2,000 employees to Google Workspace to improve collaboration, reduce costs, and increase security. By implementing a system that requires less maintenance while enabling mobile access to data and true collaboration, Comanche County Memorial Hospital saves $175,000 annually on licenses and helps medical professionals spend more time with patients.
“We chose Google Workspace because it cost a quarter of what we were paying previously, offers the kind of modern features that healthcare facilities need, and gave us data security and peace of mind.” —James Wellman, CIO, Comanche County Memorial Hospital
Accessing previously locked down medical data
Google Cloud and Quantiphi supported advances in cloud-based machine learning services to reduce infrastructure costs, unlock new paths of treatment, and dramatically reduce the amount of time it takes to evaluate scanned imagery following a stroke. John Hopkins University BIOS Division has been working on medical imaging to accelerate insights from scans on approximately 500 patients from 2,500 hours to 90 minutes, and lead to more accurate decision-making for brain injury patients that will ultimately improve medical outcomes.
“We’ve aligned closely with the goal of showing that a cloud-based, AI-driven approach is robust and that it can be performed while protecting personal PHI. In terms of costs, the cloud has definitely reduced some of the traditional financial demands of our research.” —Daniel F. Hanley, Jr., M.D., Director, Johns Hopkins University BIOS Division
Improving data access with the flexibility of Google Cloud
With the help of MediaAgility, TRIARQ migrated to Google Cloud to modernize their platform, build new applications, and expand their global footprint. With BigQuery, TRIARQ can now consolidate all transactional data, past and present, into a single location to report on specific insights and predict future data from e-prescriptions to complex revenue-cycle data and value-base analysis.
“The future of this industry will need to be a global one, and we can no longer be stuck in legacy systems if we want to survive. Having a team that is passionate about supporting us in this journey is definitely a plus point.”—Yaw Kwakye, Co-founder and Chief Architect, TRIARQ
Increasing visibility to COVID-19 outbreaks for actionable insights
As part of its response to the COVID-19 pandemic, HCA Healthcare chose to work with Google Cloud and SADA to create a national portal that increases visibility into outbreaks in 3,100 counties across the country in just 8 weeks. Now, the portal generates 30,000 new analytical views each day that can help inform private and public sector decision making for reopenings, closures, hot spots, and many other population health management activities.
“This project required deep knowledge of AI, and consumer-facing platforms, as well as healthcare. Google brought together the ideal combination of product, people, and partners. Google Cloud’s healthcare-specific products along with SADA’s expertise in the healthcare IT space made this partnership the perfect choice to move quickly and intelligently.”—Dr. Edmund Jackson, Chief Data Officer, HCA Healthcare
We’re committed to building the technology, resources, and services through Partner Advantage to help our partners address this opportunity. Looking for a solution focused partner in your region who has achieved Expertise and/or Specialization in your industry? Search our Global Partner Directory. Not yet a Google Cloud partner? Visit Partner Advantage and learn how to become one today!
How BigQuery’s Unique Features Support Your Data at Petabyte-scale

4787
Of your peers have already read this article.
3:00 Minutes
The most insightful time you'll spend today!
Organizations rely on data warehouses to aggregate data from disparate sources, process it, and make it available for data analysis in support of strategic decision-making. BigQuery is the Google Cloud enterprise data warehouse designed to help organizations to run large scale analytics with ease and quickly unlock actionable insights. You can ingest data into BigQuery either through batch uploading or by streaming data directly to unlock real-time insights. As a fully-managed data warehouse, BigQuery takes care of the infrastructure so you can focus on analyzing your data up to petabyte-scale. BigQuery supports SQL (Structured Query Language), which you’re likely already familiar with if you’ve worked with ANSI-compliant relational databases.
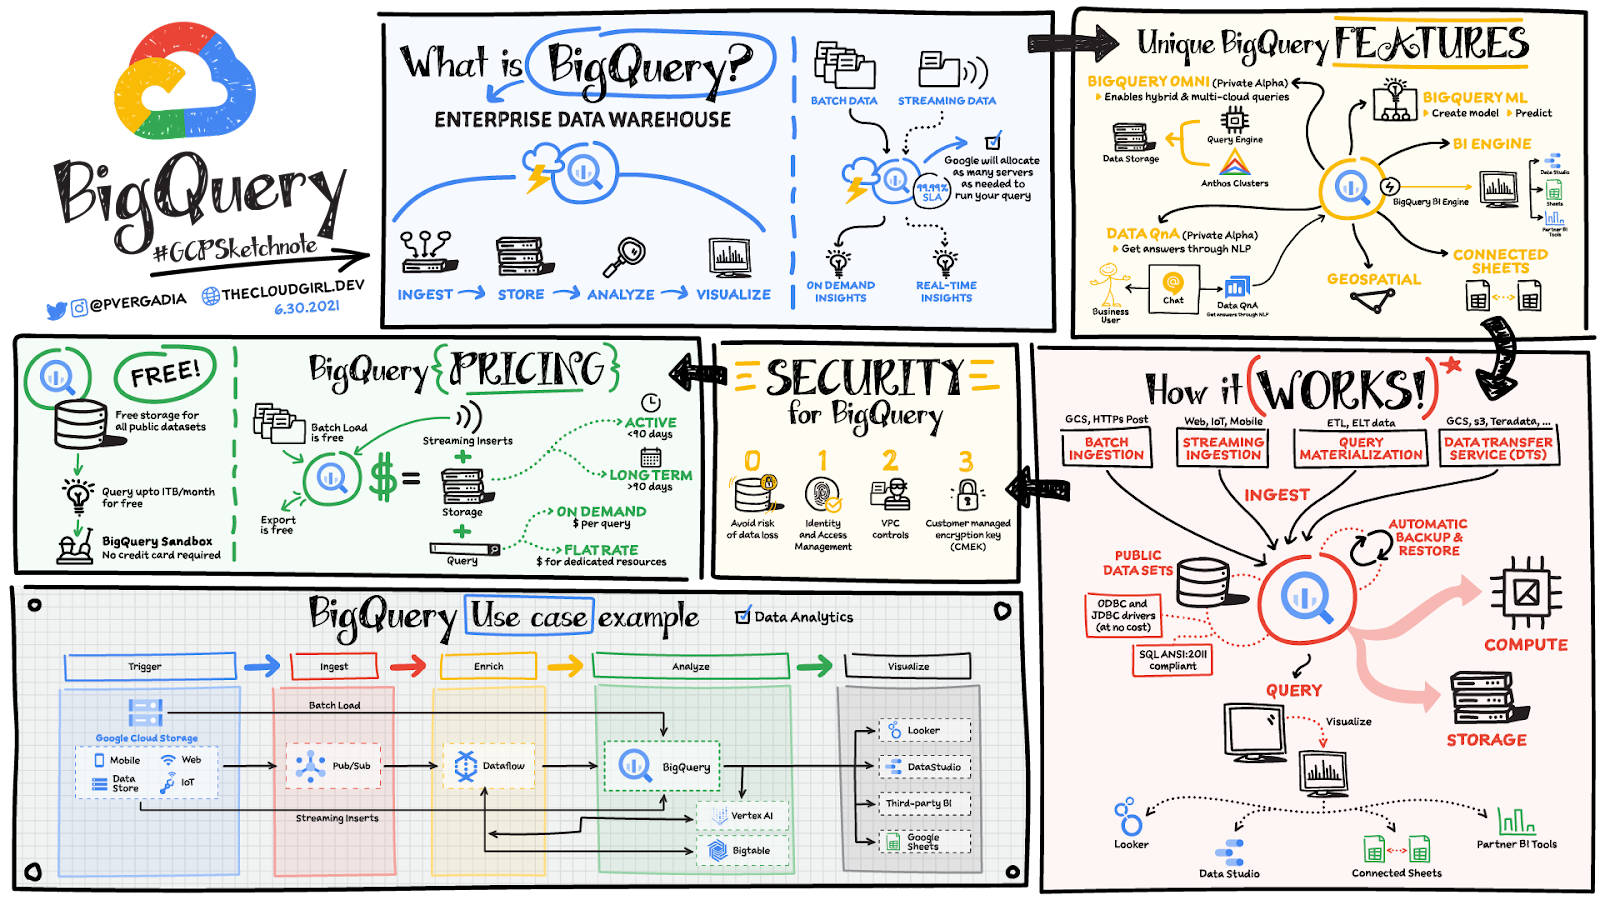
BigQuery unique features
BI Engine – BigQuery BI Engine is a fast, in-memory analysis service that provides subsecond query response times with high concurrency. BI Engine integrates with Google Data Studio and Looker for visualizing query results and enables integration with other popular business intelligence (BI) tools.
BigQuery ML: BigQuery ML is unlocking machine learning for millions of data analysts. It enables data analysts and data scientists to build and operationalize machine learning models directly within BigQuery, using simple SQL.
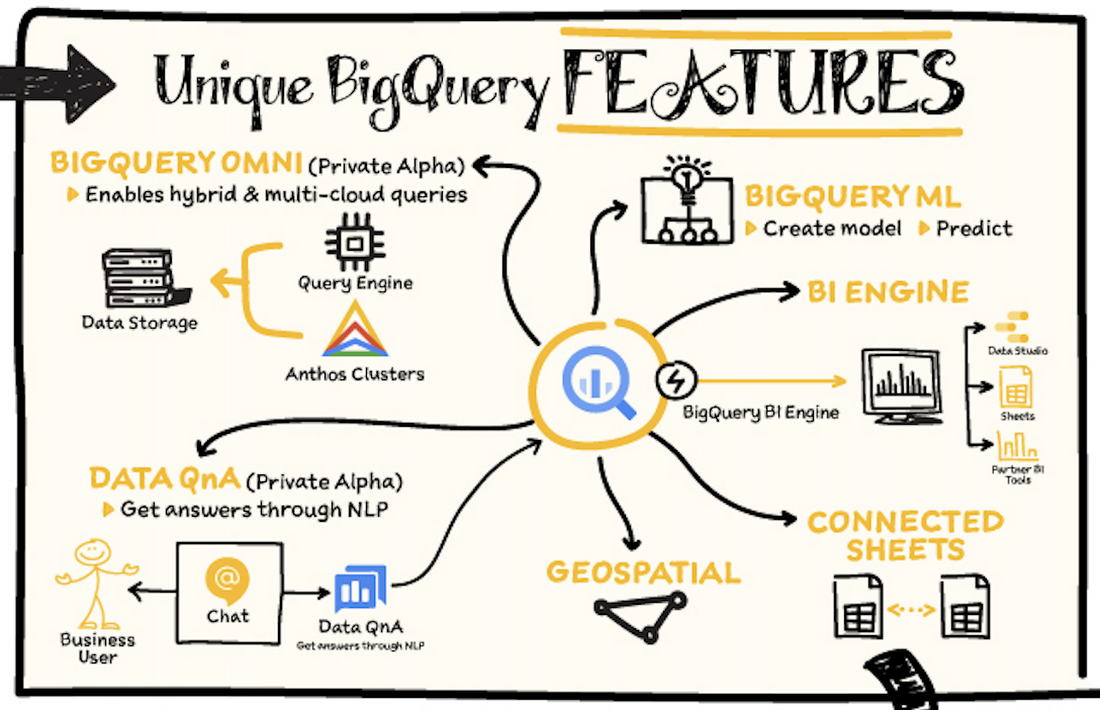
BigQuery Omni – BigQuery Omni is a flexible, multi-cloud analytics solution powered by Anthos that lets you cost-effectively access and securely analyze data across Google Cloud, Amazon Web Services (AWS), and Azure, without leaving the BigQuery user interface (UI). Using standard SQL and familiar BigQuery APIs, you can break down data silos and gain critical business insights from a single pane of glass.
Data QnA: Data QnA enables self-service analytics for business users on BigQuery data as well as federated data from Cloud Storage, Bigtable, Cloud SQL, or Google Drive. It uses Dialogflow and enables users to formulate free-form text analytical questions, with auto-suggested entities while users type a question.
Connected Sheets -The native integration between Sheets and BigQuery makes it possible for all business stakeholders, who are already quite familiar with spreadsheet tools, to get their own up-to-date insights at any time.
Geospatial data – BigQuery offers accurate and scalable geospatial analysis with geography data types. It supports core GIS functions – measurements, transforms, constructors, and more – using standard SQL.
How does it work?
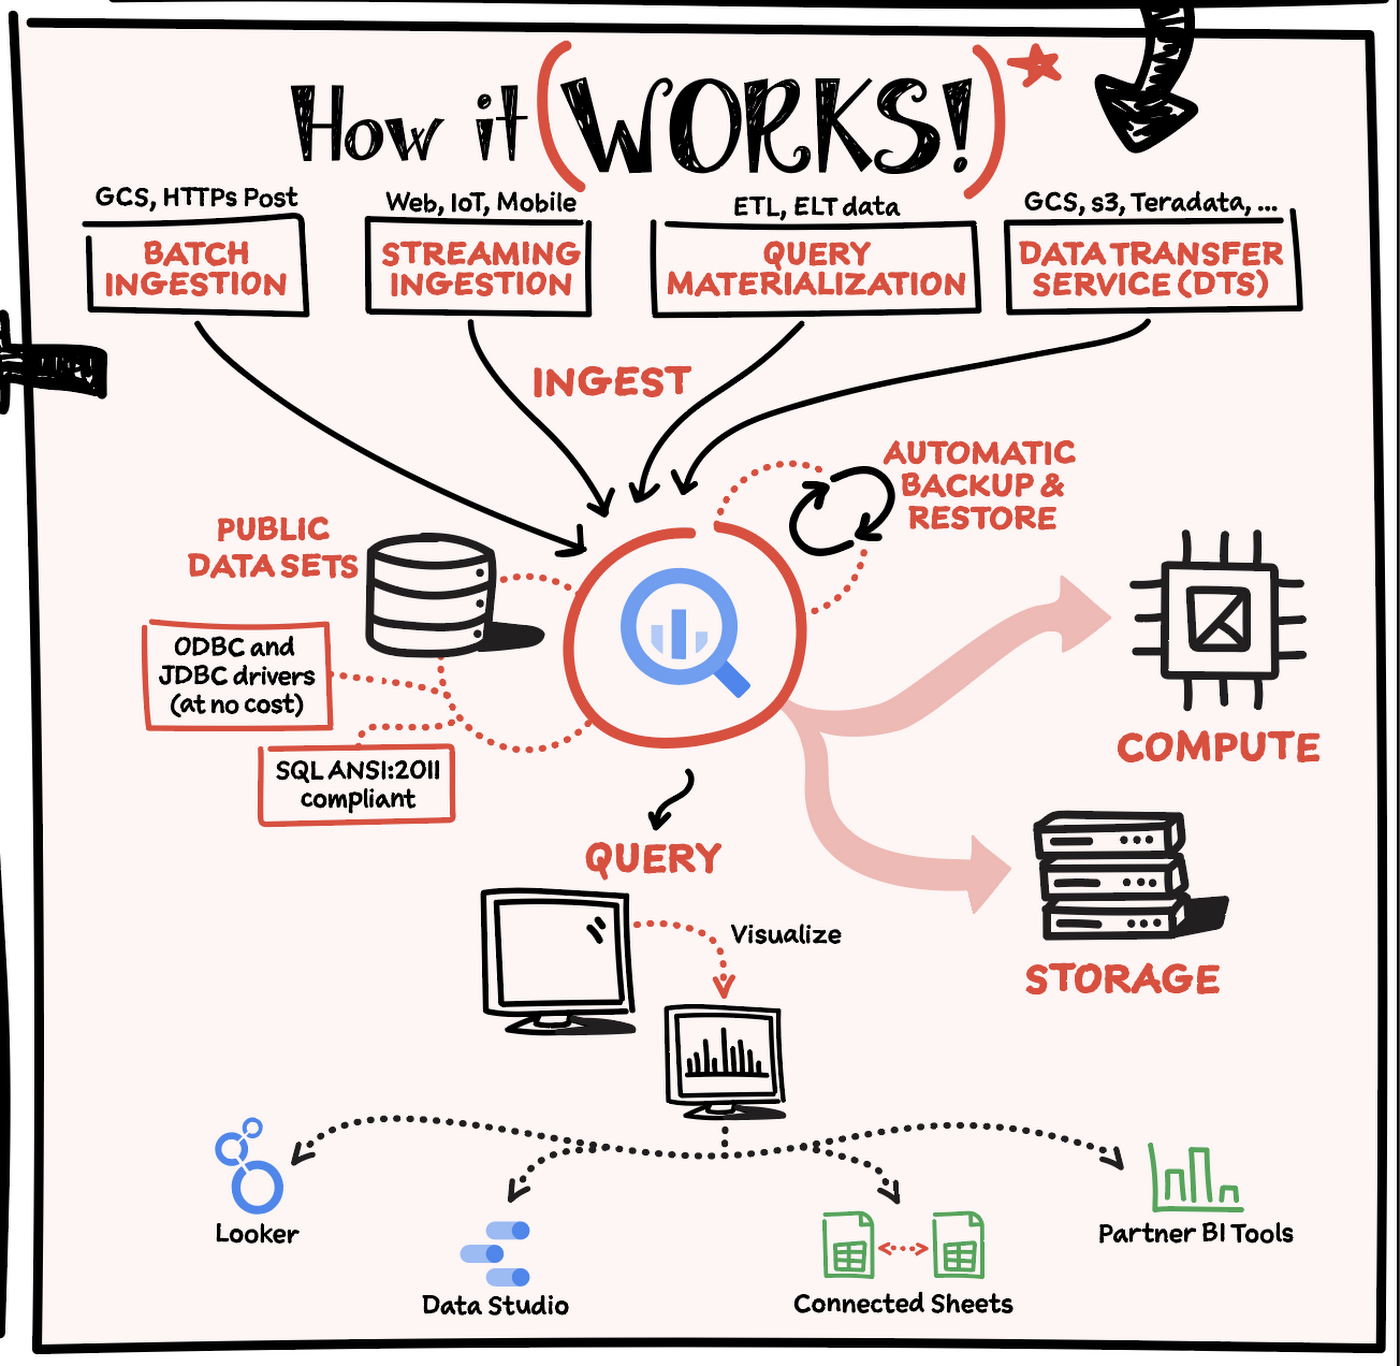
Here’s how it works: You ingest your own data into BigQuery or use data from the public datasets. Storage and compute are decoupled and can scale independently on demand. This offers immense flexibility and cost control for your business as you don’t need to keep expensive compute resources up and running all the time. As a result, BigQuery is much more cost-effective than traditional node-based cloud data warehouse solutions or on-premises systems. BigQuery also provides automatic backup and restore of your data.
You can ingest data into BigQuery in batches or stream real-time data from web, IoT, or mobile devices via Pub/Sub. You can also use Data Transfer Service to ingest data from other clouds, on-premises systems or third-party services. BigQuery also supports ODBC and JDBC drivers to connect with existing tools and infrastructure.
Interacting with BigQuery to load data, run queries, or create ML models can be done in three different ways. You can use the UI in the Cloud Console, the BigQuery command-line tool, or the API via client libraries available in several languages.
When it comes time to visualize your data, BigQuery integrates with Looker as well as several other business intelligence tools across the Google partner ecosystem.
What about security?
BigQuery offers built-in data protection at scale. It provides security and governance tools to efficiently govern data and democratize insights within your organization.
- Within BigQuery, users can assign dataset-level and project-level permissions to help govern data access. Secure data sharing ensures you can collaborate and operate your business with trust.
- Data is automatically encrypted both while in transit and at rest, ensuring that your data is protected from intrusions, theft, and attacks.
- Cloud DLP helps you discover and classify sensitive data assets.
- Cloud IAM provides access control and visibility into security policies.
- Data Catalog helps you discover and manage data.
How much does it cost?
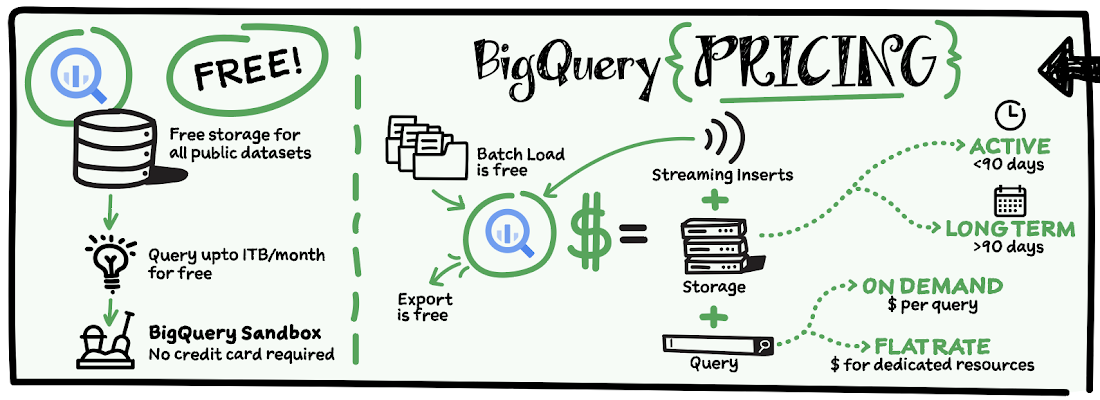
The BigQuery sandbox lets you explore BigQuery capabilities at no cost and confirm that BigQuery fits your needs. With BigQuery you get predictable price-performance: you pay for storing and querying data, and for streaming inserts. Loading and exporting data are free of charge. Storage costs are based on the amount of data stored, and have two rates based on how often the data is changing. Query costs can be either:
- On-demand – you are charged per query by the amount of data processed
- Flat-rate – if you prefer to purchase dedicated resources
You can start with the pay-as-you-go, on-demand option and later move to flat-rate if that better suits your usage. Or, start with flat-rate, get a better understanding of your usage and move to the pay-as-you-go models for additional workloads.
To explore BigQuery and its capabilities a bit more, check out the sandbox; and when you’re ready to modernize your data warehouse with BigQuery then check out the documentation to streamline your migration process here. https://www.youtube.com/embed/So-tVyBQt8E?enablejsapi=1&
For more #GCPSketchnote, follow the GitHub repo. For similar cloud content follow me on Twitter @pvergadia and keep an eye out on thecloudgirl.dev.
Sainsbury’s Uses AI to Figure Out How the World Eats

8968
Of your peers have already read this article.
4:45 Minutes
The most insightful time you'll spend today!
Retail will forever be an industry that must constantly reinvent itself in response to, and anticipation of, ever-changing consumer demands.
Digital transformation is fueling these changes and we’ve previously spoken about how businesses including Ulta Beauty and Kohl’s are taking advantage of Google Cloud to put data at the center of what they do and deliver the best possible shopping experience and product offerings for their customers.
Leveraging Google Cloud machine learning platform, Sainsbury is able to develop predictive analytics models to spot trends and adjust inventory, providing shoppers with a better experience.
Sainsbury’s, one of Britain’s best-known supermarkets, is another great example of a business transforming the way it engages with its customers with the cloud.
With over 150 years of service, Sainsbury’s vision is to be the most trusted retailer, where people love to work and shop. It makes customers’ lives easier, by offering great quality and service at fair prices.
The food industry and the way that customers shop is rapidly changing. From foodie hashtags on Instagram, to the latest cooking fads, customers want to stay connected to the latest trends and Sainsbury’s is empowering them do that.
To help Sainsbury’s achieve this goal, its Commercial and Technology teams, in partnership with Accenture, are building cutting-edge machine learning solutions on Google Cloud Platform (GCP) to provide new insights on what customers want and the trends driving their eating habits.
With the help of Google Cloud Platform, we are generating new insights into how the world eats and lives, to help us stay ahead of market trends and provide an even better shopping experience for our customers.
–Phil Jordan, Group CIO, Sainsbury’s
Sainsbury’s solution relies on data from multiple structured and unstructured sources. Using Google Cloud’s powerful cloud-based analytics tools to ingest, clean and classify that data, and a custom-built front-end interface for internal users to seamlessly navigate through a variety of filters and categories, Sainsbury’s is able to gain advanced insights in real time.
As a result, Sainsbury’s has been able to develop predictive analytics models to spot trends and adjust inventory, providing shoppers with a better experience.
Phil Jordan, Group CIO of Sainsbury’s believes this project will have a big impact.
“The grocery market continues to change rapidly. We know our customers want high quality at great value and that finding innovative and distinctive products is increasingly important to them. With the help of Google Cloud Platform, we are generating new insights into how the world eats and lives, to help us stay ahead of market trends and provide an even better shopping experience for our customers.”
This project is also a great example of the successes Google Cloud customers have when they work with the company’s partners.
“We’re delighted to partner with Google Cloud to help the Sainsbury’s Commercial team apply predictive analytics to the identification of new and emerging trends in grocery,” says Adrian Bertschinger, Managing Director for Retail, Accenture.
“The food sector is experiencing significant, rapid disruption, and this new, cloud-based insights platform will help Sainsbury’s identify trends much earlier and adapt their product assortment in a faster, more informed way—all for the benefit of customers.”
Whatever the next food or shopping trend may be, Sainsbury’s is looking to the cloud to help them stay a step ahead.
More Relevant Stories for Your Company

Leverage the Power of Looker to Extract Data Value at Web Scale
Data science can be applied to business problems to improve practices and help to strengthen customer satisfaction. In this blog, we address how the addition of Looker extends the value of your Google Cloud investments to help you understand your customer journey, unlock value from first-party data, and optimize existing
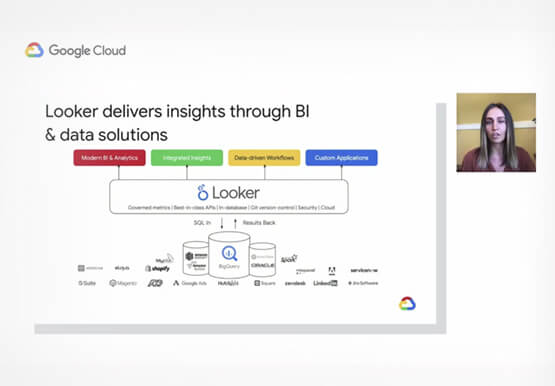
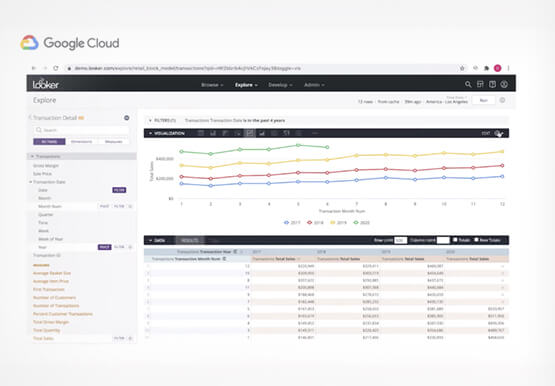
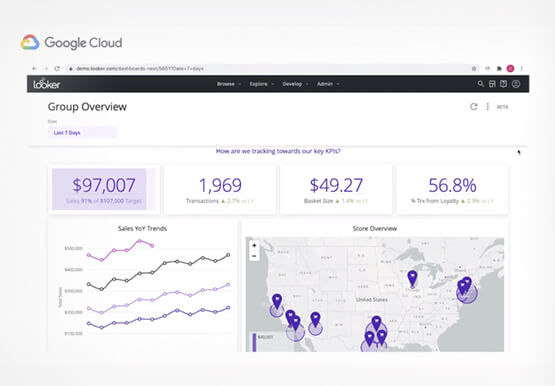

Technical deep dive on Looker: The enterprise BI solution for Google Cloud
Thousands of users accessing petabytes of data on a daily basis: This is a challenging proposition for enterprises, without a doubt. But Looker makes it possible. Beyond just accessing data though, Looker’s platform transforms your company’s relationship with data. Go under the hood of Looker, with Olivia Morgan, Enterprise CE,

How to Predict the Cost of a Managed Streaming and Batch Analytics Service
The value of streaming analytics comes from the insights a business draws from instantaneous data processing, and the timely responses it can implement to adapt its product or service for a better customer experience. “Instantaneous data insights,” however, is a concept that varies with each use case. Some businesses optimize
Delivering analysis-ready financial data at scale
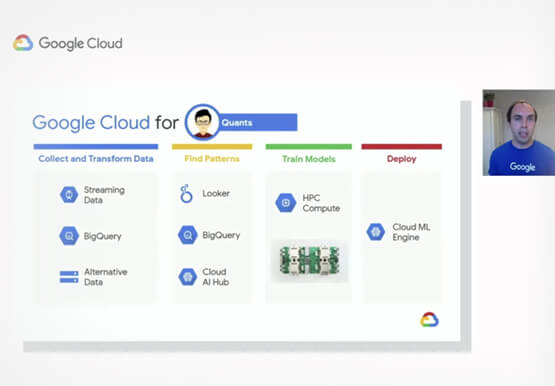
Refinitiv, is a leading provider of financial market data. It serves over 40,000 institutions and operates in 190 countries. “We're constantly looking at solving some of the most difficult problems our users face when accessing new data sets as well as onboarding new sources that will be relevant for workflows
