





6178
Of your peers have already watched this video.
16:00 Minutes
The most insightful time you'll spend today!
Easy Access to Stream Analytics with Google Cloud
By 2025, more than a quarter of the data created in the global datasphere will be real-time in nature.
“This is important because in the real-time world, “the window of opportunity diminishes and goes away really fast. You want to be able to respond to your customer needs, their asks, and be able to do prediction or maybe detect some problem and really respond to it really fast,” says Evren Eryurek, Director of Product Management for Stream Analytics at Google Cloud.
Today, streaming analysis of application and user events only continue to become more central to how every business operates. With this development comes an accompanying rise in customer expectations for businesses to be aware, prepared, and delivering real-time solutions. Is your business ready?
In this session, Eryurek will showcase Google Cloud’s latest developments to enable easy access to creation and management of real-time data driven experiences.
Learn the latest about the products powering Google’s streaming capabilities and hear directly from the team bringing them to life.
2804
Of your peers have already watched this video.
41:30 Minutes
The most insightful time you'll spend today!
Real-world Data Integration Patterns
Learn the basics of Google Cloud Data Integration. How do you go from basic, hardcoded data pipelines to making your solution is dynamic and reusable? How do you parameterize your pipelines? What is the difference between parameters and variables, and when should you use them?
Nidhi Modh, Product Manager, Google Cloud, answers all these questions and more. He contrasts practices with traditional views of data integration, the benefits and the challenges.
Explore some common design patterns for moving and orchestrating data, including incremental and metadata-driven pipelines. Discover best practices and lessons learned and highlight common data engineering best practices for building scalable and high-performing data integration solutions.

Customer Voices: How Firms from Across Industries Leverage Google Cloud
DOWNLOAD CASE STUDY14103
Of your peers have already downloaded this article
1:30 Minutes
The most insightful time you'll spend today!
From powering everyday operations and accelerating application innovation, to providing tools for specific business needs and executing on big ideas, to advancing the security of technology solutions, companies from across industries have leveraged Google Cloud for business benefits.
Companies from across industries have turned to Google Cloud for transforming their business, modernizing their infrastructure, and gleaning intelligence from data. For instance:
- Johnson & Johnson achieved a 41% increase in search results from high-quality job applicants, significantly improving the company’s ability to quickly hire top talent.
- Sony Network Communications now processes 10 billion monthly queries faster, which advances data analysis.
- University College Dublin saw significant 6-figure savings by eliminating legacy hardware, software, and maintenance.
And there are many such examples. Read the collection of case studies to find out how companies from across industries and geographies leveraged Google Cloud for measurable business benefits and for solving complex problems.
Four Key Takeaways from Google and Quantum Metric’s Back-to-School Retail Benchmark Study

4780
Of your peers have already read this article.
2:00 Minutes
The most insightful time you'll spend today!
Is it September yet? Hardly! School is barely out for the summer. But according to Google and Quantum Metric research, the back-to-school and off-to-college shopping season – which in the U.S. is second only to the holidays in terms of purchasing volume1 – has already begun. For retailers, that means planning for this peak season has kicked off as well.
We’d like to share four key trends that emerged from Google research and Quantum Metric’s Back-to-School Retail Benchmarks study of U.S. retail data, explore the reasons behind them, and outline the key takeaways.
- Out-of-stock and inflation concerns are changing the way consumers shop. Back-to-school shoppers are starting earlier every year, with 41% beginning even before school is out – even more so when buying for college1. Why? The behavior is driven in large part by consumers’ concerns that they won’t be able to get what they need if they wait too long. 29% of shoppers start looking a full month before they need something1.
Back-to-school purchasing volume is quite high, with the majority spending up to $500 and 21% spending more than $1,0001. In fact, looking at year-over-year data, we see that average cart values have not only doubled since November 2021, but increased since the holidays1. And keep in mind that back-to-school spending is a key indicator leading into the holiday season.
That said, as people are reacting to inflation, they are comparing prices, hunting for bargains, and generally taking more time to plan. This is borne out by the fact that 76% of online shoppers are adding items to their carts and waiting to see if they go on sale before making the purchase1. And, to help stay on budget and reduce shipping costs, 74% plan to make multiple purchases in one checkout1. That carries over to in-store shopping, when consumers are buying more in one visit to reduce trips and save on gas.
2. The omnichannel theme continues. Consumers continue to use multiple channels in their shopping experience. As the pandemic has abated, some 82% expect that their back-to-school buying will be in-store, and 60% plan to purchase online. But in any case, 45% of consumers report that they will use both channels; more than 50% research online first before ever setting foot in a store2. Some use as many as five channels, including video and social media, and these 54% of consumers spend 1.5 times more compared to those who use only two channels4.
And mobile is a big part of the journey. Shoppers are using their phones to make purchases, especially for deadline-driven, last-minute needs, and often check prices on other retailers’ websites while shopping in-store. Anecdotally, mobile is a big part of how we ourselves shop with our children, who like to swipe on the phone through different options for colors and styles. We use our desktops when shopping on our own, especially for items that require research and represent a larger investment – and our study shows that’s quite common.
3. Consumers are making frequent use of wish lists. One trend we have observed is a higher abandonment rate, especially for apparel and general home and school supplies, compared to bigger-ticket items that require more research. But that can be attributed in part to the increasing use of wish lists. Online shoppers are picking a few things that look appealing or items on sale, saving them in wish lists, and then choosing just a few to purchase. Our research shows that 39% of consumers build one or two wish lists per month, while 28% said they build one or two each week, often using their lists to help with budgeting1.
4. Frustration rates have dropped significantly. Abandonment rates aside, shopper annoyance rates are down by 41%, year over year1. This is despite out-of-stock concerns and higher prices. But one key finding showed that both cart abandonment and “rage clicks” are more frequent on desktops, possibly because people investing time on search also have more time to complain to customer service.
And frustration does still exist. Some $300 billion is lost each year in the U.S. from bad search experiences5. Data collected internationally shows that 80% of consumers view a brand differently after experiencing search difficulties, and 97% favor websites where they can quickly find what they are looking for5.
Lessons to Learn
What are the key takeaways for retailers? In general, consider the sources of customer pain points and find ways to erase friction. Improve search and personalization. And focus on improving the customer experience and building loyalty. Specifically:
80% of shoppers want personalization6. Think about how you can drive personalized promotions or experiences that will drive higher engagement with your brand.
46% of consumers want more time to research1. Drive toward providing more robust research and product information points, like comparison charts, images, and specific product details.
43% of consumers want a discount1, but given current economic trends, retailers may not be offering discounts. In order to appease budget-conscious shoppers, retailers can consider other retention strategies such as driving loyalty using points, rewards, or faster-shipping perks.
Be sure to keep returns as simple as possible so consumers feel confident when making a purchase, and reduce possible friction points if a consumer decides to make a return. 43% of shoppers return at least a quarter of the products they buy and do not want to pay for shipping or jump through hoops1.
How We Can Help
Google-sponsored research shows that price, deals, and promotions are important to 68% of back-to-school shoppers.7 In addition, shoppers want certainty that they will get what they want. Google Cloud can make it easier for retailers to enable customers to find the right products with discovery solutions. These solutions provide Google-quality search and recommendations on a retailer’s own digital properties, helping to increase conversions and reduce search abandonment. In addition, Quantum Metric solutions, available on the Google Cloud Marketplace, are built with BigQuery, which helps retailers consolidate and unlock the power of their raw data to identify areas of friction and deliver improved digital shopping experiences.
We invite you to watch the Total Retail webinar “4 ways retailers can get ready for back-to-school, off-to college” on demand and to view the full Back-to-School Retail Benchmarks report from Quantum Metric.
Sources:
1. Back-to-School Retail Benchmarks report from Quantum Metric
2. Google/Ipsos,Moments 2021, Jun 2021, Online survey, US, n=335 Back to School shoppers
3. Google/Ipsos, Moments 2021, Jun 2021, Online survey, US, n=2,006 American general population 18+
4. Google/Ipsos, Holiday Shopping Study, Oct 2021 – Jan 2022, Online survey, US, n=7,253, Americans 18+ who conducted holiday shopping activities in past two days
5. Google Cloud Blog, Nov 2021, “Research: Search abandonment has a lasting impact on brand loyalty”
6. McKinsey & Company, “Personalizing the customer experience: Driving differentiation in retail”
7. Think with Google, July 2021, “What to expect from shoppers this back-to-school season”
6075
Of your peers have already watched this video.
1:30 Minutes
The most insightful time you'll spend today!
Explore the Innovations and Architecture Powering Spanner and BigQuery
Previously, databases had architectures with tightly coupled storage and compute. This resulted in higher latency, and with faster networks these constraints no longer surface. With Google Cloud’s BigQuery and CloudSpanner, the storage and compute architecture have been separated, allowing for better scalability and availability to address businesses’ high throughput data needs.
Watch the video to understand how these database and analysis products leverage Google’s distributed storage system, in-house custom network hardware and software, internal cluster management system and more!
2910
Of your peers have already watched this video.
36:00 Minutes
The most insightful time you'll spend today!
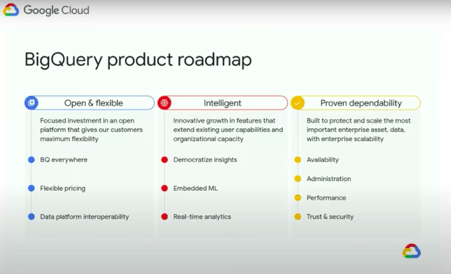
What’s New in BigQuery, Google Cloud’s Modern Data Warehouse
The demands that today’s enterprise has from data go far beyond the capabilities of traditional data warehousing. For many leaders, the need to digitally transform their businesses is a key driver for data analytics spending.
Businesses want to make real-time decisions from fresh information as well as make predictions from their data in order to remain competitive.
In this video, watch Sudhir Hasbe, Director of Product Management, Data Analytics, Google Cloud and Tino Tereshko, Product Manager, BigQuery, Google Cloud demonstrate what’s new in BigQuery, Google Cloud’s enterprise data warehouse, and hear about all the latest feature innovations and see some amazing demos.
More Relevant Stories for Your Company

How to Enhance Incremental Pipeline Performance while Ingesting Data into BigQuery
When you build a data warehouse, the important question is how to ingest data from the source system to the data warehouse. If the table is small you can fully reload a table on a regular basis, however, if the table is large a common technique is to perform incremental

STAC-M3 Tick History Analytics in Google Cloud Benchmark Results Reveals it is 18X Faster than Previous Version
The Securities Technology Analysis Center (STAC®), an organization that improves technology discovery and assessment in the finance industry through dialog and research, recently audited the STAC-M3™ benchmark suite on Google Cloud (SUT ID KDB211210). These enterprise tick-analytics benchmarks assess the ability of a solution stack such as database software, servers,

Google Cloud Named Leader of AI Infrastructure: Forrester Research
Forrester Research has named Google Cloud a Leader in The Forrester Wave™: AI Infrastructure, Q4 2021 report authored by Mike Gualtieri and Tracy Woo. In the report, Forrester evaluated dimensions of AI architecture, training, inference and management against a set of pre-defined criteria. Forrester’s analysis and recognition gives customers the confidence they




How to Build and Maintain Spark and Hadoop Clusters Quickly, Easily and Inexpensively
How often have you struggled to create Spark and Hadoop clusters only to have them become unstable? Building and maintaining clusters that are the building blocks of big data analytics should not be a time-consuming, repetitive, and expensive process. But with the current set of tools, it often is. Google
