





3426
Of your peers have already watched this video.
19:30 Minutes
The most insightful time you'll spend today!
Data vs. COVID-19: How public data is helping flatten the curve
The outbreak of COVID-19 has changed the reality of millions of lives around the world. Communities around the world began social distancing, events were cancelled, and healthcare efforts redirected to fight the pandemic.
Hear how public data and the Google Cloud COVID-19 Public Datasets Program is helping combat the pandemic and informing individual decision-making to help everyone make informed decisions about the spread and risks of the virus, and how cooperative efforts could help flatten the curve.
In this presentation, Javier de la Torre, Founder and Chief Strategy Officer of Carto, and Shane Glass, Developer Advocate, Google Cloud demonstrate how the Carto platform is contributing to spatial analysis and understanding for how the outbreak evolved over time as government policies and social distancing measures were put into place.
They also show how to access these public datasets, what is included in the COVID-19 Public Datasets Program, and how you can use these datasets to develop maps and dashboards that will help us continue to combat the pandemic.
Home Depot Leverages Google Cloud’s BigQuery and DataFlow to Break Data Silos and Craft Personalized CX

5009
Of your peers have already read this article.
4:00 Minutes
The most insightful time you'll spend today!
The Home Depot, Inc., is the world’s largest home improvement retailer with annual revenue of over $151B. Delighting our customers—whether do-it-yourselfers or professionals—by providing the home improvement products, services, and equipment rentals they need, when they need them, is key to our success.
We operate more than 2,300 stores throughout the United States, Canada, and Mexico. We also have a substantial online presence through HomeDepot.com, which is one of the largest e-commerce platforms in the world in terms of revenue. The site has experienced significant growth both in traffic and revenue since the onset of Covid-19.
Because many of our customers shop at both our brick-and-mortar stores and online, we’ve embarked on a multi-year strategy to offer a shopping experience that seamlessly bridges the physical and digital worlds. To maximize value for the increasing number of online shoppers, we’ve shifted our focus from event marketing to personalized marketing, as we found it to be far more effective in improving the customer experience throughout the sales journey. This led to changing our approach to marketing content, email communications, product recommendations, and the overall website experience.
Challenge: launching a modern marketing strategy using legacy IT
For personalized marketing to be successful, we had to improve our ability to recognize a customer at the point of transaction so we could—among other things—suspend irrelevant and unnecessary advertising. Most of us have experienced the annoyance of receiving ads for something we’ve already purchased, which can degrade our perception of the brand itself. While many online retailers can identify 100% of their customer transactions due to the rich information captured during checkout, most of our transactions flow through physical stores, making this a more difficult problem to solve.
Our old legacy IT system, which ran in an on-premises data center and leveraged Hadoop, also challenged us since maintaining both the hardware and software stack required significant resources. When that system was built, personalized marketing was not a priority, so it took several days to process customer transaction data and several weeks to roll out any system changes. Further, managing and maintaining the large Hadoop cluster base presented its own set of issues in terms of quality control and reliability, as did keeping up with open-source community updates for each data processing layer.
Adopting a hybrid approach
As we worked through the challenges of our legacy system, we started thinking about what we wanted our future system to look like. Like many companies, we began with a “build vs. buy” analysis. We looked at several products on the market and determined that while each of them had their strengths, none was able to offer the complete set of features we needed.
Our project team didn’t think it made sense to build a solution from scratch, nor did we have access to the third-party data we needed. After much consideration, we decided to adopt a solution that combined a complete rewrite of the legacy system with the support of a partner to help with the customer transaction matching process.
Building the foundation on Google Cloud
We chose Google Cloud’s data platform, specifically BigQuery, Dataflow, DataProc, Cloud Storage, and Cloud Composer. Google Cloud platform empowered us to break down data silos and unify each stage of the data lifecycle from ingestion, storage, and processing to analysis and insights. Google Cloud offered best-in-class integration with open-source standards and provided the portability and extensibility we needed to make our hybrid solution work well. The open standards of BigQuery’s BQ Storage API allowed us to leverage fast BQ storage layers to be utilized with other compute platforms, e.g., DataProc.
We used BigQuery combined with Dataflow to integrate our first- and third-party data into an enterprise data and analytics data lake architecture. The system then combined previously siloed data and used BigQuery ML to create complete customer profiles spanning the entire shopping experience, both in-store and online.
Understanding the customer journey with the help of Dataflow and BigQuery
The process of developing customer profiles involves aggregating a number of first- and third-party data sources to create a 360-degree view of the customer based on both their history and intent. It starts with creating a single historical customer profile through data aggregation, deduplication, and enrichment. We used several vendors to help with customer resolution and NCOA (Change of Address) updates, which allows the profile to be house-holded and transactions to be properly reconciled to both the individual and the household. This output is then matched to different customer signals to help create an understanding of where the customer is in their journey—and how we can help.
The initial implementation used Google Dataflow, Google’s streaming analytics solution, to load data from Google Cloud Storage into BigQuery and perform all necessary transformations. The Dataflow process was converted into BQML (BigQuery Machine Learning) since this significantly reduced costs and increased visibility into data jobs. We used Google Cloud Composer, a fully managed workflow orchestration service, to help orchestrate all data operations and DataProc and Google Kubernetes Engine to enable special case data integration so we could quickly pivot and test new campaigns. The architecture diagram below shows the overall structure of our solution.
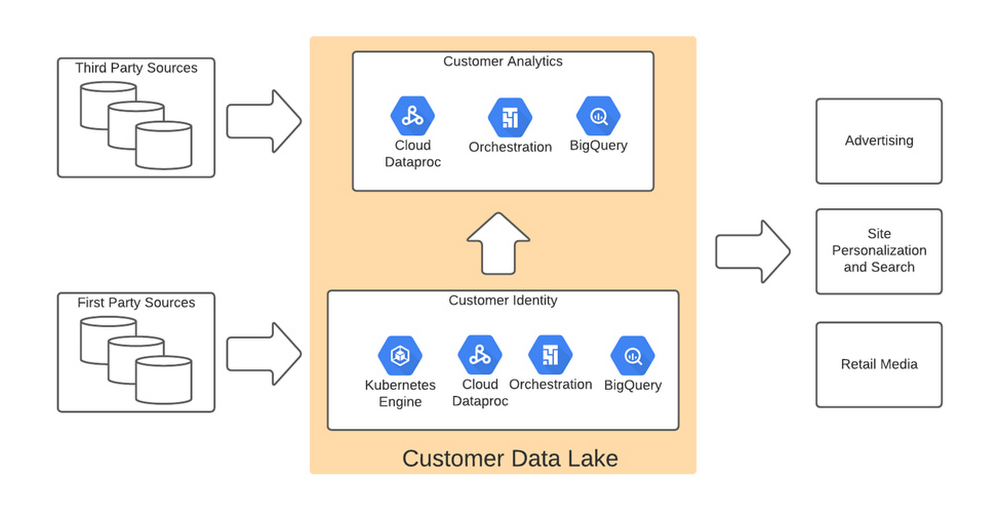
Taking full advantage of cloud-native technology
In our initial migration to Google Cloud, we moved most of our legacy processes in their original form. However, we quickly learned that this approach didn’t take full advantage of the cloud-native and more improved features Google Cloud offered such as auto scaling of resources, flexibility to decouple storage from the compute layer, and a wide variety of options to choose the best tool for the job. We refactored our Hadoop-based data pipelines written in Java-based Map Reduce and our Pig Latin jobs to Dataflow and BigQuery jobs. This dramatically reduced processing time and made our data pipeline code concise and efficient.
Previously, our legacy system processes ran longer than intended, and data was not used efficiently. Optimizing our code to be cloud-native and leveraging all the capabilities of Google Cloud services resulted in reduced run times. We decreased our data processing window from 3 days to 24 hours, improved resource usage by dramatically reducing the amount of compute we used to possess this data, and built a more streamlined system. This in turn reduced cloud costs and provided better insight. For example, DataFlow offers powerful native features to monitor data pipelines, enabling us to be more agile.
Leveraging the flexibility and speed of the cloud to improve outcomes
Today, using a continuous integration/continuous delivery (CI/CD) approach, we can deploy multiple system changes each week to further improve our ability to recognize in-store transactions. Leveraging the combined capabilities of various Google Cloud systems—BigQuery, DataFlow, Cloud Composer, Dataproc, and Cloud Storage–we drastically increased our ability to recognize transactions and can now connect over 75% of all transactions to an existing household. Further, the flexible Google Cloud environment coupled with our cloud-native application makes our team more nimble and better able to respond to emerging problems or new opportunities.
Increased speed has led to better outcomes in our ability to match transactions across all sales channels to a customer and thereby improve their experience. Before moving to Google Cloud, it took 48 to 72 hours to match customers to their transactions, but now we can do it in less than 24 hours.
Making marketing more personal—and more efficient
The ability to quickly match customers to transactions has huge implications for our downstream marketing efforts in terms of both cost and effectiveness. By knowing what a customer has purchased, we can turn off ads for products they’ve already bought or offer ads for things that support what they’ve bought recently. This helps us use our marketing dollars much more efficiently and offer an improved customer experience.
Additionally, we can now apply the analytical models developed using BQML and Vertex AI to sort customers into audiences. This allows us to more quickly identify a customer’s current project, such as remodeling a kitchen or finishing a basement, and then personalize their journey by offering them information on products and services that matter most at a given point through our various marketing channels. This provides customers with a more relevant and customized shopping journey that mirrors their individual needs.
Protecting a customer’s privacy
With this ability to better understand our customers, we also have the responsibility to ensure we have good oversight and maintain their data privacy. Google’s cloud solutions provide us the security needed to help protect our customers’ data, while also being flexible enough to allow us to support state and federal regulations, like the California Customer Privacy Act. This way we can provide a customer the personalized experience they desire without having to fear how their data is being used.
With flexible Google Cloud technology in place, The Home Depot is well positioned to compete in an industry where customers have many choices. By putting our customers’ needs first, we can stay top of mind whenever the next project comes up.
2846
Of your peers have already watched this video.
22:00 Minutes
The most insightful time you'll spend today!
Deploying Real-time AI: A Walkthrough
Enterprises are increasingly looking to leverage streaming data (customer interactions, sales transactions, machine logs) for building new innovative features, increasing sales, and protecting against risks.
AI/ML (artificial intelligence/machine learning) technologies make it possible to amp up the detection of insights in large volumes of data: insights that otherwise would be impossible to gain with manual inspection.
Learn how Dataflow together with TensorFlow Extended (TFX) and Cloud AI are enabling the extraction of label and classification information from video clips and natural text, predicting probabilities and detecting anomalies, fraud, and patterns in streams of business data.
The Query Execution Graph: Your Key to Better BigQuery Analytics

3087
Of your peers have already read this article.
2:30 Minutes
The most insightful time you'll spend today!
BigQuery offers strong query performance, but it is also a complex distributed system with many internal and external factors that can affect query speed. When your queries are running slower than expected or are slower than prior runs, understanding what happened can be a challenge.
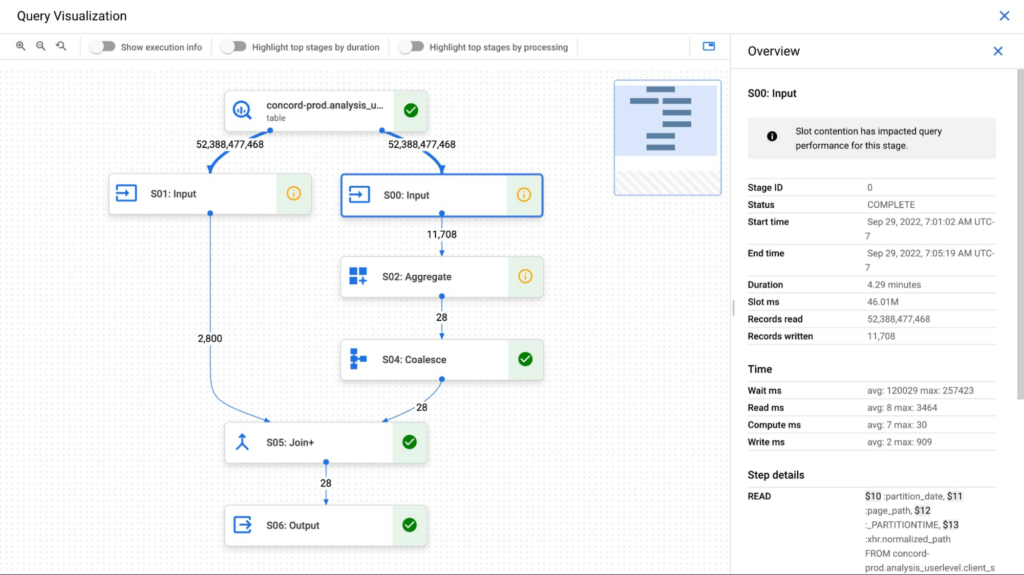
The query execution graph provides an intuitive interface for inspecting query execution details. By using it, you can review the query plan information in graphical format for any query, whether running or completed.
You can also use the query execution graph to get performance insights for queries. Performance insights provide best-effort suggestions to help you improve query performance. Since query performance is multi-faceted, performance insights might only provide a partial picture of the overall query performance.
Execution graph
When BigQuery executes a query job, it converts the declarative SQL statement into a graph of execution, broken up into a series of query stages, which themselves are composed of more granular sets of execution steps. The query execution graph provides a visual representation of the execution stages and shows the corresponding metrics. Not all stages are made equal. Some are more expensive and time consuming than others. The execution graph provides toggles for highlighting critical stages, which makes it easier to spot the potential performance bottlenecks in the query.
Query performance insights
In addition to the detailed execution graph BigQuery also provides specific insights on possible factors that might be slowing query performance.
Slot contention
When you run a query, BigQuery attempts to break up the work needed by your query into tasks. A task is a single slice of data that is input into and output from a stage. A single slot picks up a task and executes that slice of data for the stage. Ideally, BigQuery slots execute tasks in parallel to achieve high performance. Slot contention occurs when your query has many tasks ready for slots to start executing, but BigQuery can’t get enough available slots to execute them.
Insufficient shuffle quota
Before running your query, BigQuery breaks up your query’s logic into stages. BigQuery slots execute the tasks for each stage. When a slot completes the execution of a stage’s tasks, it stores the intermediate results in shuffle. Subsequent stages in your query read data from shuffle to continue your query’s execution. Insufficient shuffle quota occurs when you have more data that needs to get written to shuffle than you have shuffle capacity.
Data input scale change
Getting this performance insight indicates that your query is reading at least 50% more data for a given input table than the last time you ran the query and hence experiencing query slowness. You can use table change history to see if the size of any of the tables used in the query has recently increased.
What’s next?
We continue to work on improving the visualization of the graph. We are working on adding additional metrics to each step and adding more performance insights that will make query diagnosis significantly easier. We are just getting started.
Updating Twitter’s Ad Engagement Analytics Platform for the Modern Age

3102
Of your peers have already read this article.
3:30 Minutes
The most insightful time you'll spend today!
As part of the daily business operations on its advertising platform, Twitter serves billions of ad engagement events, each of which potentially affects hundreds of downstream aggregate metrics. To enable its advertisers to measure user engagement and track ad campaign efficiency, Twitter offers a variety of analytics tools, APIs, and dashboards that can aggregate millions of metrics per second in near-real time.
In this post, you’ll get details on how the Twitter Revenue Data Platform engineering team, led by Steve Niemitz, migrated their on-prem architecture to Google Cloud to boost the reliability and accuracy of Twitter’s ad analytics platform.
Deciding to migrate
Over the past decade, Twitter has developed powerful data transformation pipelines to handle the load of its ever-growing user base worldwide. The first deployments for those pipelines were initially all running in Twitter’s own data centers. The input data streamed from various sources into Hadoop Distributed File System (HDFS) as LZO-compressed Thrift files in an Elephant Bird container format. The data was then processed and aggregated in batches by Scalding data transformation pipelines. Then, aggregation results were output into Manhattan, Twitter’s homegrown distributed key-value store, for serving. Additionally, a streaming system using Twitter’s homegrown systems Eventbus (a messaging tool built on top of DistributedLog), Heron (a stream processing engine), and Nighthawk (a sharded Redis deployment) powered the real-time analytics that Twitter had to provide, filling the gap between the current time and the last batch run.
While this system consistently sustained massive scale, its original design and implementation was starting to reach some limits. In particular, some parts of the system that had grown organically over the years were difficult to configure and extend with new features. Some intricate, long-running jobs were also unreliable, leading to sporadic failures. The legacy end-user serving system was very expensive to run and couldn’t support large queries.
To accommodate for the projected growth in user engagement over the next few years and streamline the development of new features, the Twitter Revenue Data Platform engineering team decided to rethink the architecture and deploy a more flexible and scalable system in Google Cloud.
Platform modernization: First iteration
In the middle of 2017, Steve and his team tackled the first redesign iteration of its advertising data platform modernization, leading to Twitter’s collaboration with Google Cloud.
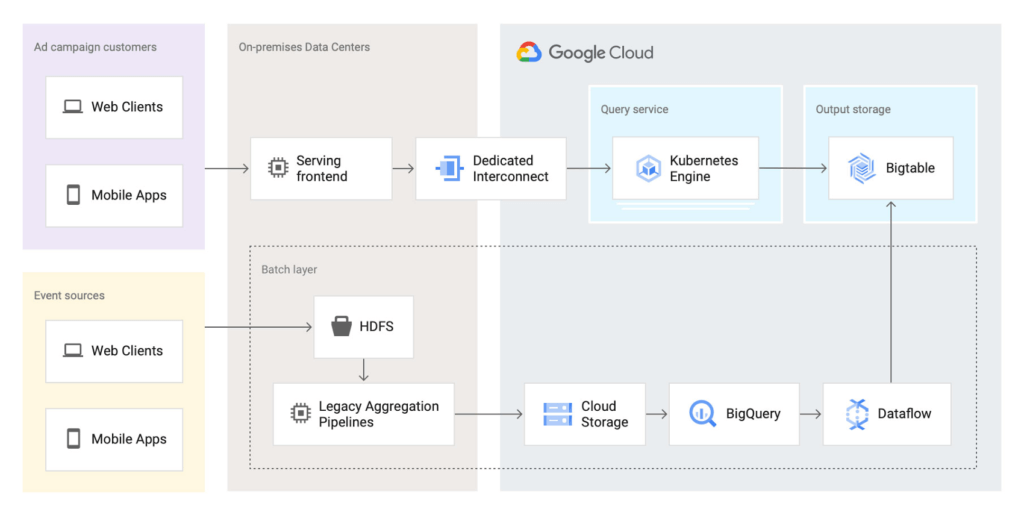
At first, the team left the data aggregation legacy Scalding pipelines unchanged and continued to run them in Twitter’s data centers. But the batch layer’s output was switched from Manhattan to two separate storage locations in Google Cloud:
- BigQuery—Google’s serverless and highly scalable data warehouse, to support ad-hoc and batch queries.
- Cloud Bigtable—Google’s low-latency, fully managed NoSQL database, to serve as a back end for online dashboards and consumer APIs.
The output aggregations from the Scalding pipelines were first transcoded from Hadoop sequence files to Avro on-prem, staged in four-hour batches to Cloud Storage, and then loaded into BigQuery. A simple pipeline deployed on Dataflow, Google Cloud’s fully managed streaming and batch analytics service, then read the data from BigQuery and applied some light transformations. Finally, the Dataflow pipeline wrote the results into Bigtable.
The team built a new query service to fetch aggregated values from Bigtable and process end-user queries. They deployed this query service in a Google Kubernetes Engine (GKE) cluster in the same region as the Bigtable instance to optimize for data access latency.
Here’s a look at the architecture:
This first iteration already brought many important benefits:
- It de-risked the overall migration effort, letting Twitter avoid migrating both the aggregation business logic and storage at the same time.
- The end-user serving system’s performance improved substantially. Thanks to Bigtable’s linear scalability and extremely low latency for data access, the serving system’s P99 latencies decreased from 2+ seconds to 300ms.
- Reliability increased significantly. The team now rarely, if ever, gets paged for the serving system anymore.
Platform modernization: second iteration
With the new serving system in place, in 2019 the Twitter team began to redesign the rest of the data analytics pipeline using Google Cloud technologies. The redesign sought to solve several existing pain points:
- Because the batch and streaming layers ran on different systems, much of the logic was duplicated between systems.
- While the serving system had been moved into the cloud, the existing pain points of the Hadoop aggregation process still existed.
- The real-time layer was expensive to run and required significant operational attention.
With these pain points in mind, the team began evaluating technologies that could help solve them. They considered several open-source stream processing frameworks initially: Apache Flink, Apache Kafka Streams, and Apache Beam. After evaluating all possible options, the team chose Apache Beam for a few key reasons:
- Beam’s built-in support for exactly-once operations at extremely large scale across multiple clusters.
- Deep integration with other Google Cloud products, such as Bigtable, BigQuery, and Pub/Sub, Google Cloud’s fully managed, real-time messaging service.
- Beam’s programming model, which unifies batch and streaming and lets a single job operate on either batch inputs (Cloud Storage), or streaming inputs (Pub/Sub).
- The ability to deploy Beam pipelines on Dataflow’s fully managed service.
The combination of Dataflow’s fully managed approach and Beam’s comprehensive feature set let Twitter simplify the structure of its data transformation pipeline, as well as increase overall data processing capacity and reliability.
Here’s what the architecture looks like after the second iteration:
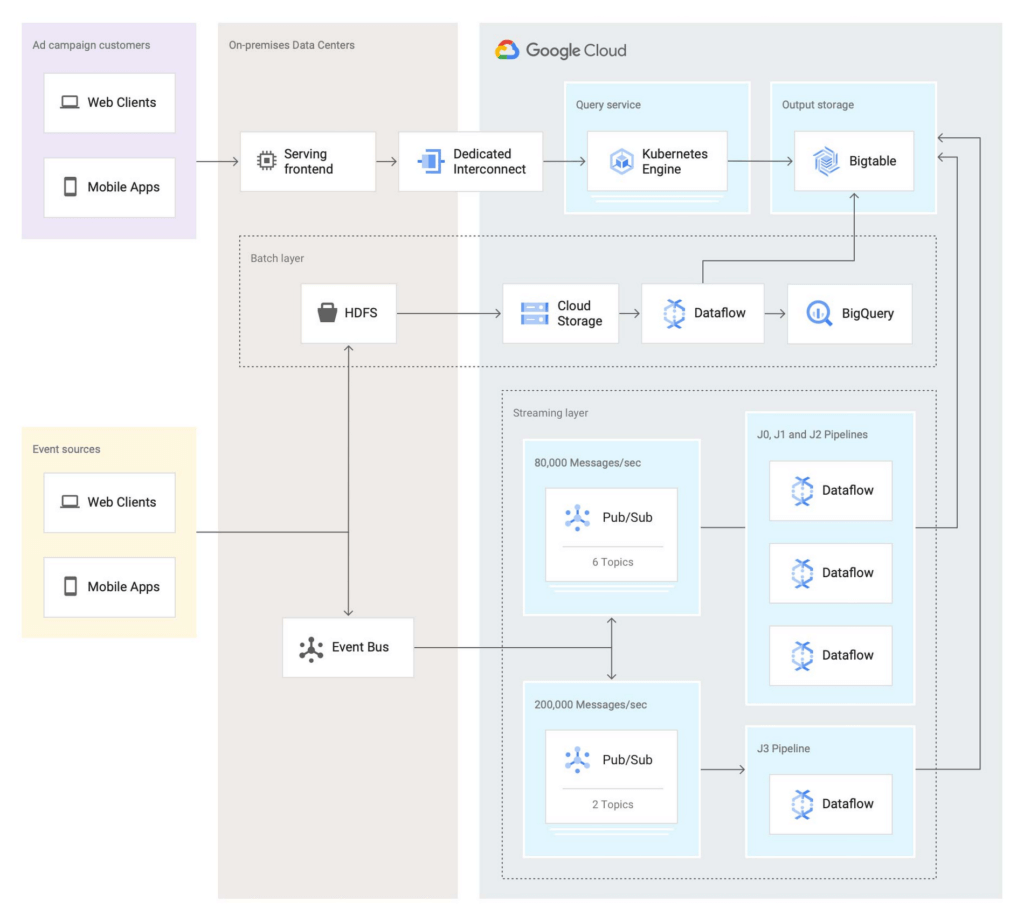
In this second iteration, the Twitter team re-implemented the batch layer as follows: Data is first staged from on-prem HDFS to Cloud Storage. A batch Dataflow job then regularly loads the data from Cloud Storage, processes the aggregations, and dual-writes the results to BigQuery for ad-hoc analysis and Bigtable for the serving system.
The Twitter team also deployed an entirely new streaming layer in Google Cloud. For data ingestion, an on-prem service now pushes two different streams of Avro-formatted messages to Pub/Sub. Each message contains a bundle of multiple raw events and affects between 100 and 1,000 aggregations. This leads to more than 3 million aggregations per second performed by four Dataflow jobs (J0-3 in the diagram above). All Dataflow jobs share the same topology, although each job consumes messages from different streams or topics.
One stream, which contains critical data, enters the system at a rate of 200,000 messages per second and is partitioned in two separate Pub/Sub topics. A Dataflow job (J3 in the diagram) consumes those two streams, performs 400,000 aggregations per second, and outputs the results to a table in Bigtable.
The other stream, which contains less critical but higher volume data, enters the system at a rate of around 80,000 messages per second and is partitioned into six separate topics. Three Dataflow jobs (J0, J1, and J2) share the processing of this larger stream, with each of them handling two of the available six topics in parallel, then also outputting the results to a table in Bigtable. In total, those three jobs process over 2 million aggregations/second.
Partitioning the high-volume stream into multiple topics offers a number of advantages:
- The partitioning is organized by applying a hash function on the aggregation key and then dividing the function’s result by the number of available partitions (in this case, six). This guarantees that any per-key grouping operation in downstream pipelines is scoped to a single partition, which is required for consistent aggregation results.
- When deploying updates to the Dataflow jobs, admins can drain and relaunch each job individually in sequence, allowing the remaining pipelines to continue uninterrupted and minimizing impact on the end users.
- The three jobs can each handle two topics without issue currently, and there is still room to scale horizontally up to six jobs if needed. The number of topics (six) is arbitrary, but is a good balance at the moment based on current needs and potential spikes in traffic.
To assist with job configuration, Twitter initially considered using Dataflow’s template system, a powerful feature that enables the encapsulation of Dataflow pipelines into repeatable templates that can be configured at runtime. However, since Twitter needed to deploy jobs with topologies that might change over time, the team decided instead to implement a custom declarative system where developers can specify different parameters for their jobs in a pystachio DSL: tuning parameters, data sources to operate on, sink tables for aggregation outputs, and the jobs’ source code location. A new major version of Dataflow templates, called Flex Templates, will remove some of the previous limitations with the template architecture and allow any Dataflow job to be templatized.
For job orchestration, the Twitter team built a custom command line tool that processes the configuration files to call the Dataflow API and submit jobs. The tool also allows developers to submit a job update by automatically performing a multi-step process, like this:
- Drain the old job:
- Call the Dataflow API to identify which data sources are used in the job (for example, a Pub/Sub topic reader).
- Initiate a drain request.
- Poll the Dataflow API for the watermark of the identified sources until the maximum watermark is hit, which indicates that the draining operation is complete.
- Launch the new job with the updated code.
This simple, flexible, and powerful system allows developers to focus on their data transformation code without having to be concerned about job orchestration or the underlying infrastructure details.
Looking ahead
Six months after fully transitioning its ad analytics data platform to Google Cloud, Twitter has already seen huge benefits. Twitter’s developers have gained in agility as they can more easily configure existing data pipelines and build new features much faster. The real-time data pipeline has also greatly improved its reliability and accuracy, thanks to Beam’s exactly-once semantics and the increased processing speed and ingestion capacity enabled by Pub/Sub, Dataflow, and Bigtable.
Twitter engineers have enjoyed working with Dataflow and Beam for several years now, since version 2.2, and plan to continue expanding their usage. Most importantly, they’ll soon merge the batch and streaming layers into a single, authoritative streaming layer.
Throughout this project, the Twitter team collaborated very closely with Google engineers to exchange feedback and discuss product enhancements. We look forward to continuing this joint technical effort on several ongoing large-scale cloud migration projects at Twitter. Stay tuned for more updates!
Seven-Eleven Japan Leverages Google Cloud’s Performance and Speed for Real-time Business Insights

6840
Of your peers have already read this article.
4:00 Minutes
The most insightful time you'll spend today!
With the rise of technologies like smartphones, retailers have felt the pressure to meet evolving consumer needs and expectations. Seven-Eleven Japan(“SEJ”) has long been on the forefront of this thanks to the way they develop and invest in IT. However, in recent years, Japan’s leading convenience store chain has struggled to maintain its complex legacy systems at the rate needed to keep up with today’s rapid digitization, spurred on by the increasing proliferation of smartphones and an IT vendor-dependent structure.
Legacy systems limiting real-time responsiveness and innovation
Since its early days, SEJ has been proactive in adopting information technology, mainly relying on technology solutions from Japan’s leading vendors. But as the systems have grown, key business issues have been resolved using a vendor-dependent structure rather than being driven by SEJ’s own needs.
Datasets and business logic were combined and built into legacy environments, gradually leading to data silos. As a result, data was distributed across multiple systems, causing a variety of problems, including the inability to efficiently retrieve data when needed, delays in accessing data collected in individual stores, and difficulties taking measurements at the right time in business operations that require real-time responsiveness.
Connecting different systems also takes time and money, and the lead time for introducing new services—from planning to development and launch—has been longer than expected.
To solve these problems, SEJ’s IT department built “Seven Central”—a new platform for practical data use launched in 2020 to support the company’s future IT strategies and digital transformation initiatives.
At its core, Seven Central’s ultimate purpose is to allow real-time data views. Versatile, real-time datasets—such as point-of-sale (POS) data from 7-Eleven stores—are consolidated into a centralized location in the cloud. They created a simple data mart that provides data via an API to enable them to respond more quickly to requests from individual departments.
“In such uncertain times, it’s vital to use data to make quick decisions,” says Izuru Nishimura, Executive Officer and Head of ICT Department. “Each department across the entire company will be able to gain an immediate understanding of the situation based on the most up-to-date data and respond accordingly. This is why we built Seven Central.”
Google Cloud selected to help SEJ build and grow their data cloud
Today’s rapidly changing business environment has also highlighted the risk of IT support becoming a bottleneck. The long-term strategy is to gradually expand the datasets managed and collected in Seven Central according to business needs.
In the first phase, SEJ collected POS data from all 21,000+ stores to enable real-time analysis. Moving forward, they would like to collect other relevant data—for example, unstructured data, such as images and videos, or master datasets that are currently stored externally.
Google Cloud was already a top contender when SEJ started developing Seven Central in 2019. They compared various public cloud services besides Google Cloud, focusing on three main capabilities.
“We placed particular emphasis on service scalability to drive future digital transformation; security when handling data, which is the lifeline of our company; and finally, openness,” says Nishimura. He emphasizes that openness was perhaps the most important factor for choosing Google Cloud. Breaking away from the negative aspects of an entirely vendor-dependent system enabled them to build an agile development system with multiple vendors.
Google Cloud technologies including BigQuery and API management platform, Apigee, play a vital role in Seven Central. BigQuery’s high-speed processing at petabyte scale and fully managed infrastructure helped keep costs low during development and verification.
“Data is stored in a way that allows you to share it easily across organizations, which helps solve the issue of data silos from the perspective of scalability. I also like the fact there are some interesting features that could be used in the future—like BigQuery ML, which enables machine learning on BigQuery,” says Nishimura.
Apigee allows SEJ to separate datasets and business logic, which is one of the key points of Seven Central. While the trend these days is to standardize interfaces using an API, the reality tends to involve many different APIs rather than the introduction of one unified API. With Apigee, SEJ provides a single unified API for all of its data cloud, and they can now understand what data is used thanks to Apigee’s API usage visualizations.
“Right now, we collect data from all 21,000+ stores,” says Nishimura. “But in anticipation of a future expansion in business operations, we have designed a system that can scale up and run without issue, even if we were to have 30,000 stores, with 1,000 customers per store per day, purchasing five items per person.”
Real-time insights with BigQuery and Cloud Spanner
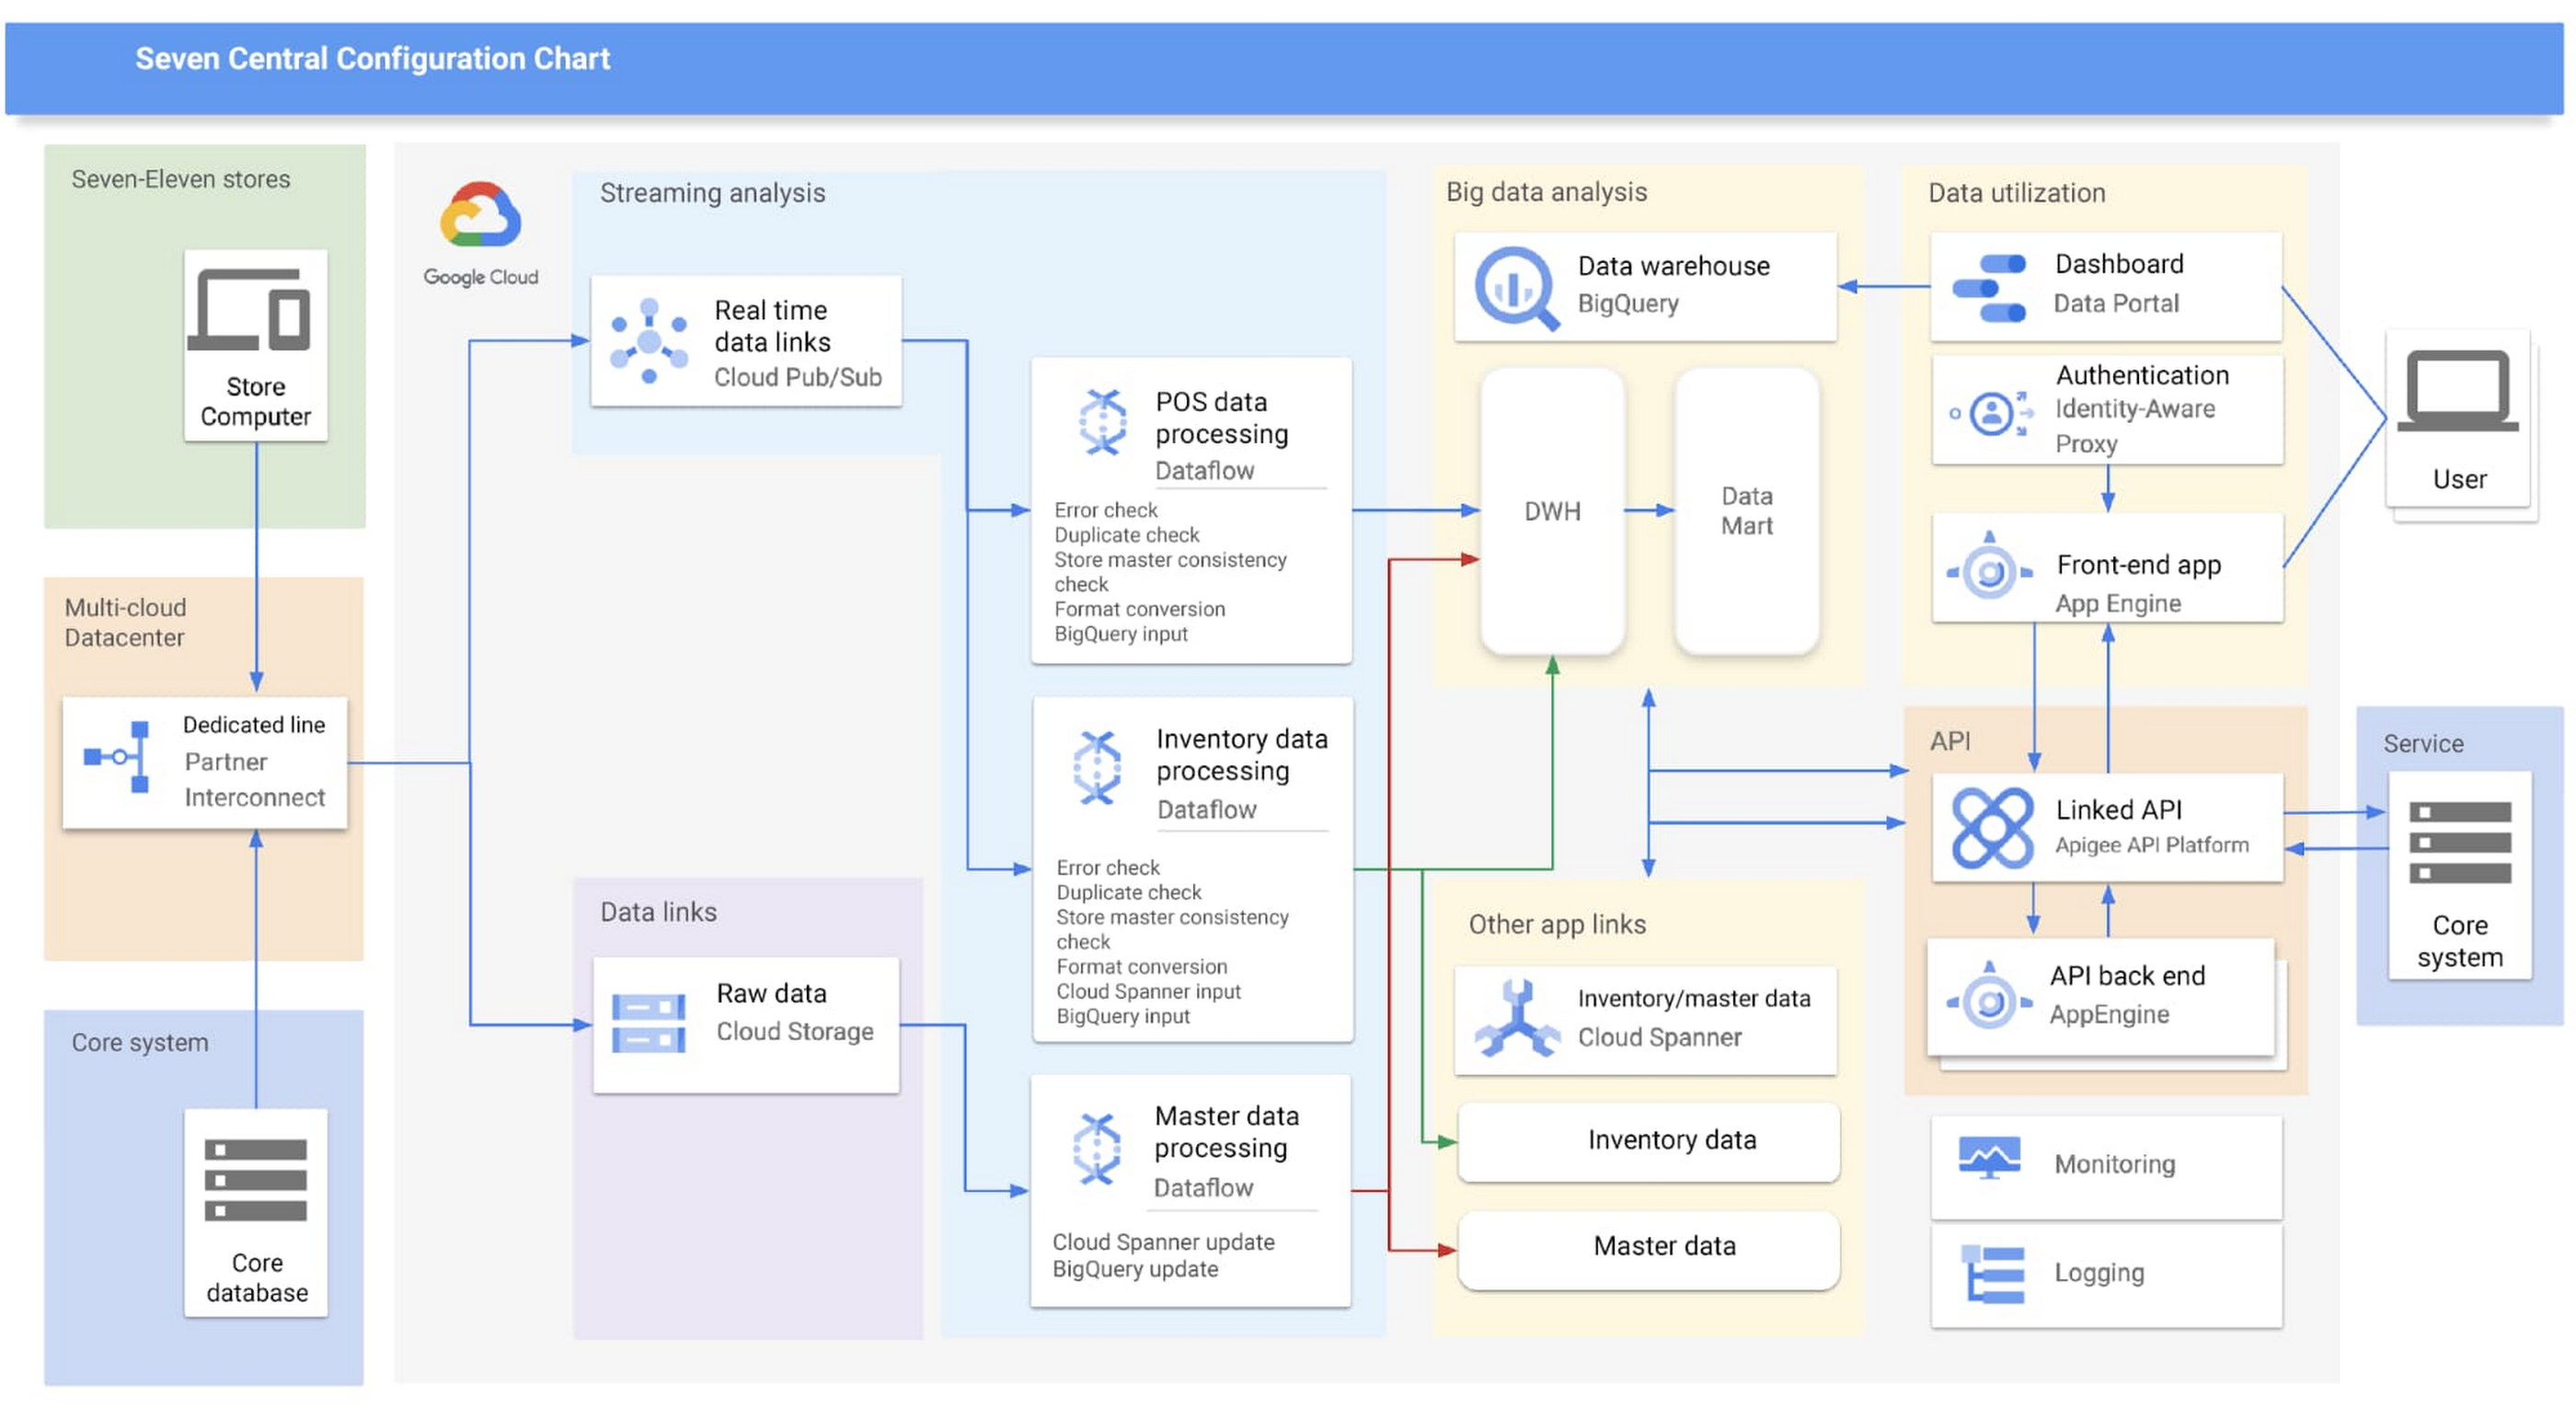
Google Cloud partner Cloud Ace came on board early in the planning phases. Based on their recommendations, SEJ decided to continue making full use of BigQuery to analyze data collected from all 21,000+ stores throughout Japan, while also using Cloud Spanner’s availability, near-unlimited scalability and transactional consistency to help achieve the real-time results needed for the project.
“Given that both the data and the regularity with which it is accessed are expected to steadily increase in the future, we chose Cloud Spanner as backend storage for data delivery via API. We consider it a good choice,” says Shota Kikuchi, General Manager, Consulting Department, Technology Division, Cloud Ace Co., Ltd.
Finally, they chose to use Google Cloud’s Stream Analytics Solutions messaging service for collecting POS data in real time, which can then be put to immediate use with Cloud Spanner and BigQuery.
High-speed responses exceed targets and create new value
Seven Central went live in September 2020 with surprising results.
They initially set a target time of one hour from when a customer makes a purchase to the point when Seven Central can use that data. But when the final system was first tried—it took barely a minute. Moving forward they estimate that the latest inventory data from the service side will become available within a few minutes of being added to the system.
“This is real innovation, and I must admit that I am quite surprised. As well as being able to solve existing issues, we also hope it will lead to new improvements and services that have been unimaginable up until now,” says Nishimura.
The team hopes to roll out the Seven Central platform in all companies affiliated with Seven & i Holdings—not just SEJ. They also plan to explore Google Cloud AI and machine learning technologies to take on challenges in new areas. For example, they are investigating the idea of clustering individual stores using BigQuery ML.
Seven Central has already attracted attention from many departments and received a lot of requests. Nishimura and his team say they hope to continue to grow Seven Central while still observing their fundamental principles—not including business logic, maintaining real-time results, and staying true to the uniqueness of SEJ.
Learn more about Google Cloud smart analytics solutions.
More Relevant Stories for Your Company

S4 Agtech Transforms Agriculture with Google Cloud
Like countless other industries, farming is going digital and undergoing big changes—driven by access to more actionable information. The agriculture business can now gather and analyze georeferenced data from satellites, combined with data from IoT sensors in fields, crop rotation and yield histories, weather patterns, seed genotypes and soil composition to help




The New and Upcoming Infrastructure for Google Cloud’s AI and ML Solutions
How does Google manage to provide its customers a differentiated compute platform experience and define ways to fully leverage its infrastructure supporting its cutting-edge AI and ML offerings? Easy-to-use, scalable and ability to create innovative products and services to end-users at low cost of ownership is the narrative behind Google

How Ather Energy is leveraging the Cloud to build and scale smart mobility solutions for India
In 2013, long before the world was discussing clean energy and sustainable practices, two IIT Madras graduates — Swapnil Jain and Tarun Mehta — had an idea to develop India’s first-ever electrical scooter. This was at a time when auto manufacturers were still focusing on fossil-fuel-driven vehicles and ‘eco-friendly’ mobility

How Constellation Brands’ Direct-to-Customer Tech Delivers Economic Impact across Business Portfolio
Editor’s note: Today we’re hearing from Ryan Mason, Director, Head of DTC Growth & Strategy, at alcoholic beverage firm, Constellation Brands on the company’s shift to Direct-to-Consumer (DTC) sales and how Google Cloud’s powerful technology stack helped with this transformation. It’s no secret that consumer businesses have been up-ended in
