






New Technology: The Projected Total Economic Impact™ Of Google Cloud Contact Center AI
READ FULL INTRODOWNLOAD AGAIN3363
Of your peers have already downloaded this article
15:30 Minutes
The most insightful time you'll spend today!
11206
Of your peers have already watched this video.
1:30 Minutes
The most insightful time you'll spend today!
Indian Retailer Figures Optimizes Hyperlocal Delivery to Increase Customer Experience
Anyone who follows the Indian e-commerce scene knows that one of the largest challenges these companies face is hyperlocal delivery.
That was a problem facing Wellness Forever, a retail chain of pharmacies with 150-plus stores across India.
“Exactly a year ago, we started our journey of hyperlocal deliveries. This optimization was a big time challenge for us to understand how to optimize this,” Palani Subbiah, CTO, Wellness Forever.
The problem in front of Wellness Forever was to identify which customer could can be sold from which store, so that a delivery could be made within 90 minutes.
“We handle a large amount of customer data and we wanted to use insights to help and improve the customer satisfaction index,” says Subbiah.
To do that Wellness Forever leveraged Google Big Query to run massive amount of data to come up with the operational insights. They also used Firebase and Google Maps.
“By 2021, we are going to have about 450 stores. Those stores are going to be not only a physical store, which is a digital store.
A Road to Possibilities: Google Maps Platform Website

7248
Of your peers have already read this article.
2:00 Minutes
The most insightful time you'll spend today!
For more than 15 years, developers have used Google Maps Platform to deliver location-based experiences to their end users and used location intelligence to optimize their businesses. Along this journey, we’ve made a variety of changes to better support our community as needs have changed and new industries and technologies have emerged. We started rolling out a new website experience, at https://mapsplatform.google.com, to help you better understand the products and solutions best suited to address your objectives. Plus, now you can directly connect to the developer documentation for each product to get started quickly, and you can visualize usage and associated costs to have a better idea of what to expect before getting started.
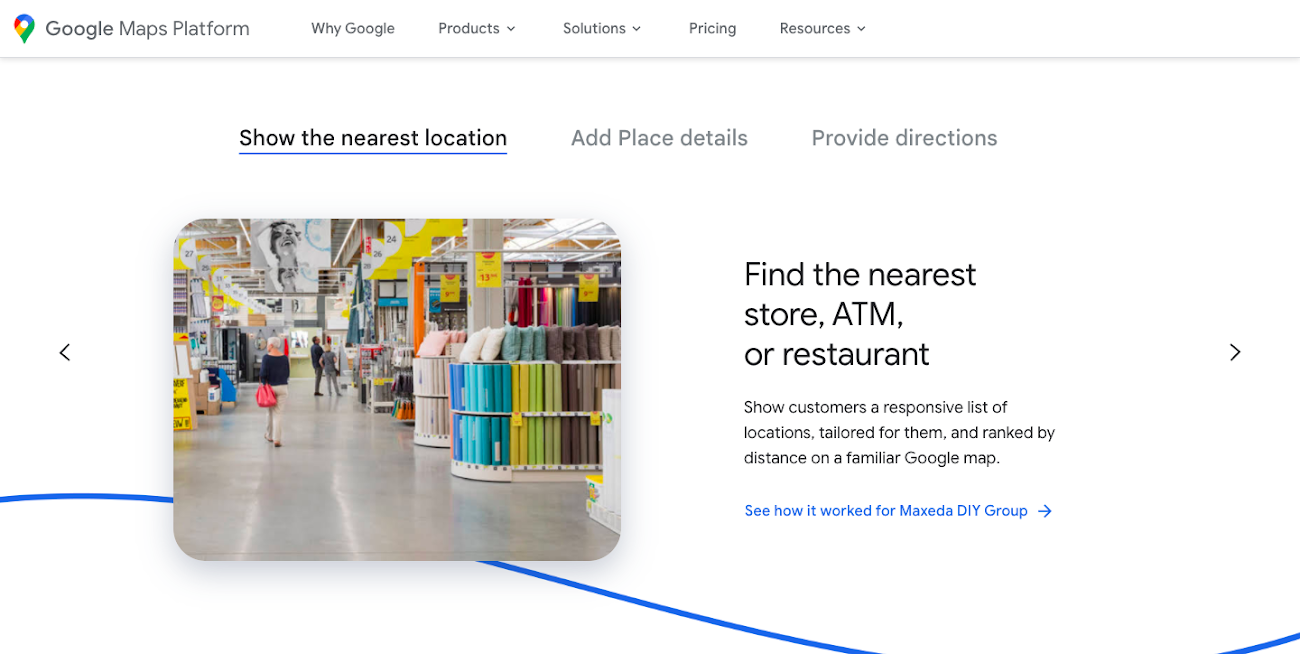
Getting to your solution faster
Maps, Routes, Places are building blocks that let you develop implementations for any use case. Building for specific use cases, however, typically requires using a combination of APIs and SDKs. To help you quickly understand what’s possible and what you need to build for your use case, you can now visit the solutions tab to select from a list of popular use cases or industries. Once you’ve selected a use case or industry, you’re taken to a page where you can explore relevant products, read helpful blog posts, see how other customers have deployed for similar use cases, and more.
Direct access to developer documentation
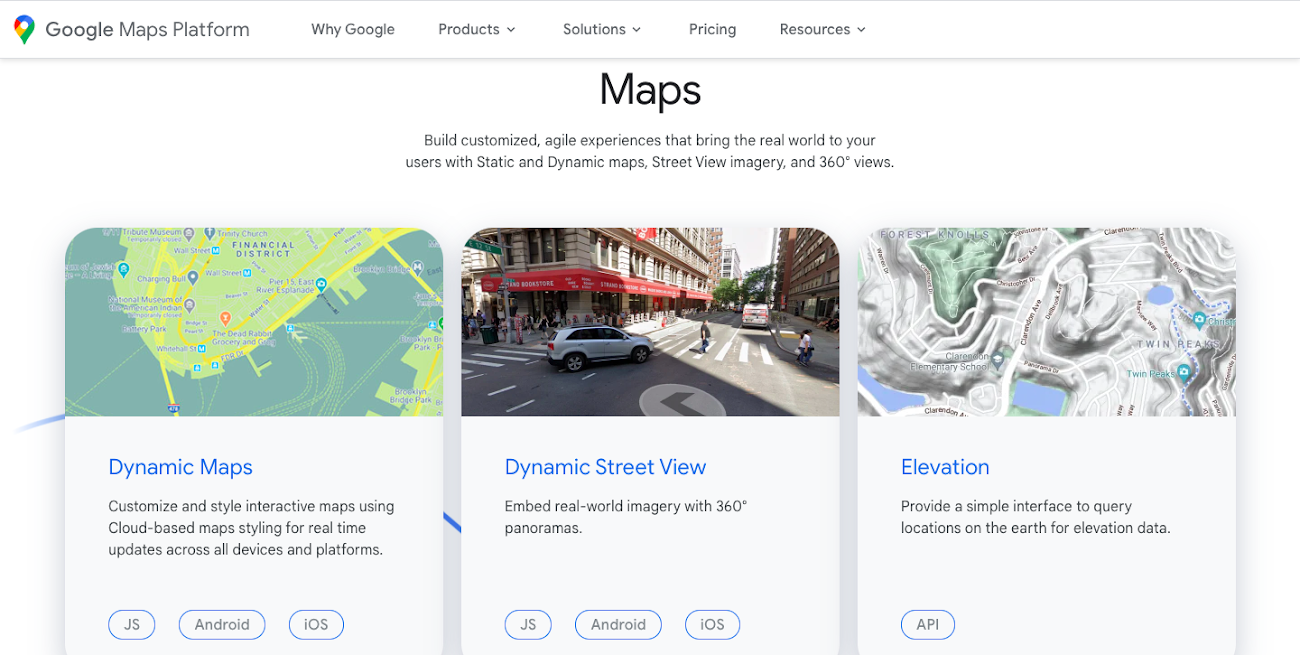
Did you know there are more than a thousand pages of developer documentation created to help you get started, unblock you when you’re stuck, and share best practices? Now when you explore a product or solution from the Google Maps Platform website, you can easily navigate back and forth between our website and documentation. Just tap on JS, iOS, Android or API under the product name to get to the documentation you need.
Budgeting for your project
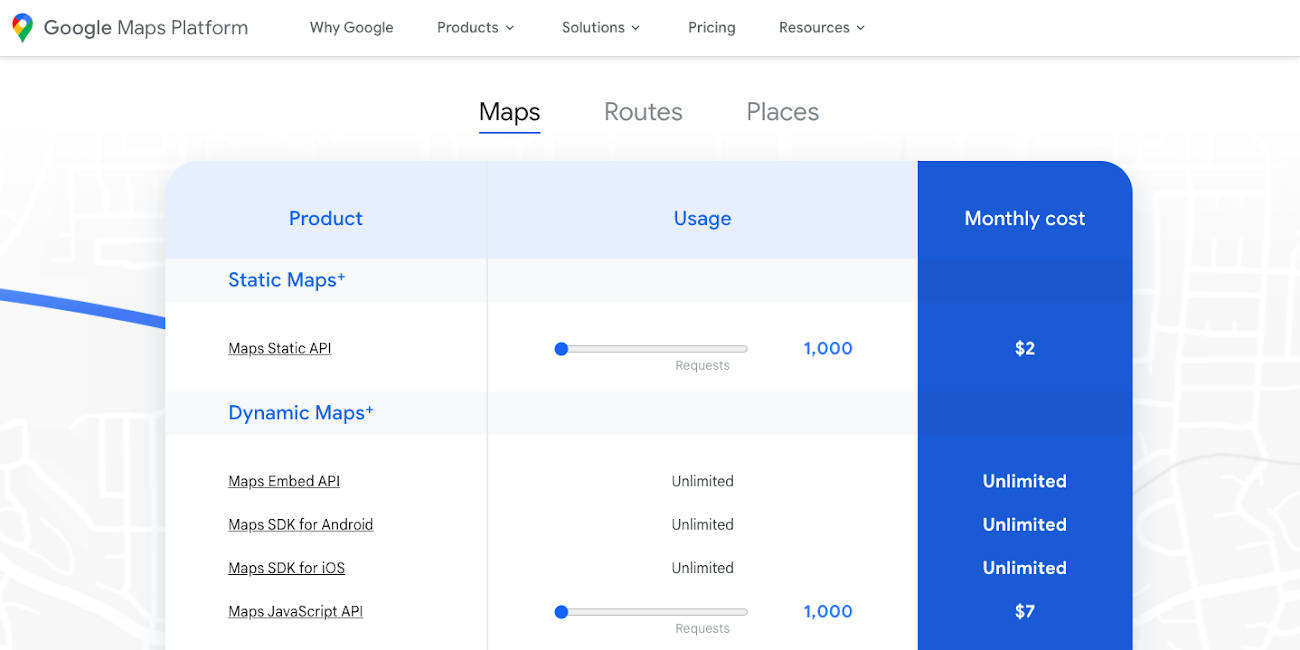
To help you calculate pricing for your project, we’ve introduced a new pricing calculator. Once you find the product and API or SDK you plan to use, pull the slider to reflect your estimated number of monthly requests. This will automatically update the “monthly cost” column for each product and API or SDK you plan to use. If your estimated monthly requests exceed the slider limit, contact our sales team to learn about volume discounts that start at 20% off.
We hope our new website makes it easier to discover our products and solutions, estimate your budget, and start building with our documentation so you can deliver helpful experiences to your users and optimize your business.
For more information on Google Maps Platform, visit https://mapsplatform.google.com.
3956
Of your peers have already watched this video.
1:30 Minutes
The most insightful time you'll spend today!
90-Sec Demos of Truly Incredible Customer Care Calls Powered By AI
How real, fast, and easy do you think an AI-powered call center experience is for customers today?
It’s likely you have seen AI-powered chatbots and are deeply unimpressed with the static nature of the interaction between customers and service representatives.
But that’s not how Google Cloud’s AI-powered contact centers are.
Here have a look yourself. Here’s what a customer from a bank or financial organisation would experience.
And here’s what a customer from a telecom company would experience.
How Constellation Brands’ Direct-to-Customer Tech Delivers Economic Impact across Business Portfolio

6268
Of your peers have already read this article.
3:00 Minutes
The most insightful time you'll spend today!
Editor’s note: Today we’re hearing from Ryan Mason, Director, Head of DTC Growth & Strategy, at alcoholic beverage firm, Constellation Brands on the company’s shift to Direct-to-Consumer (DTC) sales and how Google Cloud’s powerful technology stack helped with this transformation.
It’s no secret that consumer businesses have been up-ended in a lasting manner after 18 months of the pandemic. Consumers have been forced to shop differently over the past year – and as a result, they’ve evolved to be more comfortable with online spending and have grown to expect a certain level of convenience. While the e-commerce share of consumer sales has grown steadily over the past decade, the pandemic was the catalyst for the famous “10 years of growth in 3 months” which many argue is here to stay.
Facing this reality head-on, we placed a new emphasis on Direct-to-Consumer (DTC) with our acquisition of Empathy Wines, a DTC-native wine brand that sells directly to consumers via e-commerce. To accelerate our innovation in the DTC space, we added headcount and new functions to the existing Empathy team and empowered the newly-minted DTC group to apply their digital commerce operating model across the rest of the wine and spirits portfolio, which includes Robert Mondavi Winery, Meiomi Wines, The Prisoner Wine Company, High West Whiskey, and more.
One pandemic and one year later, DTC sales have surged in the wine and spirits category with Constellation positioned as a leader armed with a unique and powerful cloud technology stack, best-in-class e-commerce user experiences, modernized fulfillment solutions, and data-driven growth marketing.
Benefits of Going DTC
A report from McKinsey estimates that the strategic business shift to DTC has been accelerated by two years because of the pandemic and argues that consumer brands that want to thrive will need to aim for a 20% DTC business or higher, which is already taking shape in the market: Nike’s direct digital channels are on track to make up 21.5% of the total business by the end of 2021, up from 15.5% in the last fiscal year, and Adidas is aiming for 50% DTC by 2025. But outside of the clear revenue upside, the auxiliary benefits of going DTC are robust.
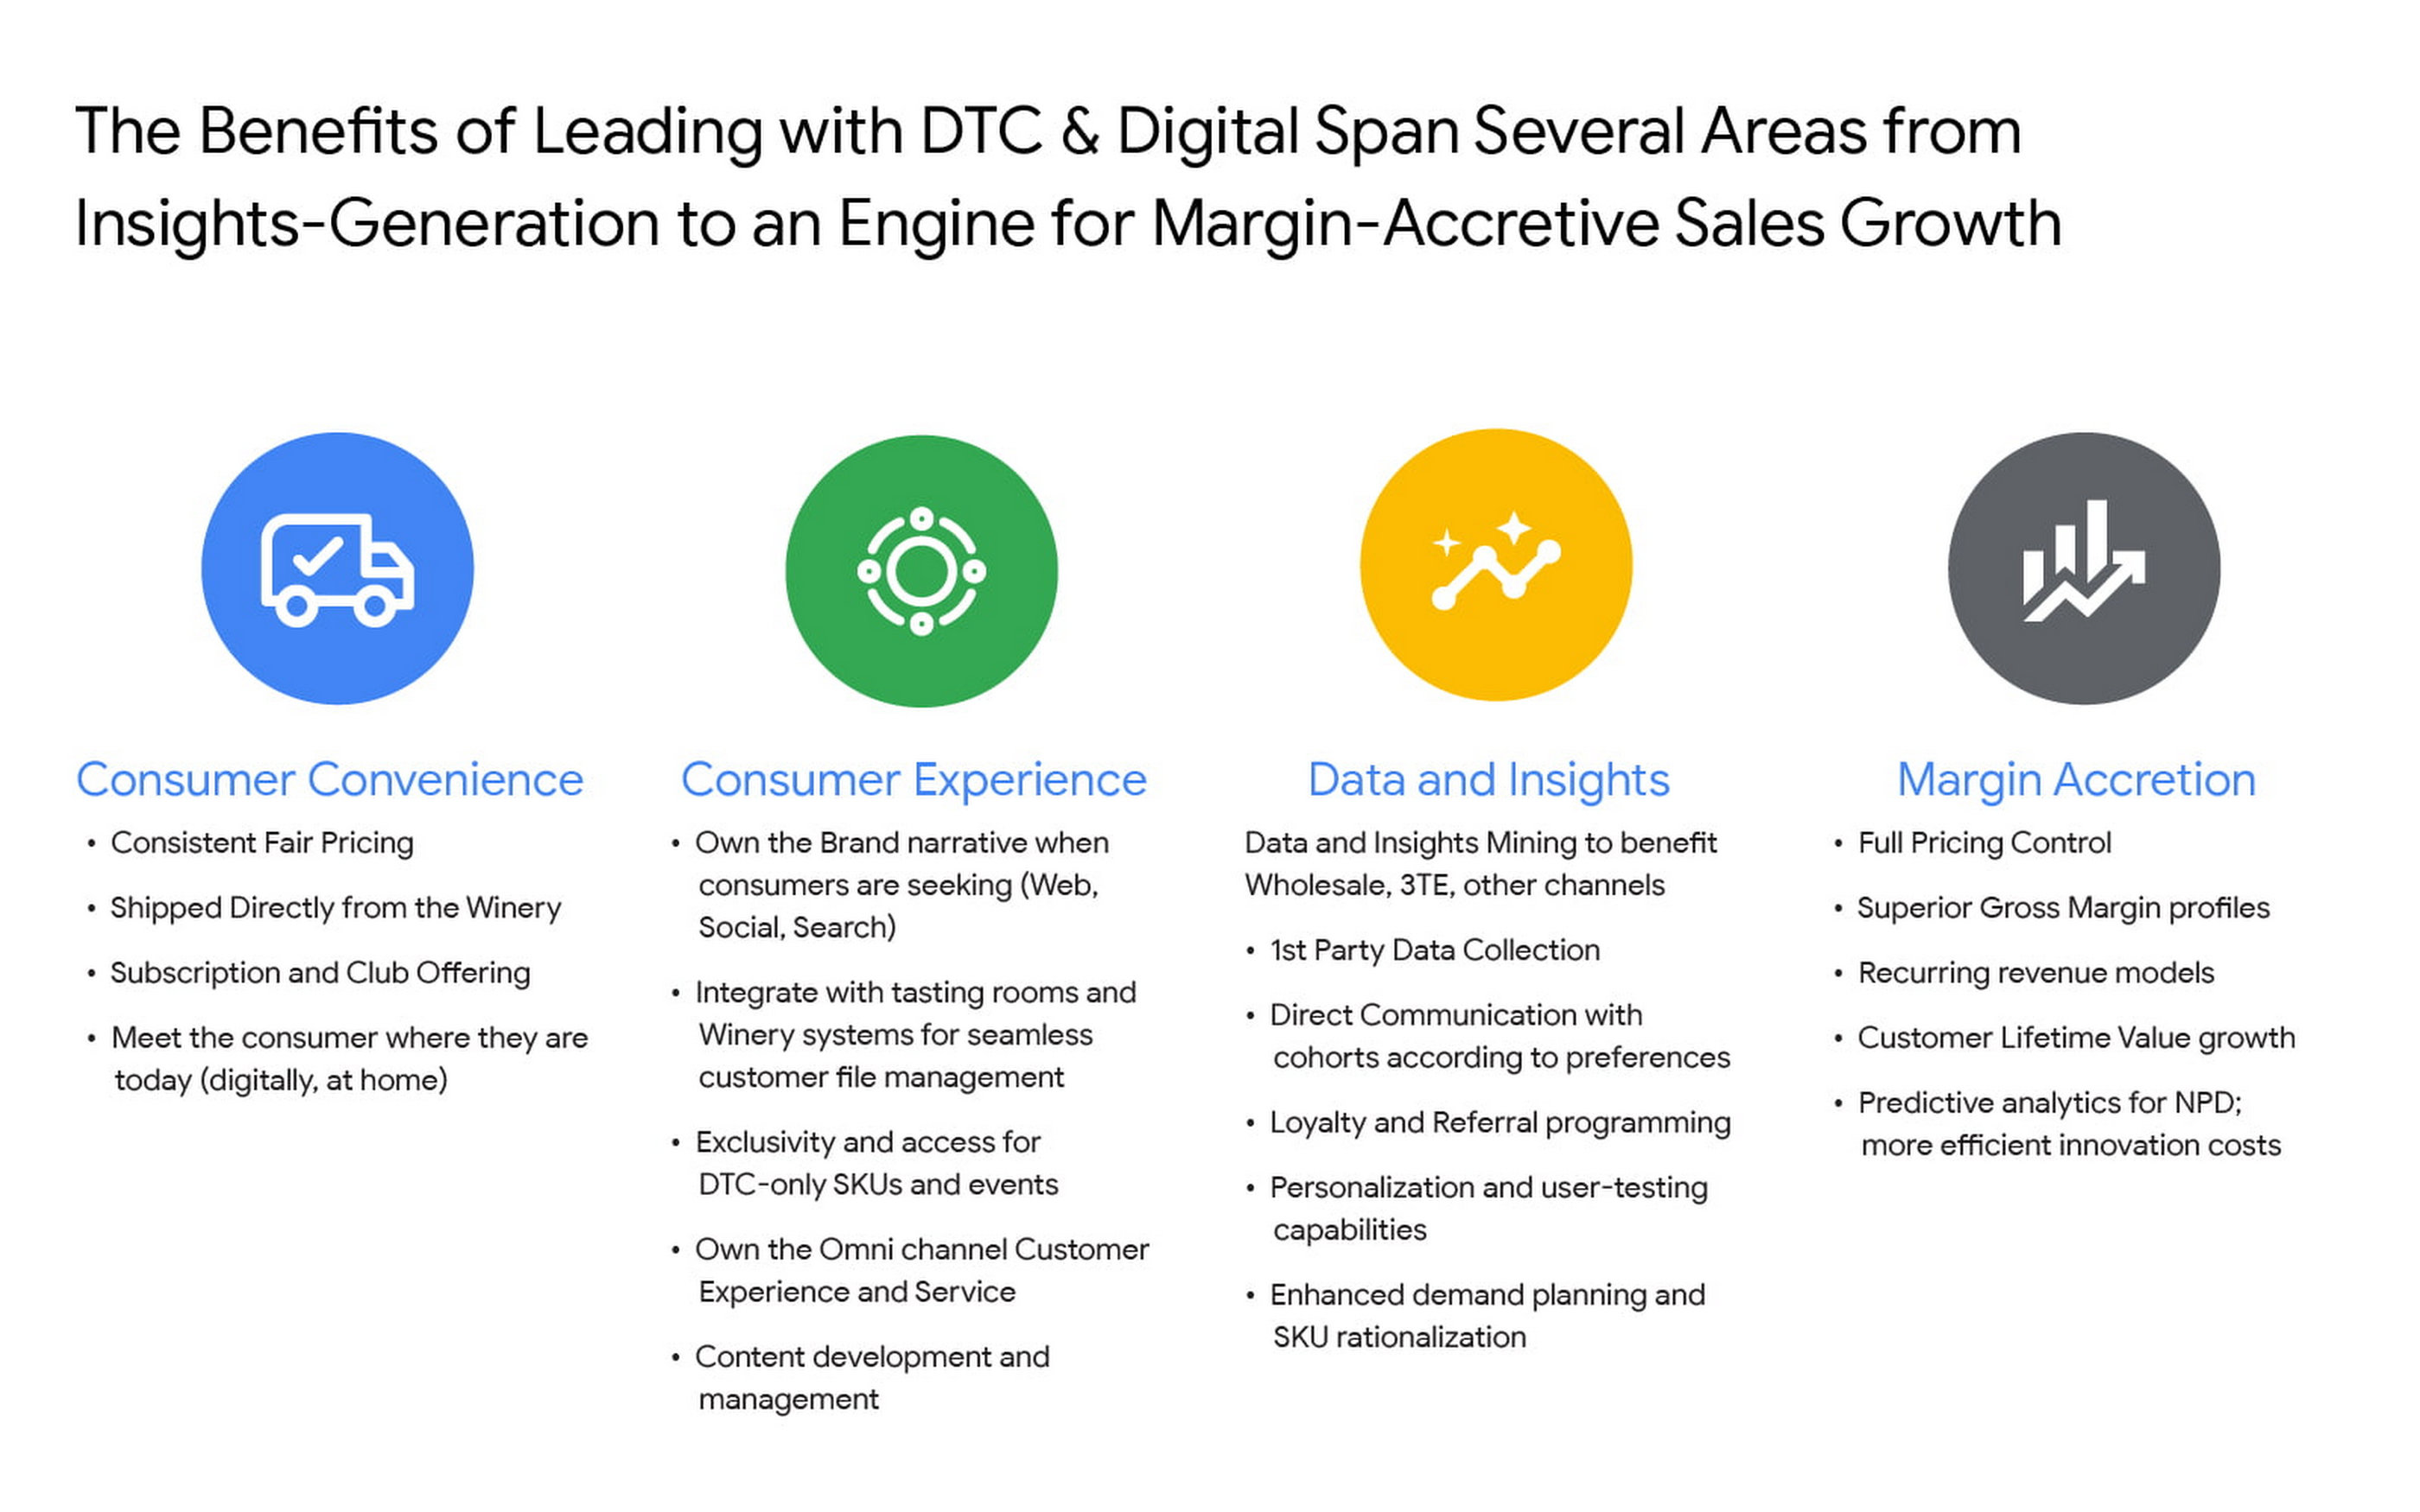
For Constellation Brands, each of these four pillars ring true, and our shift toward DTC is as much about margin accretion and revenue mix management as it is about consumer insights and data. The added complexities of the alcohol space add wrinkles to our DTC approach and manifest in many areas like consumer shopping preference, shipping and logistics hurdles, and more. In order to win share early and continue to lead the category, we recognized the need to harness the immense amount of first-party data to power impactful and actionable insights.
Our DTC technology architecture has fostered a value chain that is completely digitized: website traffic, marketing expenditures, tasting room transactions, e-commerce transactions, logistics and fulfillment events, cost of goods sold (COGS) and margin profiles, etc. are recorded and stored in a data warehouse in real time. For the first time, at any given moment, we can easily and deterministically answer complex business questions like “what is the age and gender distribution of my customers from Los Angeles who have purchased SKU X from Brand.com Y in the last 6 months? What is the cohort net promoter score? Did that increase after we introduced same-day shipping in this zip code? By how much?”
The ability to answer these questions and understand the root causes allows us to stay nimble with product offerings and iterate marketing strategies at the speed of consumer preference. Further, it enables us to optimize our omnichannel presence in the same manner by leaning on DTC consumer insights to develop valuable strategies with key wholesale distribution partners and 3-Tier eCommerce partners like Drizly and Instacart. At its core, Constellation’s DTC practice is designed to be the consumer-centric “tip-of-the-spear” responsible for generating insights from which all sales channels, including wholesale, can benefit.
Constellation’s DTC technology approach prioritizes consumer-centricity and insights generation
We have taken a modern approach to building a digital commerce technology stack, leveraging a hub-and-spoke model built around Shopify Plus and other key emergent technology providers like email provider Klaviyo, loyalty platform Yotpo, Net Promoter Score measurer Delighted, Customer Service module Gorgias, payments processor Stripe, event reservations platform Tock, and many more. For digital marketing and analytics, we use Google Cloud and Google Marketing Platform, which includes products like Analytics 360, Tag Manager 360, and Search Ads 360.
To help gather, organize, and store all of the inbound data from the ecosystem, we partnered with SoundCommerce, a data processing platform for eCommerce businesses. Together with SoundCommerce, we are able to automate data ingestion from all endpoints into a central data warehouse in Google BigQuery. With BigQuery, our data team is able to break data silos and quickly analyze large volumes of data that help unlock actionable insights about our business. BigQuery itself allows for out-of-the-box predictive analytics using SQL via BigQuery ML, and a key differentiator for us is that all Google Marketing Platform data is natively accessible for analysis within BigQuery.
But data possession only addresses half of the opportunity: we needed a powerful and modern business intelligence platform to help make sense of the vast amounts of data flowing into the system. Core to the search was to find a partner that approached BI in a way that fit with our future-looking strategy.
Our DTC team relies on the accurate measurement of variable metrics like Customer Acquisition Cost (CAC), Customer Lifetime Value (CLV), Churn, and Net Promoter Score (NPS) as a bellwether of the health of the business and monitoring these figures on a daily basis is paramount to success. To enable us to keep an accurate pulse on strategic KPIs, we considered several incumbent BI platforms. Ultimately we selected Google Cloud’s Looker for a range of benefits that separated it from the rest of the pack.

From a vision perspective, in this particular case we felt Looker was most aligned with our belief that better decisions are made when everyone has access to accurate, up-to-date information. Looker allows us to realize that vision by surfacing data in a simple web-based interface that empowers everyone to take action with real-time data on critical commercial activities. Furthermore, Looker’s ability to automate and distribute formatted modules to a myriad of stakeholders on a regular cadence increases data literacy and business performance transparency.
From a product perspective, we chose Looker for it’s cloud offering, web-based interface, and centralized, agile modeling layer that creates a trusted environment for all users to confidently interact with data — without any actual data extraction. While other BI tools have centralized semantic layers that require skilled IT resources, we’ve experienced that those can lead to bottlenecks and limited agility. With Looker’s semantic layer, LookML, our BI Team, led by Peter Donald, can easily build upon their SQL knowledge to add both a high degree of control as well as flexibility to our data model. The fully browser-based development environment allows the data team to rapidly develop, test, and deploy code and is backed by robust and seamless Git source code management.
In parallel, LookML empowers business users to collaborate without the need for advanced SQL knowledge. Our data team curates interactive data experiences with Looker to help scale access and adoption. Business users can explore ad hoc analysis, create dashboards, and develop custom data experiences in the web-based environment to get the answers they need without relying on IT resources each time they have a new question, while also maintaining the confidence that the underlying data will always be accurate. This helps us meet our primary goal of providing all businesses users with the data access they need to monitor the pulse of key metrics in near real-time.
Impact and future of DTC BI at Constellation
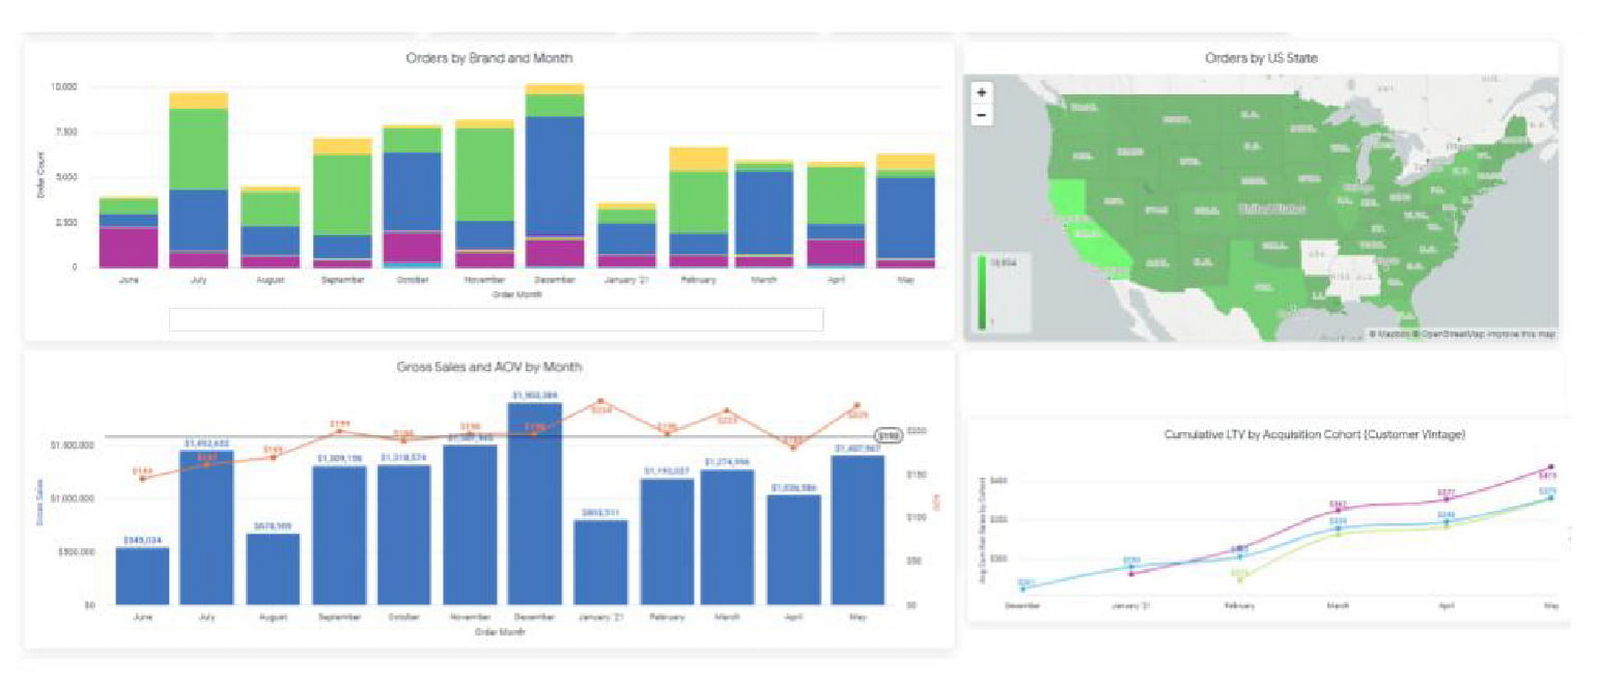
In short order, taking a modern and integrated approach to the DTC technology stack has delivered economic impact across the portfolio, helping our team understand and combat customer churn, increase conversion rates, and optimize the customer acquisition cost (CAC) and customer lifetime value (CLV) ratios. Perhaps most important is the benefit it can provide to the customer base. Mining customer data and consumer behavior generates data into what our customers are seeking, giving us insights to supply more, or less of it. For example, observing sales velocity and conversion rates by SKU or by region can help us better understand changes in customer taste profiles and fluctuations in demand, providing the foundation for a more powerful innovation pipeline and more effective sales and distribution tactics in wholesale. Our team has also been an early pilot tester for Looker’s new integration with Customer Match, which contributes to the virtuous cycle between data insight and data activation. In the future, our plan is to leverage this cycle to amplify the impact of Google Ads across Search, Shopping, and YouTube placements for the wine and spirits portfolio.
The operational impact of Looker is also substantial: our team estimates that the number of hours needed to reach critical business decisions has been reduced by nearly 60%, boosting productivity and accelerating the daily operating rhythm. A thoughtfully curated technology stack together with a modern BI solution allows us to stay at the vanguard of the industry. While the DTC sales channel is not designed to surpass the core business of wholesale for Constellation in terms of size, the approach enables unparalleled insights and measurement abilities that will pay dividends for the entire business for years to come.
Recommendations for Modelling SAP Data inside BigQuery

8400
Of your peers have already read this article.
4:00 Minutes
The most insightful time you'll spend today!
Over the past few years, many organizations have experienced the benefits of migrating their SAP solutions to Google Cloud. But this migration can do more than reduce IT maintenance costs and make data more secure. By leveraging BigQuery, SAP customers can complement their SAP investments and gain fresh insights by consolidating enterprise data and easily extending it with powerful datasets and machine learning from Google.
BigQuery is a leading cloud data warehouse, fully managed and serverless, and allows for massive scale, supporting petabyte-scale queries at super-fast speeds. It can easily combine SAP data with additional data sources, such as Google Analytics or Salesforce, and its built-in machine learning lets users operationalize machine learning models using standard SQL — all at a comparatively low cost.
If your SAP-powered organization is looking to supercharge its analytics with the strength of BigQuery, read on for considerations and recommendations for modeling with SAP data. These guidelines are based on our real-world implementation experience with customers and can serve as a roadmap to the analytics capabilities your business needs.
Considerations for data replication
Like most technology journeys, this one should start with a business objective. Keeping your intended business value and goals in mind is critical to making the right decisions in the early steps of the design process.
When it comes to replicating the data from an SAP system into BigQuery, there are multiple ways to do it successfully. Decide which method will work best for your organization by answering these questions:
- Does your business need real-time data? Will you need to time travel into past data?
- Which external datasets will you need to join with the replicated data?
- Are the source structures or business logic likely to change? Will you be migrating the SAP source systems any time soon? For instance, will you be moving from SAP ECC to SAP S/4HANA?
You’ll also need to determine whether replication should be done on a table-by-table basis or whether your team can source from pre-built logic. This decision, along with other considerations such as licensing, will influence which replication tool you should use.
Replicating on a table-by-table basis
Replicating tables, especially standard tables in their raw form, allows sources to be reused and ensures more stability of the source structure and functional output. For example, the SAP table for sales order headers (VBAK) is very unlikely to change its structure across different versions of SAP, and the logic that writes to it is also unlikely to change in a way that affects a replicated table.
Something else to consider: Reconciliation between the source system and the landing table in BigQuery is linear when comparing raw tables, which helps avoid issues in consolidation exercises during critical business processes, such as period-end closing. Since replicated tables aren’t aggregated or subject to process-specific data transformation, the same replicated columns can be reused in different BigQuery views. You can, for instance, replicate the MARA table (the material master) once and use it in as many models as needed.
Replicating pre-built logic
If you replicate pre-built models, such as those from SAP extractors or CDS views, you don’t need to build the logic in BigQuery, since you’re using existing logic. Some of these extraction objects have embedded delta mechanisms, which may complement a replication tool that can’t handle deltas. This will save initial development time, but it can also lead to challenges if you create new columns, or if customizations or upgrades change the logic behind the extraction.
It’s also important to note that different extraction processes may transform and load the same source columns multiple times, which creates redundancy in BigQuery and can lead to higher maintenance needs and costs. However, replicating pre-built models may still be a good choice, since doing so can be especially useful for logic that tends to be immutable, such as flattening a hierarchy, or logic that is highly complex.
How you approach replication will also depend on your long-term plans and other key factors — for example, the availability (and curiosity) of your developers, and the time or effort they can put into applying their SQL knowledge to a new data warehouse.
With either replication approach, bear in mind when designing your replication process that BigQuery is meant to be an append-always database — so post-processing of data and changes will be required in both cases.
Processing data changes
The replication tool you choose will also determine how data changes are captured (known as CDC – change data capture). If the replication tool allows for it (for example as SAP SLT does) the same patterns described in the CDC with BigQuery documentation also apply to SAP data.
Because some data, like transactions, are known to be less static than others (e.g., master data), you need to decide what should be scanned in real time, what will require immediate consistency, and what can be processed in batches to manage costs. This decision will be based on the reporting needs from the business.
Consider the SAP table BUT000, containing our example master data for business partners, where we have replicated changes from an SAP ERP system:
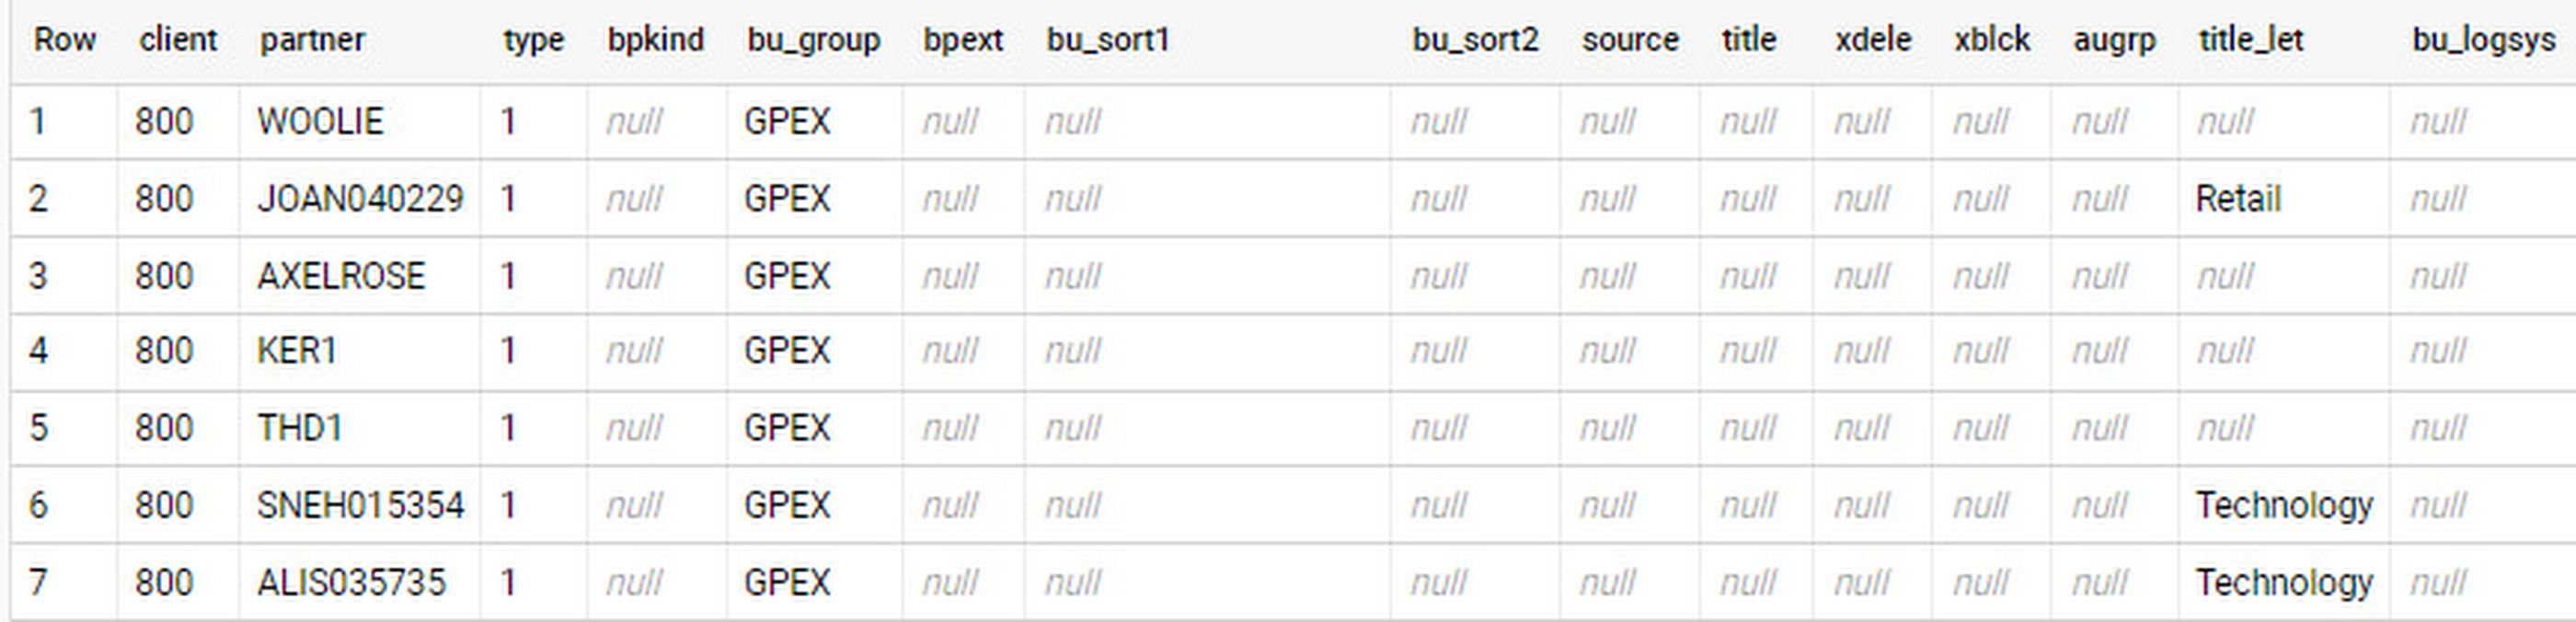
In an append-always replication in BigQuery, all updates are received as new records. For example, deleting a record in the source will be represented as a new record in BigQuery with a deletion flag. This applies to whether the records are coming from raw tables like BUT000 itself or pre-aggregated data, as from a BW extractor or a CDS view.
Let’s take a closer look at data coming particularly from the partners “LUCIA” and “RIZ”. The operation flag tells us whether the new record in BigQuery is an insert (I), update (U) or deletion (D), while the timestamps help us identify the latest version of our business partner.
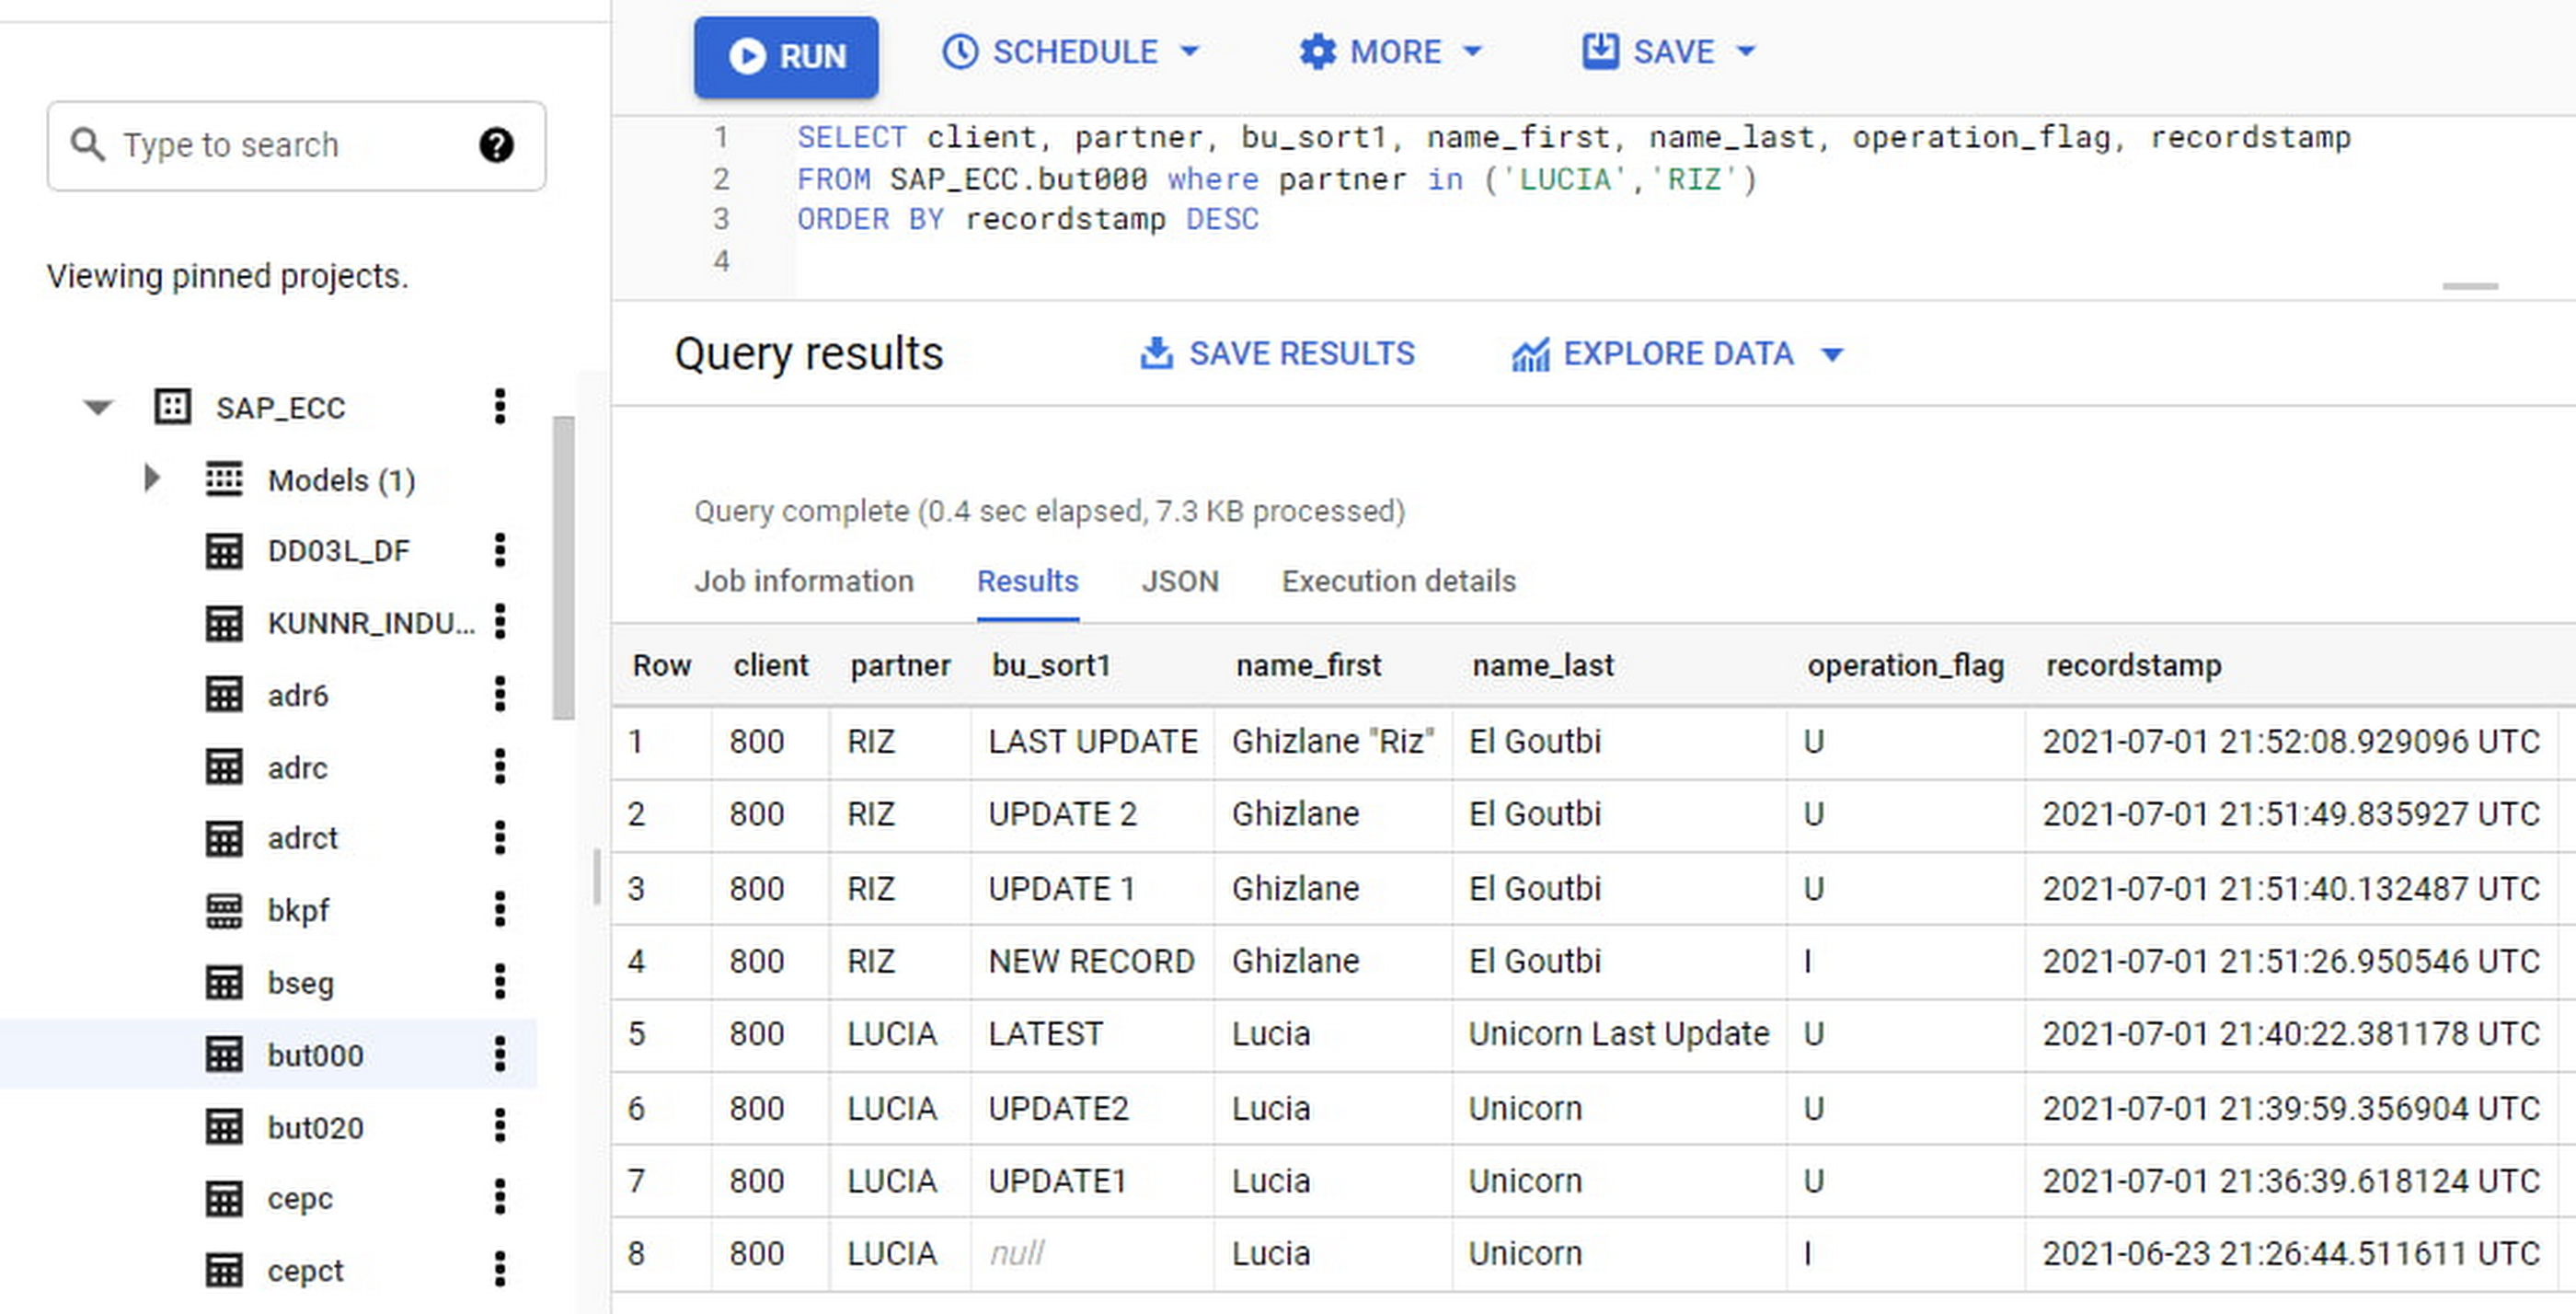
If we want to find the latest updated record for the partners LUCIA and RIZ, this is what the query would look like:
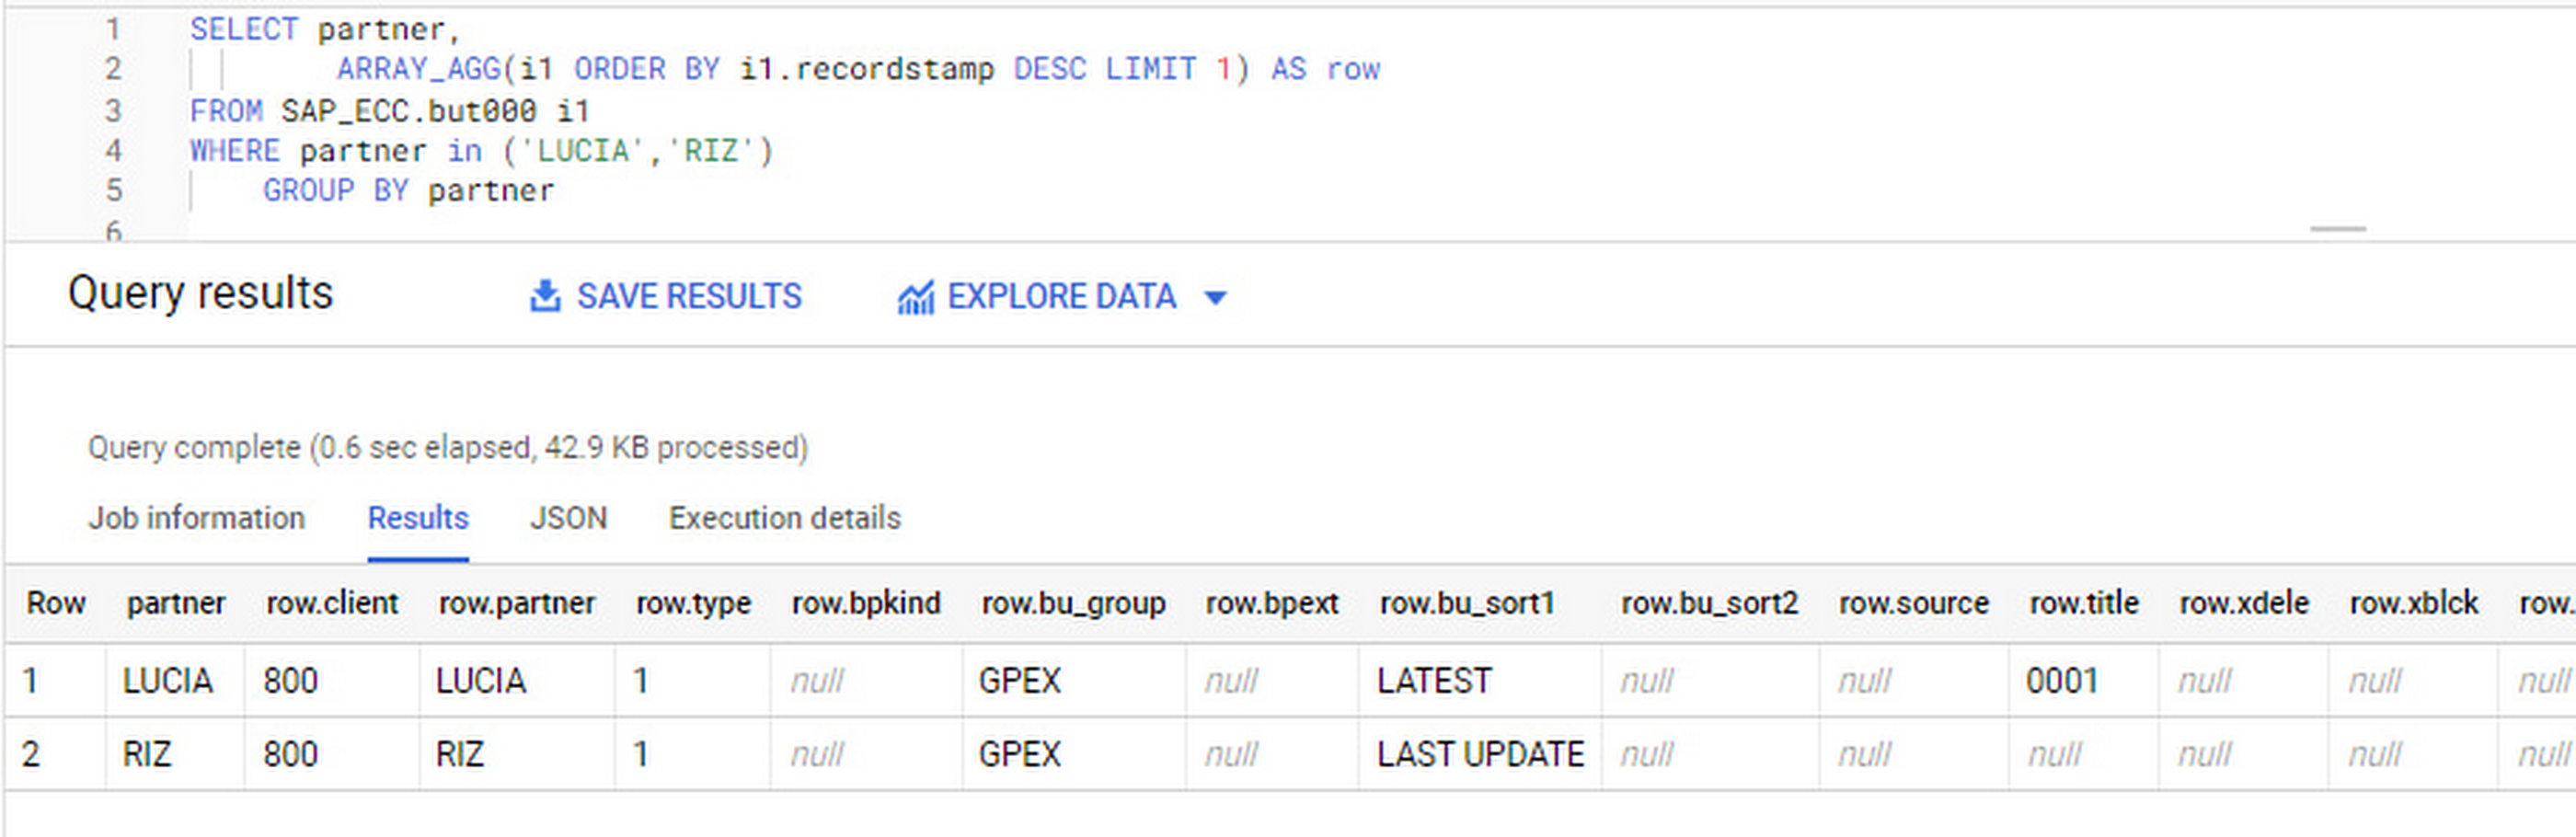
SELECT partner,ARRAY_AGG(i1 ORDER BY i1.recordstamp DESC LIMIT 1) AS rowFROM SAP_ECC.but000 i1WHERE partner in ('LUCIA','RIZ')GROUP BY partner
With the following result:
After identifying stale records for “LUCIA” and “RIZ” business partners, we can proceed to deleting all stale records for “LUCIA” if we do not want to retain the history. In this example, we are using a different table to which the same replication has been done, for the purpose of comparison and to check that all stale records have been deleted for the selection made and that we only kept last updated records. For example:
DELETE SAP_HANA.but000 i1WHEREi1.recordstamp < TIMESTAMP_SUB(CURRENT_TIMESTAMP(), INTERVAL 3 HOUR) ANDi1.recordstamp < (SELECT MAX(recordstamp) FROM SAP_HANA.but000 i2WHEREi1.partner = i2.partnerand partner="LUCIA")
You can also use the following query to retrieve stale records for “LUCIA” partner before moving forward with deletion
SELECT partner, operation_flag, recordstamp FROM SAP_HANA.but000 i1WHEREi1.recordstamp < TIMESTAMP_SUB(CURRENT_TIMESTAMP(), INTERVAL 3 HOUR)ANDi1.recordstamp < (SELECT MAX(recordstamp) FROM SAP_HANA.but000 i2WHEREi1.partner = i2.partnerand partner="LUCIA")
Which produces all of the records, except the latest update:

Partitioning and clustering
To limit the number of records scanned in a query, save on cost and achieve the best performance possible, you’ll need to take two important steps: determine partitions and create clusters.
Partitioning
A partitioned table is one that’s divided into segments, called partitions, which make it easier to manage and query your data. Dividing a large table into smaller partitions improves query performance and controls costs because it reduces the number of bytes read by a query.
You can partition BigQuery tables by:
- Time-unit column: Tables are partitioned based on a “timestamp,” “date,” or “datetime” column in the table.
- Ingestion time: Tables are partitioned based on the timestamp recorded when BigQuery ingested the data.
- Integer range: Tables are partitioned based on an integer column.
Partitions are enabled when the table is created, as in the example below. A great tip is to always include the partition filter as shown on the left-hand side of the query.

Clustering
Clustering can be created on top of partitioned tables by applying the fields that are likely to be used for filtering. When you create a clustered table in BigQuery, the table data is automatically organized based on the contents of one or more of the columns in the table’s schema. The columns you specify are then used to colocate related data.
Clustering can improve the performance of certain query types — for example, queries that use filter clauses or that aggregate data. It makes a lot of sense to use them for large tables such as ACDOCA, the table for accounting documents in SAP S/4HANA. In this case, the timestamp could be used for partitioning, and common filtering fields such as the ledger, company code, and fiscal year could be used to define the clusters.
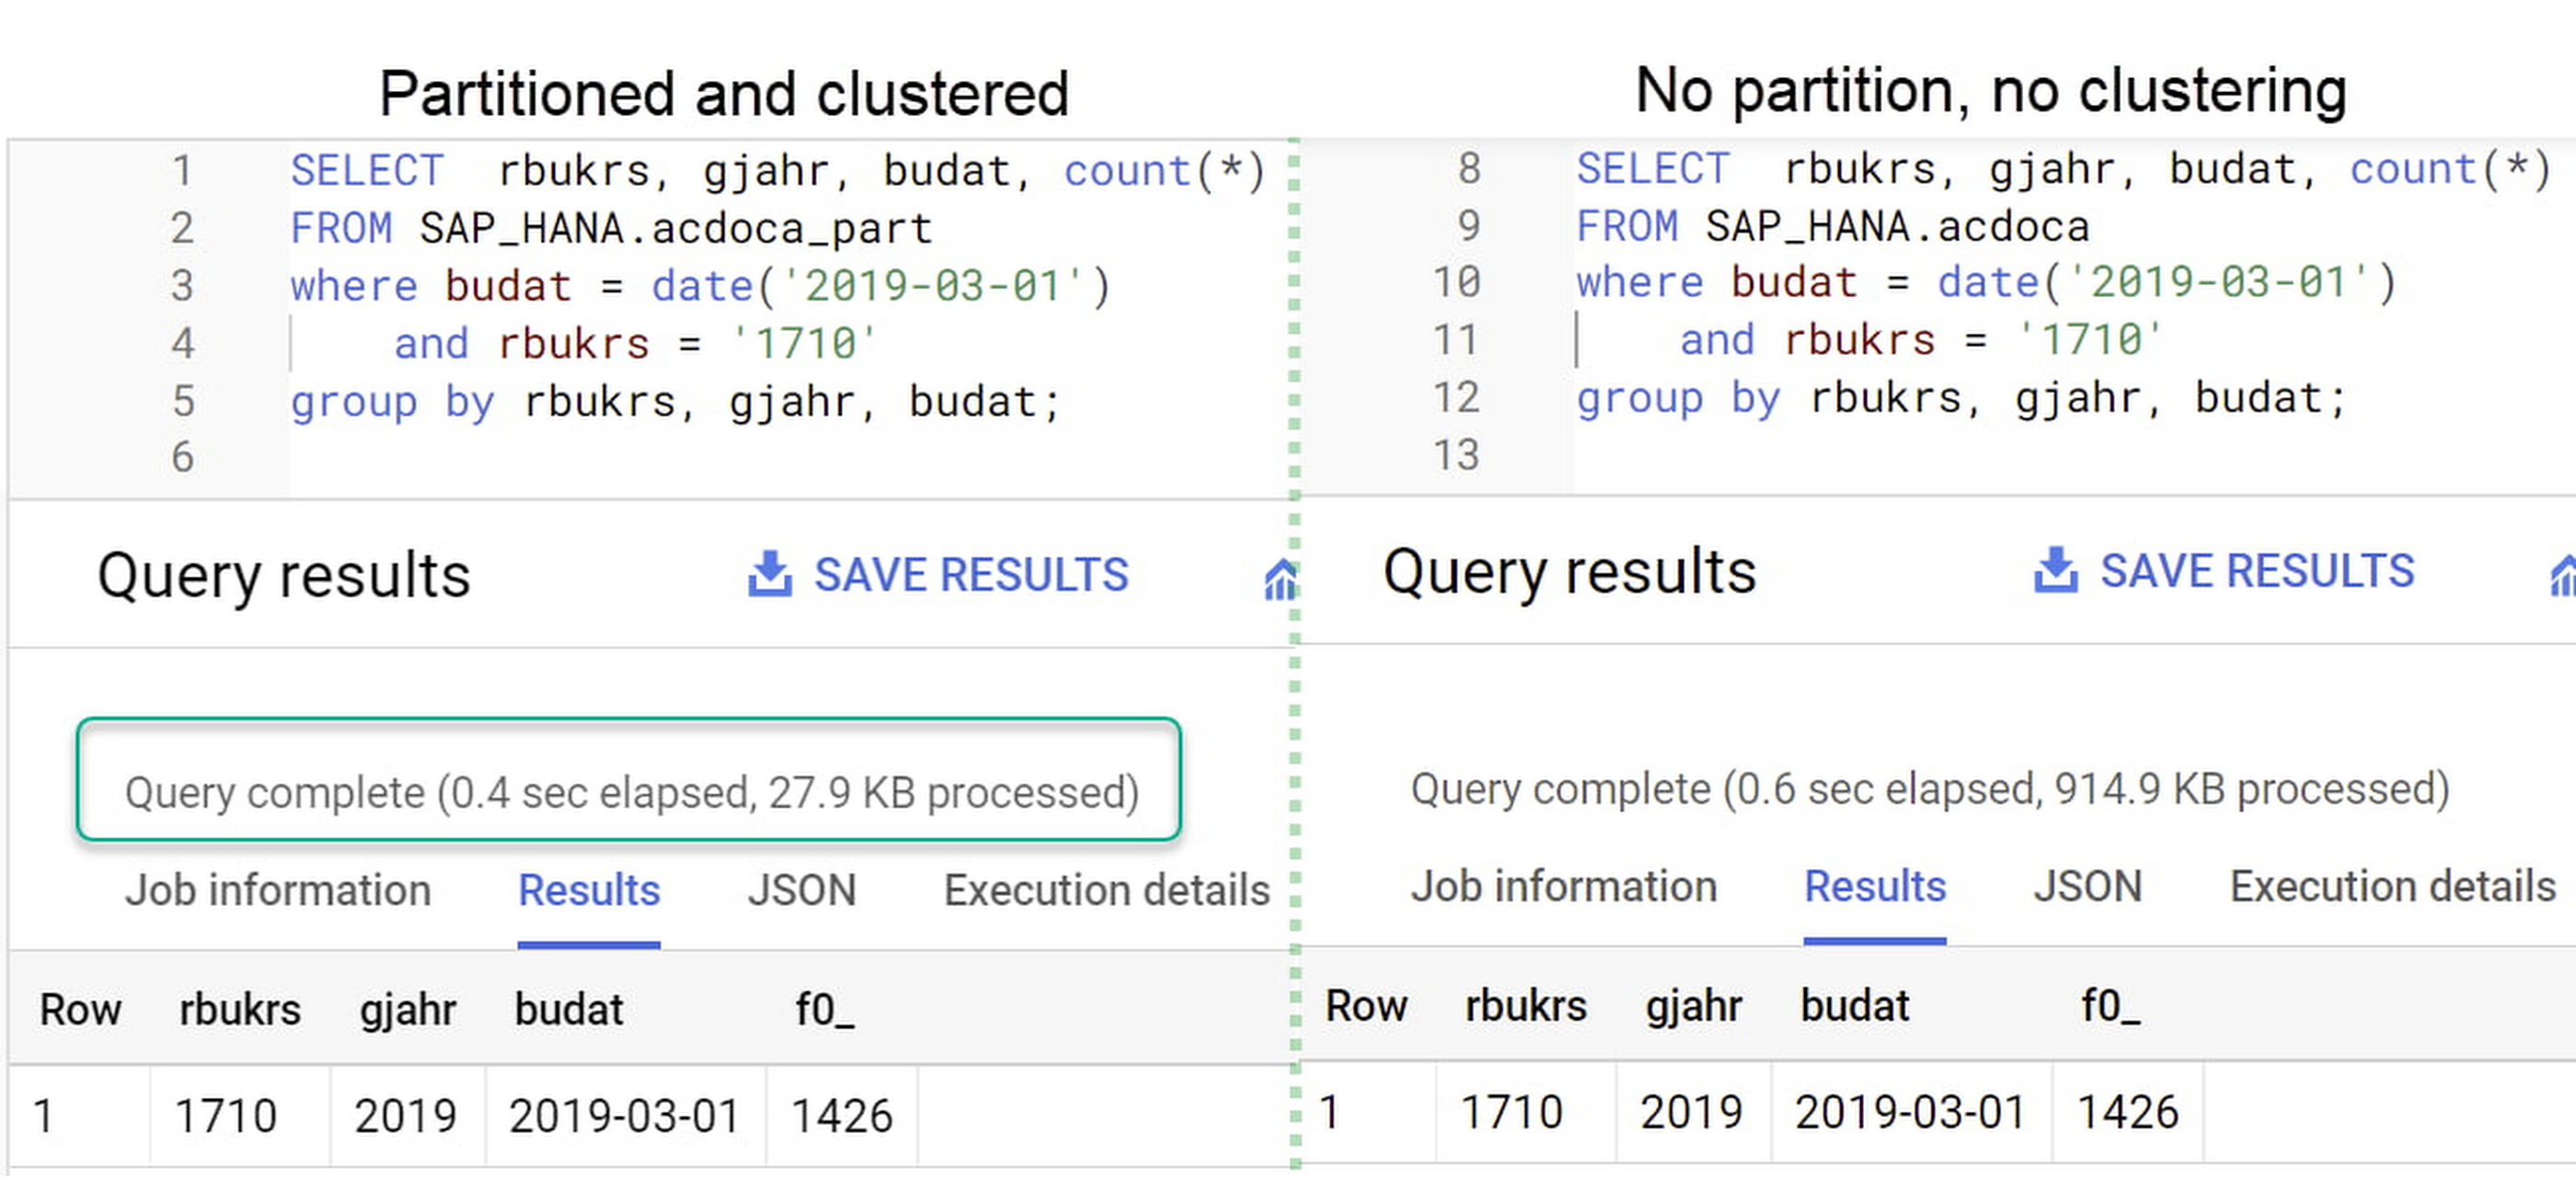
A great feature is that BigQuery will also periodically recluster the data automatically.
Materialized views
In BigQuery, materialized views are precomputed views that periodically cache the results of a query for better performance and efficiency. BigQuery uses precomputed results from materialized views and, whenever possible, reads only the delta changes from the base table to compute up-to-date results quickly. Materialized views can be queried directly or can be used by the BigQuery optimizer to process queries to the base table.
Queries that use materialized views are generally completed faster and consume fewer resources than queries that retrieve the same data only from the base table. If workload performance is an issue, materialized views can significantly improve the performance of workloads that have common and repeated queries. While materialized views currently only support single tables, they are very useful common and frequent aggregations like stock levels or order fulfillment.
Further tips on performance optimization while creating select statements can be found in the documentation for optimizing query computation.
Deployment pipeline and security
For most of the work you’ll do in BigQuery, you’ll normally have at least two delivery pipelines running — one for the actual objects in BigQuery and the other to keep the data staging, transforming, and updated as intended within the change-data-capture flows. Note that you can use most existing tools for your Continuous Integration / Continuous Deployment (CI/CD) pipeline — one of the benefits of using an open system like BigQuery. But, if your organization is new to CI/CD pipelines, this is a great opportunity to gradually gain experience. A good place to start is to read our guide for setting up a CI/CD pipeline for your data-processing workflow.
When it comes to access and security, most end-users will only have access to the final version of the BigQuery views. While row and column-level security can be applied, as in the SAP source system, separation of concerns can be taken to the next level by splitting your data across different Google Cloud projects and BigQuery datasets. While it’s easy to replicate data and structures across your datasets, it’s a good idea to define the requirements and naming conventions early in the design process so you set it up properly from the start.
Start driving faster and more insightful analytics
The best piece of advice we can give you is this: Try it yourself. Anyone with SQL knowledge can get started using the free BigQuery tier. New customers get $300 in free credits to spend on Google Cloud during the first 90 days. All customers get 10 GB storage and up to 1 TB queries/month, completely free of charge. In addition to discovering the massive processing capabilities, embedded machine learning, multiple integration tools, and cost benefits, you’ll soon discover how BigQuery can simplify your analytics tasks.
If you need additional assistance, our Google Cloud Professional Services Organization (PSO) and Customer Engineers will be happy to help show you the best path forward for your organization. For anything else, contact us at cloud.google.com/contact.
More Relevant Stories for Your Company

Google Cloud Next ’22 to Commence in October: Block Your Calendar!
We’re excited to announce that Google Cloud Next returns on October 11–13, 2022. Join us for keynotes from industry luminaries and engage live with Google developers. Explore dynamic content across various learning levels, and dive deep into technologies and solutions spanning the Google Cloud and Google Workspace portfolios. Participate in breakout sessions,

Vodafone Leverages Google Cloud to Aid COVID-19 Frontline with Anonymized Insights on Population Mobility
Editor’s note: When Europe’s largest mobile communications company, Vodafone, was asked by the European Commission to help understand population movement across the European Union and the UK to help fight COVID-19, it was able to provide anonymized mobile network-based insights to answer the call. Here’s how Vodafone, with the support
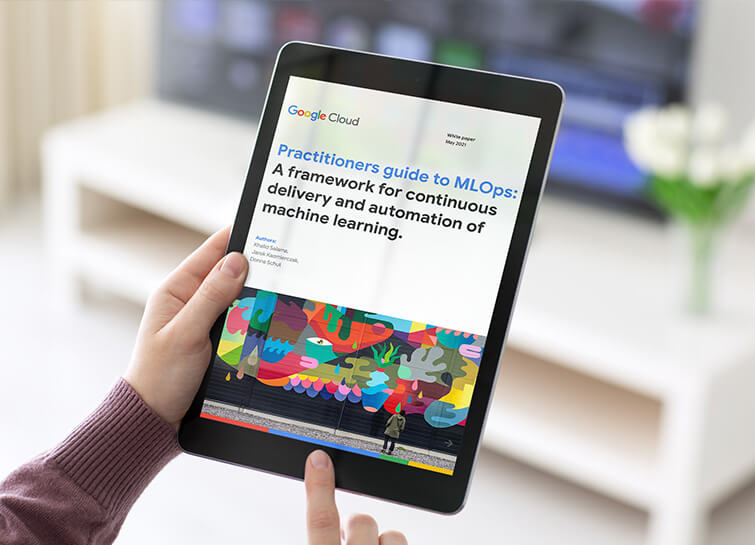
Data Science Teams: A Practitioners Guide to MLOps
Across industries, DevOps and DataOps have been widely adopted as methodologies to improve quality and reduce the time to market of software engineering and data engineering initiatives. With the rapid growth in machine learning (ML) systems, similar approaches need to be developed in the context of ML engineering, which handle



Driving Business Transformation in Financial Services Using Google Cloud and AI/ML
These are challenging times with financial services institutions navigating the pandemic. Interest rates are an all-time low, and customer expectations are changing with the shift to digital. For example, digital banking has increased from 63 in 2019 to 72 percent today. Then regulatory requirements are evolving and compliance costs are
