





Speak Now to Book a Flight: easyJet’s Uses AI to Improve Customer Experience

3478
Of your peers have already read this article.
4:30 Minutes
The most insightful time you'll spend today!
With a growing fleet of 325 aircraft that cover more than 1,000 routes across 158 airports, easyJet is one of Europe’s most popular airlines. And easyJet serves an average of 90 million passengers each year, so a helpful mobile experience for its customers is a top priority.
Travellers today are inherently mobile-first, so finding new ways to make it easier for them to search and book flights is key. To do exactly that, easyJet partnered with technology company Travelport to develop Speak Now, a new feature on easyJet’s mobile app that interprets voice searches to deliver accurate and relevant flight information to travelers.
See how it works:
Powered by Dialogflow, Google Cloud’s natural language understanding tool for building conversational experiences, Speak Now lets customers ask questions to determine exactly what they’re looking for—from destinations, to dates and times, to airports they want to fly from.
Dialogflow, a core component of Google Cloud Contact Center AI, makes it easy to build accurate, flexible conversation interfaces that allow users to ask questions and accomplish tasks in everyday language.
How do we create conversational experiences across devices and platforms for enterprises?
It’s clear that the rise in voice search is changing the way we go about our daily lives. Twenty-seven percent of the global online population already uses voice search on mobile, and the rapid adoption of this technology is reshaping entire industries. It’s no surprise that easyJet looked to adopt this technology to positively transform experiences for their customers.
Dialogflow, a core component of Google Cloud Contact Center AI, makes it easy to build accurate, flexible conversation interfaces that allow users to ask questions and accomplish tasks in everyday language. It understands the nuances of human language and translates end-user text or audio during a conversation to structured data that apps and services can understand.
Speak Now is a great example of how we’re using cloud technologies and AI to make the experience of buying and managing travel continually better for everyone.
Daniel Young, Head of Digital Experience, easyJet
Daniel Young, Head of Digital Experience at easyJet commented: “We picked Dialogflow due to its strengths and ease with which a powerful conversational agent can be built. Speak Now is a great example of how we’re using cloud technologies and AI to make the experience of buying and managing travel continually better for everyone. This is the latest in a series of innovative features that will make booking travel as easy as it can possibly be, giving easyJet customers a helpful digital experience.”
Consumers already rely on voice assistants to play their favorite music, add items to a shopping list, and order taxis, Speak Now is a great example of how voice assistants can now make the customer experience better and more intuitive for travel.
904
Of your peers have already watched this video.
9:30 Minutes
The most insightful time you'll spend today!
Building Ethical AI: Why Organizations Need to Define Their Own Principles
In this video, learn about the importance of responsible AI, and how Google implements responsible AI in their products. You will also get an introduction to Google’s 7 AI principles.
Want to learn more about the importance of responsible AI? Enroll on Google Cloud Skills Boost → https://goo.gle/3CGhlXo
View the Generative AI Learning path playlist → https://goo.gle/LearnGenAI
Subscribe to Google Cloud Tech → https://goo.gle/GoogleCloudTech
AI Solutions for Government Organizations: How to Get Started

4390
Of your peers have already read this article.
3:00 Minutes
The most insightful time you'll spend today!
Cloud-native features are helping public sector teams innovate faster than ever. Ideas discussed in a morning meeting can be a working proof of concept later that day. Managed services can remove administrative burden and reduce the steps needed to design and provision cloud infrastructure. Security can be built-in from the beginning with Identity and Access Management (IAM), Virtual Private Cloud Service Controls (VPC-SC), and Data Loss Prevention (DLP). Short-lived services and infrastructure-as-code allow rapid and cost-effective prototyping. These technologies can be used to architect a solution that follows the principle of least privilege and helps you secure your data.
So the question becomes: given the complex problems agencies face, where do you start? Google Public Sector now offers “Getting Started” and “Scaling” service offerings for CCAI, DocAI, and BigQuery to help you jumpstart your AI journey, based on where you are.
Complex problems, simpler AI-based solutions
Solving more challenging problems with cloud-native technology doesn’t have to be overwhelming. You can approach them the same way you might solve a puzzle: start with one piece that follows another until the larger picture takes shape. Though you can simplify the steps, solving these problems still requires powerful tools. Google Cloud’s AI/ML capabilities may be the answer for your team.
Google Public Sector is making it easier to get started with advanced technologies, beginning with artificial intelligence and machine learning (AI/ML) workloads for government organizations, and it’s something you can do now, one piece at a time.
Automating your FAQs with CCAI
Does your agency require a team to answer commonly asked questions? What if you could train an agent to answer questions immediately and operate 24/7? Contact Center AI (CCAI) can do this and more. Already using CCAI and need the agent to level up to address complex interactive dialogs? Getting Started with CCAI and Scaling with CCAI are new Google service offerings specifically designed to help public sector organizations tackle situations like these.
Automate data entry with DocAI
How many hours does your team spend manually reviewing or entering data from standardized forms? What if you could automatically pull data right from the page? Google Document AI (DocAI) specializes in exactly this—even if the form has handwritten text. Getting Started with DocAI and Scaling with DocAI are new service offerings that help you remove this burden from your team. DocAI automates data entry and makes that data available to other teams while prioritizing both security and ease of use.
Making data and insights accessible with BigQuery
Then there’s all your existing data. You may have years of it stored in many places, and you may not have a way to make use of it when you need it. BigQuery is Google’s enterprise data warehouse. It was designed for data analytics—looking back at historical data to make conclusions about it. But BigQuery’s analytics don’t stop there. It can also look forward in time to make predictions, often using the same datasets. Getting Started with BigQuery and Scaling with BigQuery are new service offerings that help you take your first steps toward AI/ML capabilities by starting with a single table or pipeline that can help make sense of all your data.
The best help is the kind that meets you where you are and gets you where you want to be. Google Public Sector’s new service offerings do just that: help you work through complex problems by meeting you wherever your starting line is, whether you’re ready to start or ready to scale. Let us know if you would like us to contact you about the services mentioned in this article. Let’s solve your highest impact problems together, one puzzle piece at a time.
Leverage ML to Spot Anomalies in Real-time Forex Data

3107
Of your peers have already read this article.
6:00 Minutes
The most insightful time you'll spend today!
Let’s say you are a quantitative trader with access to real-time foreign exchange (forex) price data from your favorite market data provider. Perhaps you have a data partner subscription, or you’re using a synthetic data generator to prove value first. You know there must be thousands of other quants out there with your same goal. How will you differentiate your anomaly detector?
What if, instead of training an anomaly detector on raw forex price data, you detected anomalies in an indicator that already provides generally agreed buy and sell signals? Relative Strength Index (RSI) is one such indicator; it is often said that RSI going above 70 is a sell signal, and RSI going below 30 is a buy signal. As this is just a simplified rule, it means there could be times when the signal is inaccurate, such as a currency market correction, making it a prime opportunity for an anomaly detector.
This gives us the following high level components:

Of course, we want each of these components to handle data in real time, and scale elastically as needed. Dataflow pipelines and Pub/Sub are the perfect services for this. All we need to do is write our components on top of the Apache Beam sdk, and they’ll have the benefit of distributed, resilient and scalable compute.
Luckily for us, there are some great existing Google plugins for Apache Beam. Namely, a Dataflow time-series sample library that includes RSI calculations, and a lot of other useful time series metrics; and a connector for using AI Platform or Vertex AI inference within a Dataflow pipeline. Let’s update our diagram to match, where the solid arrows represent Pub/Sub topics.
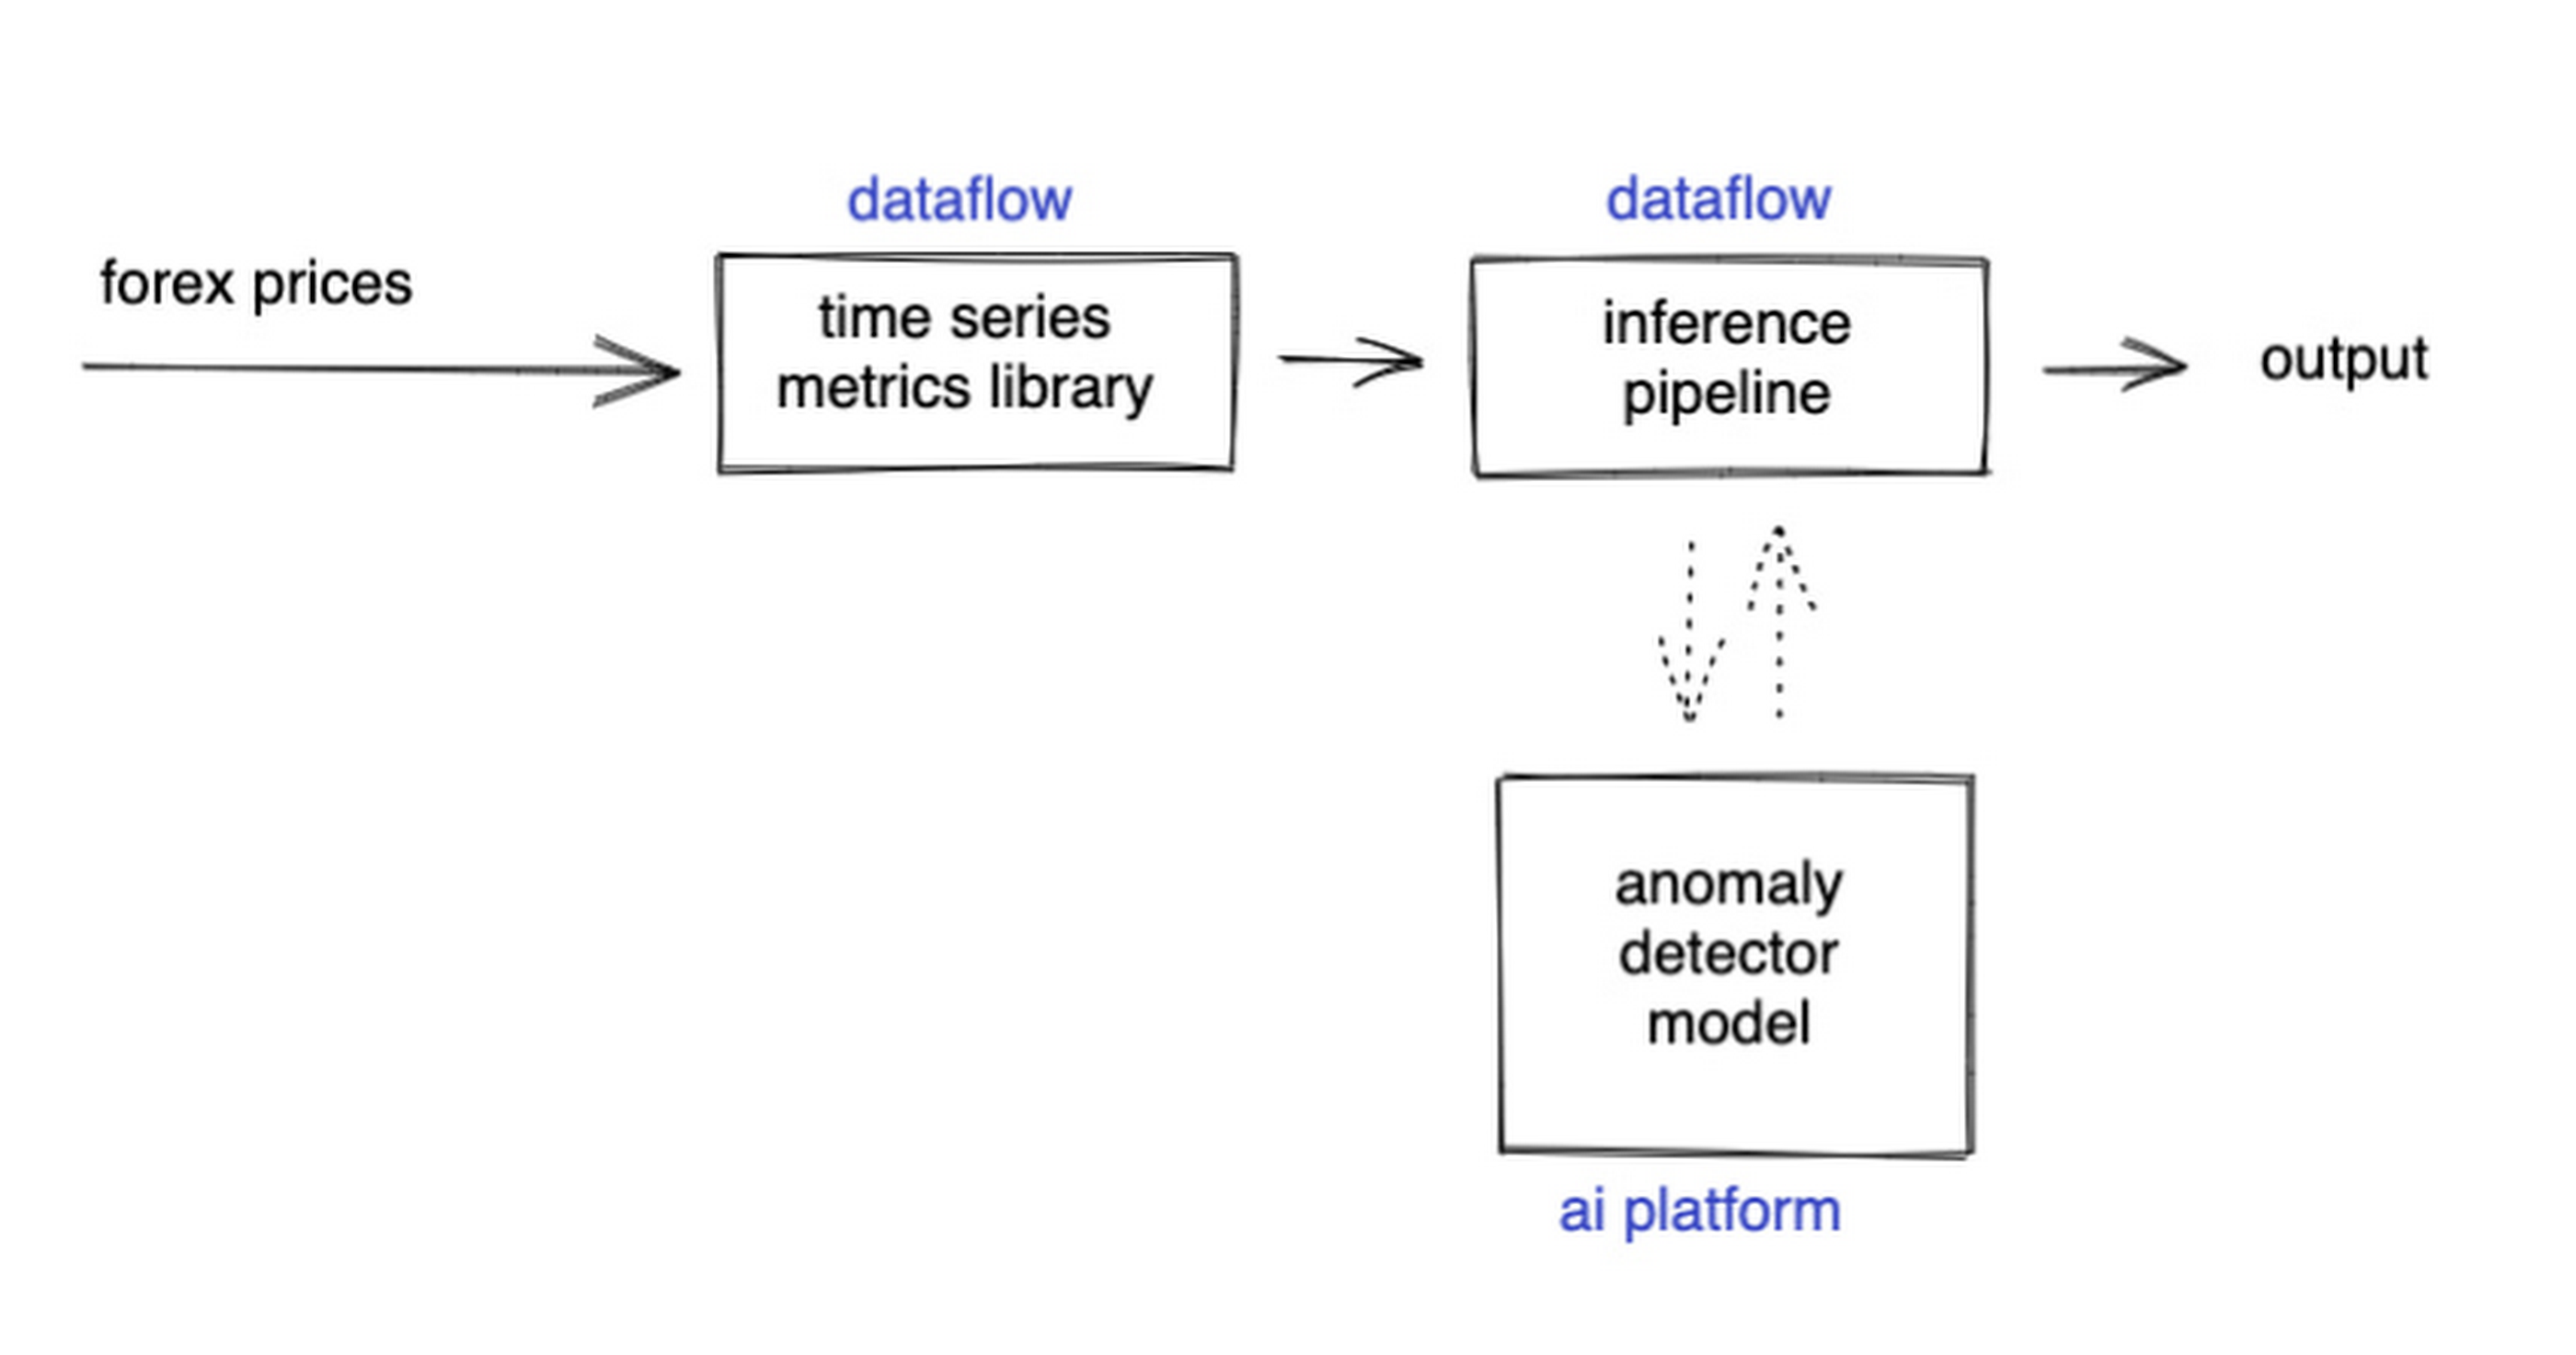
The Dataflow time-series sample library also provides us with gap-filling capabilities, which means we can rely on having contiguous data once the flow reaches our machine learning (ML) model. This lets us implement quite complex ML models, and means we have one less edge case to worry about.
So far we’ve only talked about the real time data flow, but for visualization and continuous retraining of our ML model, we’re going to want historical data as well. Let’s use BigQuery as our data warehouse, and Dataflow to plumb Pub/Sub into it. As this plumbing job is embarrassingly parallelizable, we wrote our pipeline to be generic across data types and share the same Dataflow job, such that compute resources can be shared. This results in efficiencies of scale both in cost savings and time required to scale-up.

Data Modeling
Let’s discuss data formats a bit further here. An important aspect of running any data engineering project at scale is flexibility, interoperability and ease of debugging. As such, we opted to use flat JSON structures for each of our data types, because they are human readable and ubiquitously understood by tooling. As BigQuery understands them too, it’s easy to jump into the BigQuery console and confirm each component of the project is working as expected.
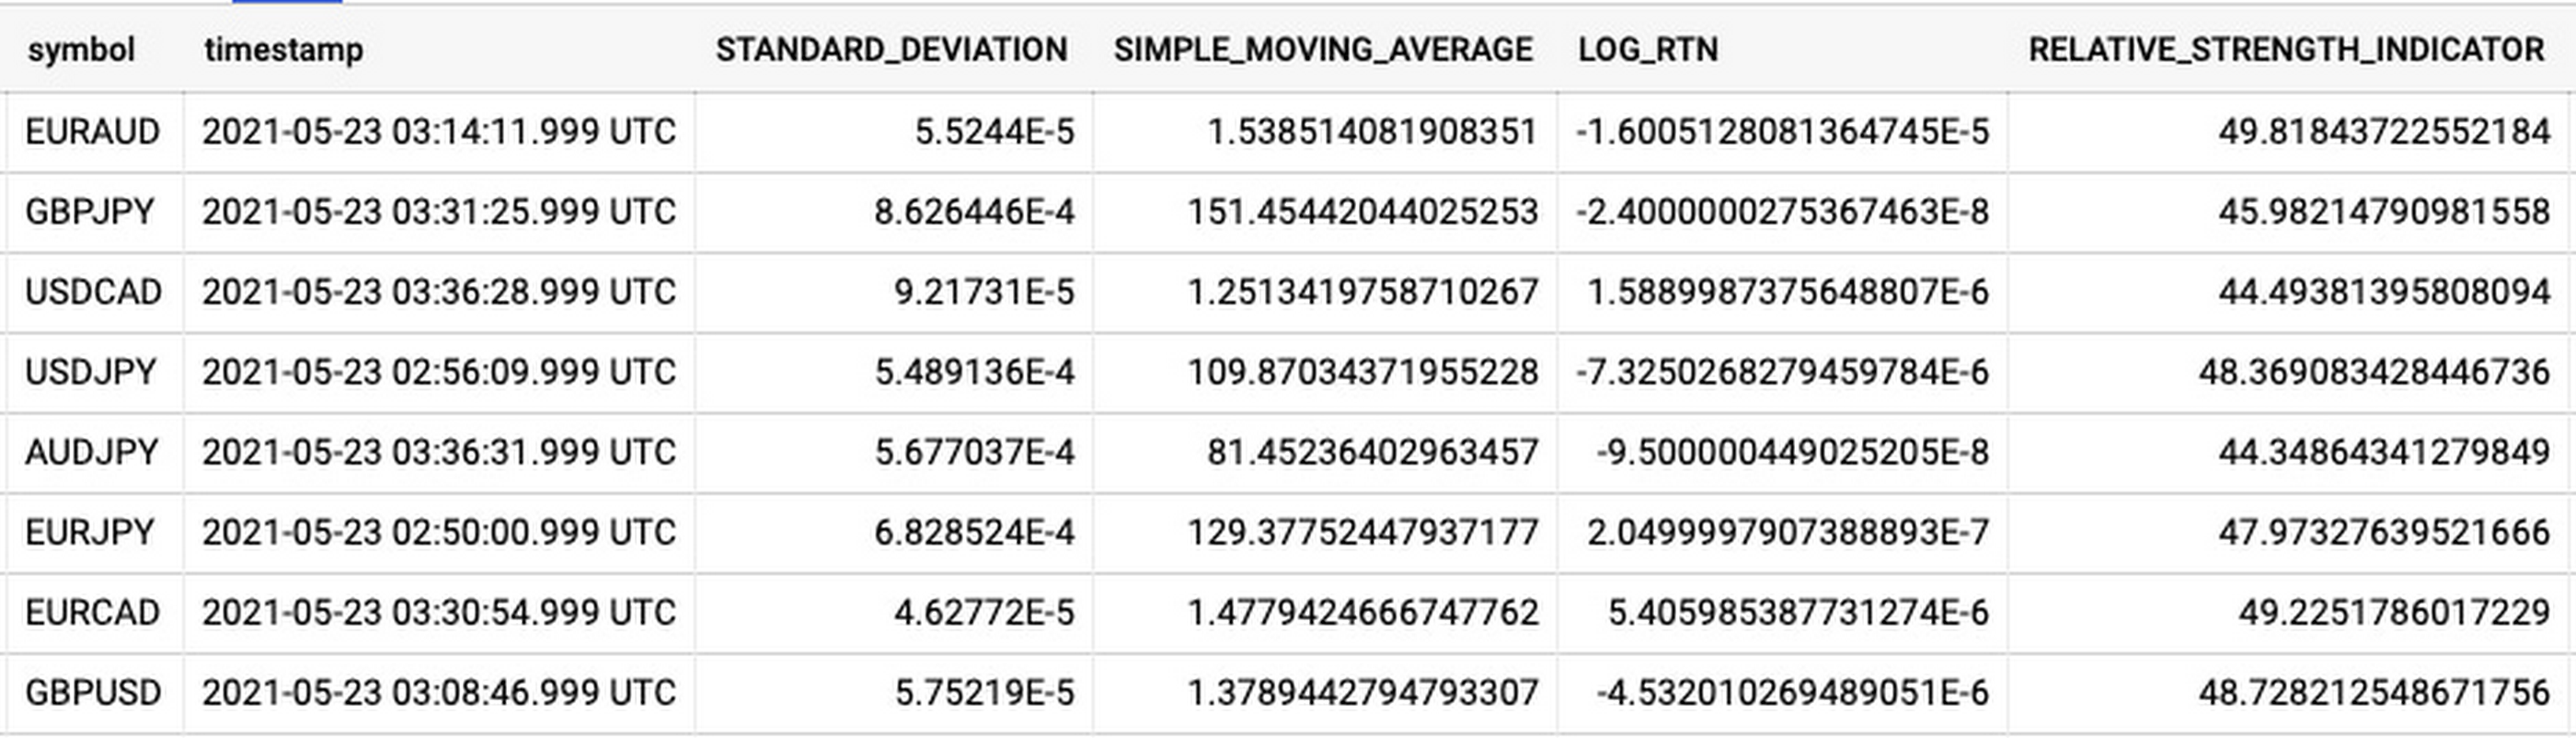
As you can see, the Dataflow sample library is able to generate many more metrics than RSI. It supports generating two types of metrics across time series windows, metrics which can be calculated on unordered windows, and metrics which require ordered windows, which the library refers to as Type 1 metrics and Type 2 metrics, respectively. Unordered metrics have a many-to-one relationship, which can help reduce the size of your data by reducing the frequency of points through time. Ordered metrics run on the outputs of the unordered metrics, and help to spread information through the time domain without loss in resolution. Be sure to check out the Dataflow sample library documentation for a comprehensive list of metrics supported out of the box.
As our output is going to be interpreted by our human quant, let’s use the unordered metrics to reduce the time resolution of our flow of real time data to one per second, or one hertz. If our output was being passed into an automated trading algorithm, we might choose a higher frequency. The decision for the size of our ordered metrics window is a little more difficult, but broadly determines the amount of time-steps our ML model will have for context, and therefore the window of time for which our anomaly detection will be relevant. We at least need it to be larger than our end-to-end latency, to ensure our quant will have time to act. Let’s set it to five minutes.
Data Visualization
Before we dive into our ML model, let’s work on visualization to give us a more intuitive feel for what’s happening with the metrics, and confirm everything we’ve got so far is working. We use the Grafana helm chart with the BigQuery plugin on a Google Kubernetes Engine (GKE) Autopilot cluster. The visualisation setup is entirely config-driven and provides out-of-the-box scaling, and GKE gives us a place to host some other components later on.
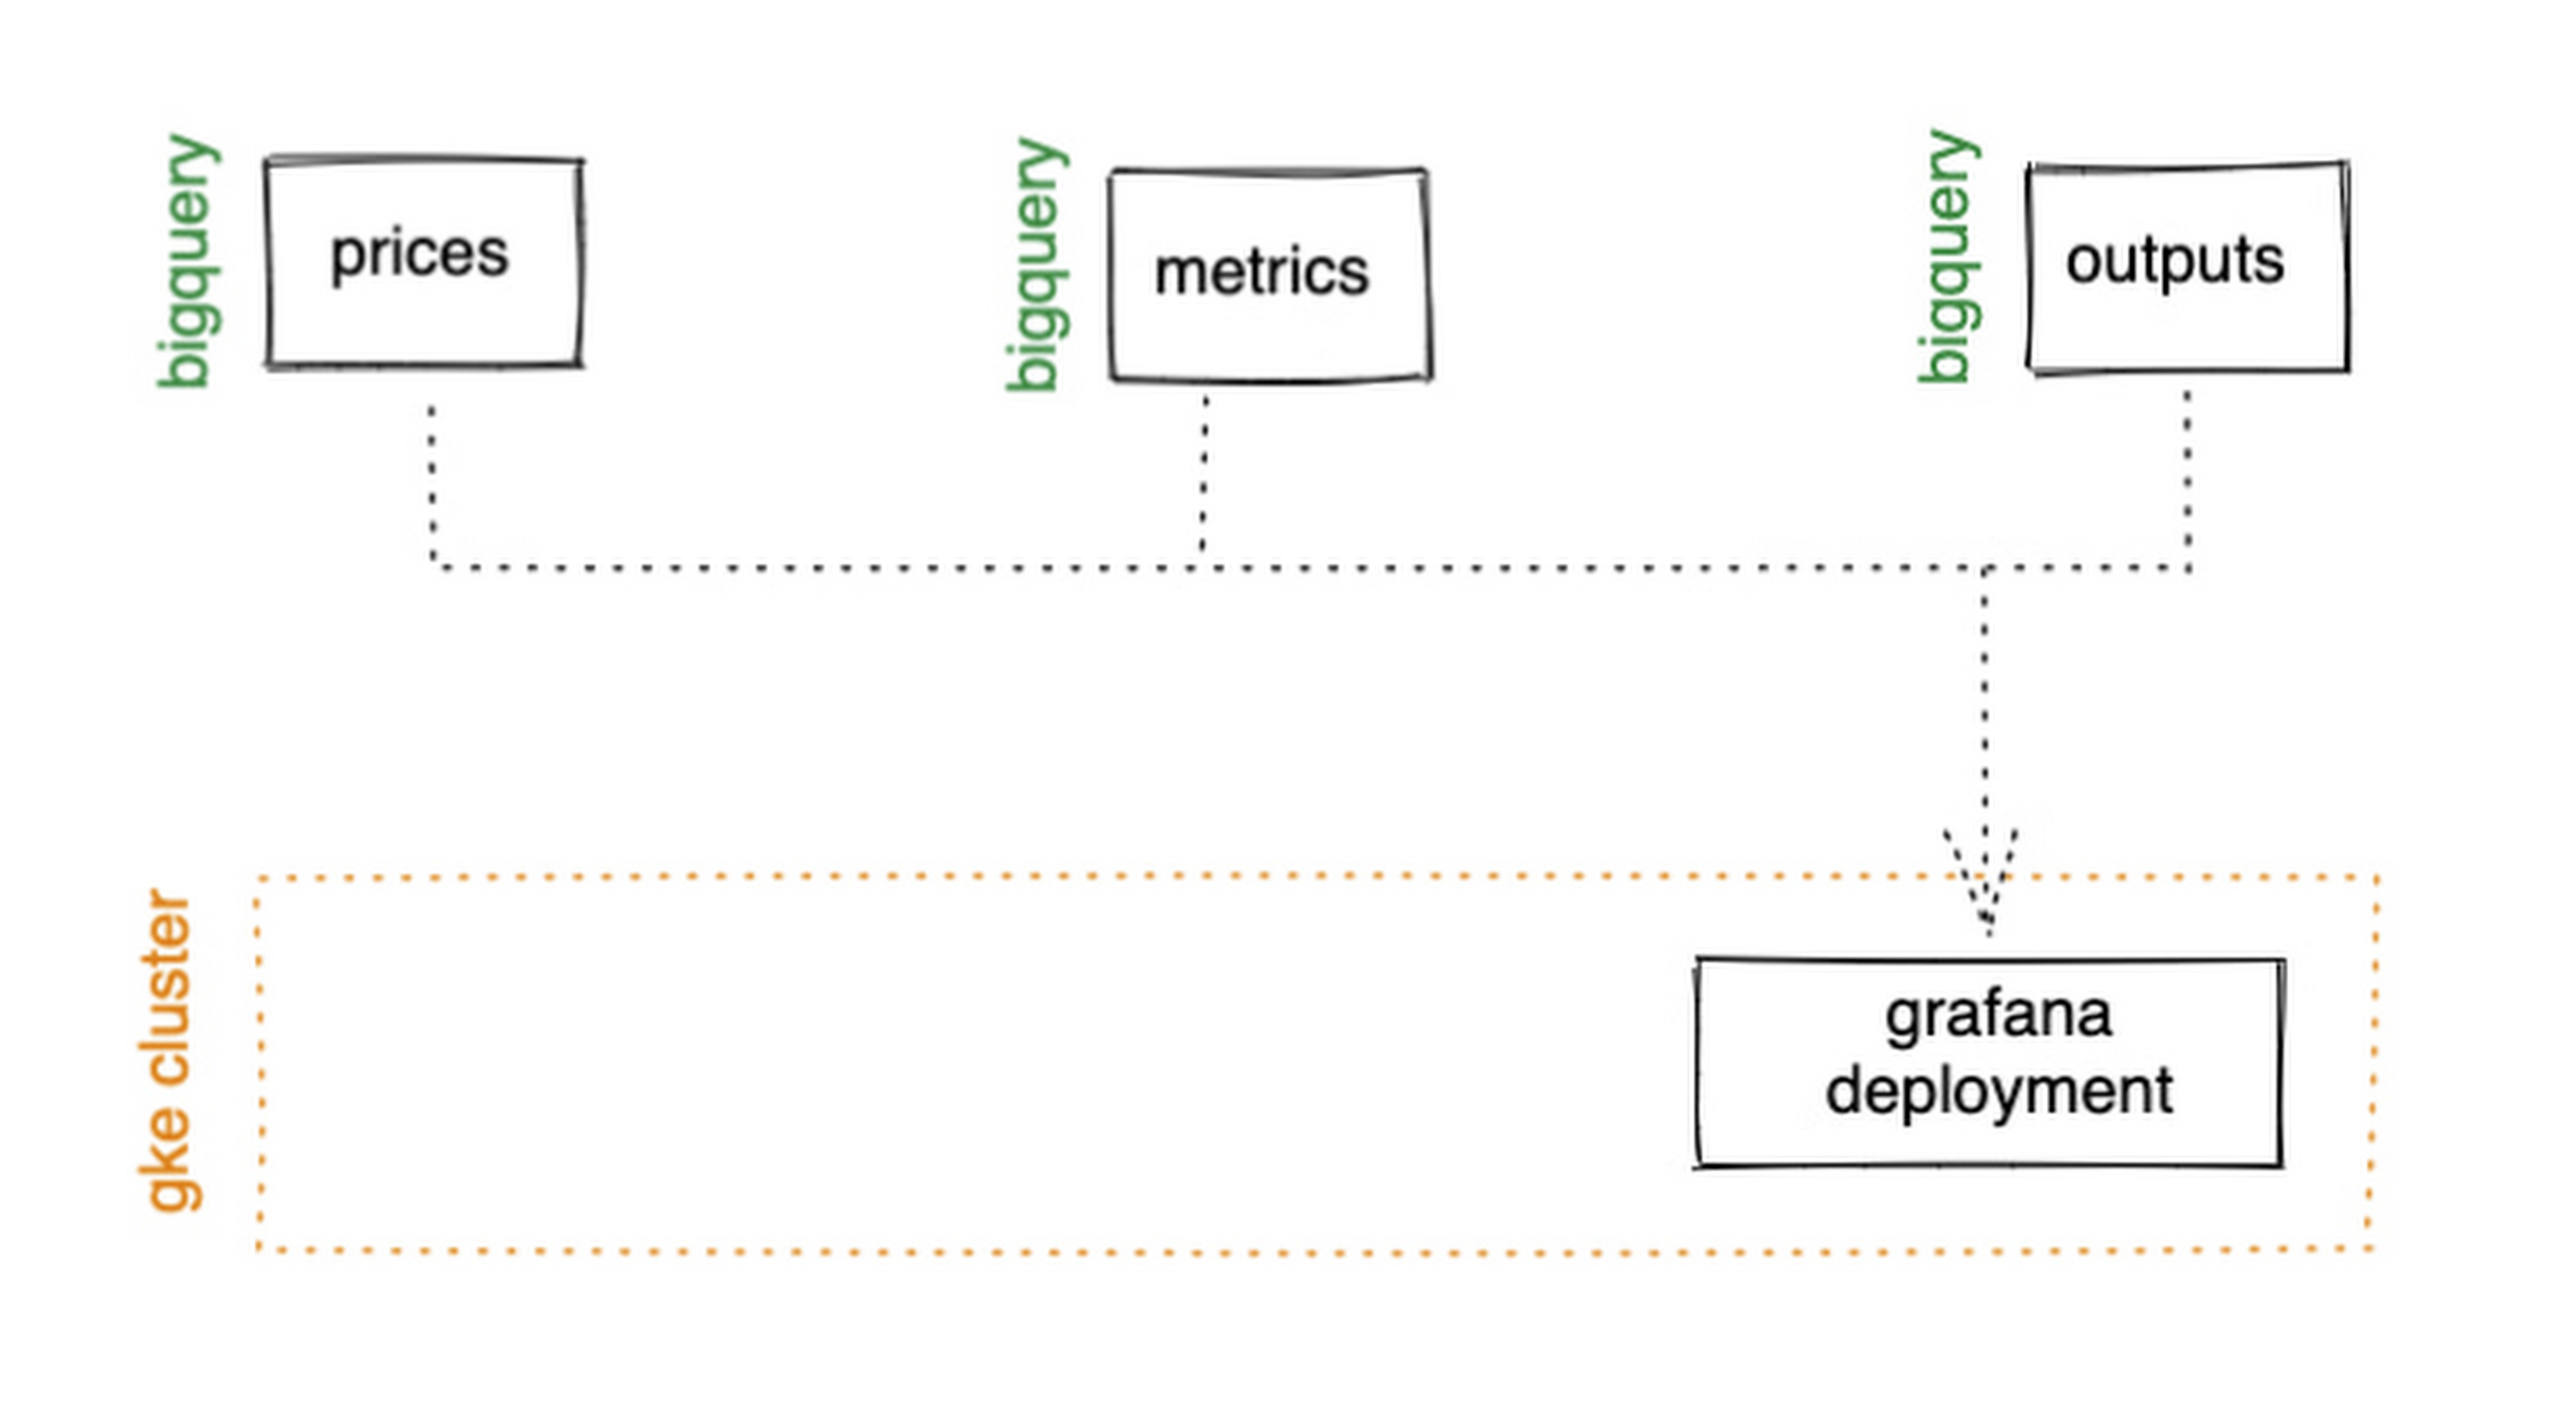
GKE Autopilot has Workload Identity enabled by default, which means we don’t need to worry about passing around secrets for BigQuery access, and can instead just create a GCP service account that has read access to BigQuery and assign it to our deployment through the linked Kubernetes service account.
That’s it! We can now create some panels in a Grafana dashboard and see the gap filling and metrics working in real time.

Building and deploying the Machine Learning Model
Ok, ML time. As we alluded to earlier, we want to continuously retrain our ML model as new data becomes available, to ensure it remains up to date with the current trend of the market. TensorFlow Extended (TFX) is a platform for creating end-to-end machine learning pipelines in production, and eases the process around building a reusable training pipeline. It also has extensions for publishing to AI Platform or Vertex AI, and it can use Dataflow runners, which makes it a good fit for our architecture. The TFX pipeline still needs an orchestrator, so we can host that in a Kubernetes job, and if we wrap it in a scheduled job, then our retraining happens on a schedule too!

TFX requires our data be in the tf.Example format. The Dataflow sample library can output tf.Examples directly, but this tightly couples our two pipelines together. If we want to be able to run multiple ML models in parallel, or train new models on existing historical data, we need our pipelines to only be loosely coupled. Another option is to use the default TFX BigQuery adaptor, but this restricts us to each row in BigQuery mapping to exactly one ML sample, meaning we can’t use recurrent networks.
As neither of the out-of-the-box solutions met our requirements, we decided to write a custom TFX component that did what we needed. Our custom TFX BigQuery adaptor enables us to keep our standard JSON data format in BigQuery and train recurrent networks, and it keeps our pipelines loosely coupled! We need the windowing logic to be the same for both training and inference time, so we built our custom TFX component using standard Beam components, such that the same code can be imported in both pipelines.
def window_elements(pipeline: beam.Pipeline,window_length: int,drop_irregular_windows: bool = True,sort_windows_by: str = "timestamp",):"""Window elements into regular windows of a given size.Assumes elements flow at a fixed rate of 1Hz."""def _sort_windows(window: Iterable[Dict[Text, Any]]) -> List[Dict[Text, Any]]:sorted_window = sorted(window, key=lambda e: e[sort_windows_by])return sorted_windowwindowed_elements = (pipeline| "AddConstantKey" >> beam.Map(lambda item: (0, item))| "WithSlidingWindow">> beam.WindowInto(beam.transforms.window.SlidingWindows(window_length, 1),trigger=beam.transforms.trigger.AfterCount(window_length),accumulation_mode=beam.transforms.trigger.AccumulationMode.DISCARDING,)| "CombineWindow" >> beam.GroupByKey()| "GetValues" >> beam.Values())if drop_irregular_windows:windowed_elements = windowed_elements | "EnforceWindowLengths" >> beam.Filter(lambda w: len(w) == window_length).with_output_types(List[Dict[Text, Any]])if sort_windows_by is not None:windowed_elements = windowed_elements | "Sort" >> beam.Map(_sort_windows).with_output_types(List[Dict[Text, Any]])return windowed_elements
With our custom generator done, we can start designing our anomaly detection model. An autoencoder utilising long-short-term-memory (LSTM) is a good fit for our time-series use case. The autoencoder will try to reconstruct the sample input data, and we can then measure how close it gets. That difference is known as the reconstruction error. If there is a large enough error, we call that sample an anomaly. To learn more about autoencoders, please consider reading chapter 14 from Deep Learning by Ian Goodfellow, Yoshua Bengio, and Aaron Courville.
Our model uses simple moving average, exponential moving average, standard deviation, and log returns as input and output features. For both the encoder and decoder subnetworks, we have 2 layers of 30 time step LSTMs, with 32 and 16 neurons, respectively.
In our training pipeline, we include z score scaling as a preprocessing transformer – which is usually a good idea when it comes to ML. However, there’s a nuance to using an autoencoder for anomaly detection. We need not only the output of the model, but also the input, in order to calculate the reconstruction error. We’re able to do this by using model serving functions to ensure our model returns both the output and preprocessed input as part of its response. As TFX has out-of-the-box support for pushing trained models to AI Platform, all we need to do is configure the pusher, and our (re)training component is complete.
Detecting Anomalies in real time
Now that we have our model in Google Cloud AI Platform, we need our inference pipeline to call to it in real time. As our data is using standard JSON, we can easily apply our RSI rule of thumb inline, ensuring our model only runs when needed. Using the reconstructed output from AI Platform, we are then able to calculate the reconstruction error. We choose to stream this directly into Pub/Sub to enable us to dynamically apply an anomaly threshold when visualising, but if you had a static threshold you could apply it here too.
with beam.Pipeline(options=pipeline_options) as pipeline:(pipeline| "ReadFromPubSub">> beam.io.ReadFromPubSub(topic=input_metrics,timestamp_attribute=timestamp_key,)| "DeserialiseJSON" >> beam.Map(pubsub_serialiser.to_json)| "FilterSymbol" >> beam.Filter(lambda m: m["symbol"] == symbol)| "FilterRSIThreshold">> beam.Filter(lambda m: m["RELATIVE_STRENGTH_INDICATOR"] > rsi_upper_thresholdor m["RELATIVE_STRENGTH_INDICATOR"] < rsi_lower_threshold)| "WindowElements" >> window_elements(window_length)| "RunAutoencoder">> run_windowed_inference(gcp_project_id,model_name,window_length,{f: "FLOAT" for f in feature_metrics},)| "CalcReconError" >> beam.Map(calc_reconstruction_err)| "ToJSON">> beam.Map(lambda re: {"symbol": symbol, "reconstruction_error": re})| "SerialiseJSON" >> beam.Map(pubsub_serialiser.from_json)| "WriteToPubSub">> beam.io.WriteToPubSub(topic=output_alerts,timestamp_attribute=timestamp_key,))
Summary
Here’s what the wider architecture looks like now:

More importantly though, does it fit for our use case? We can plot the reconstruction error of our anomaly detector against the standard RSI buy/sell signal, and see when our model is telling us that perhaps we shouldn’t blindly trust our rule of thumb. Go get ‘em, quant!
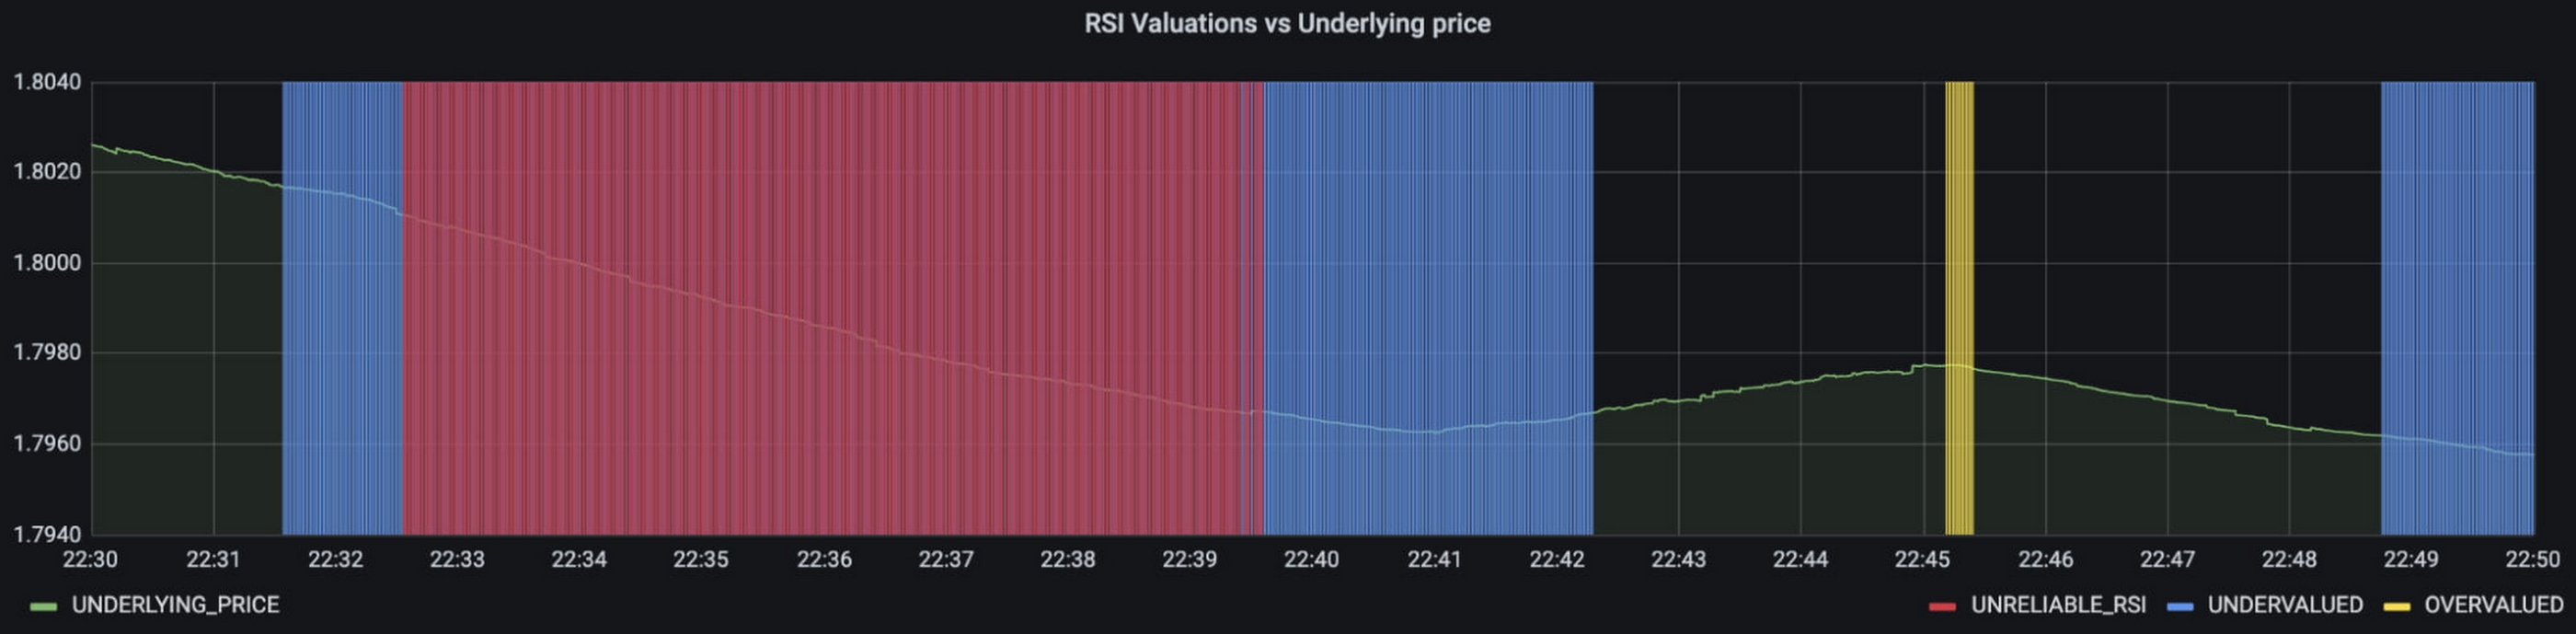
In terms of next steps, there are many things you could do to extend or adapt what we’ve covered. You might want to explore with multi-currency models, where you could detect when the price action of correlated currencies is unexpected, or you could connect all of the Pub/Sub topics to a visualization tool to provide a real-time dashboard.
Give it a try
To finish it all off, and to enable you to clone the repo and set everything up in your own environment, we include a data synthesizer to generate forex data without needing access to a real exchange. As you might have guessed, we host this on our GKE cluster as well. There are a lot of other moving parts – TFX uses a SQL database and all of the application code is packaged into a docker image and deployed along with the infra using Terraform and cloud build. But if you’re interested in those nitty gritty details, head over to the repo and get cloning!
Feel free to reach out to our teams at Google Cloud and Kasna for help in making this pattern work best for your company.
Google is a Leader in the 2019 Gartner Magic Quadrant for Data Management Solutions for Analytics

5989
Of your peers have already read this article.
2:10 Minutes
The most insightful time you'll spend today!
As organizations continue to produce vast quantities of data, they increasingly need platforms that allow them to analyze, store, and extract meaningful insights from that data. And research from analyst firms like Gartner offer an important way for organizations to evaluate and compare cloud data warehouse providers.
Earlier this year, Gartner named Google a Leader in the 2019 Gartner Magic Quadrant for Data Management Solutions for Analytics (DMSA) (report available here). This evaluation covers Google Cloud’s core data analytics offerings, including BigQuery, a serverless, managed data warehouse, Cloud Dataproc, a managed Spark and Hadoop service, and Cloud Dataflow, which enables you to stream and batch-process your data. Here are a few takeaways:
Simplicity and speed
BigQuery’s performance permits complex queries on large-scale data sets to return in seconds, and a substantial number of BigQuery customers maintain data warehouses that store more than 50 terabytes (and a few customers now use more than 100 petabytes). More than half of these customers are loading data either continuously or many times per day. These customers value the ability to extract, transform, load, and analyze their data on a serverless platform, all without maintaining any underlying infrastructure.
A versatile serverless data warehouse
One of BigQuery’s major advantages is its ability to allow customers to address a wide variety of use cases—from a traditional data warehouse to data science. Over the past year, we’ve worked hard to introduce new features in BigQuery like data types for financial and monetary uses, BigQuery GIS for geospatial data, and machine learning capabilities through BigQuery ML. BigQuery’s continuous ingest capabilities make it suitable for an operational—or a real-time—serverless data warehouse.
An expanding ecosystem
With overall increased market adoption, our analytics offerings continue to benefit from a fast-growing partner ecosystem of service providers, and business intelligence (BI) and data integration vendors. In particular, in 2018 we expanded our partnerships with established industry providers, including Confluent, Dell Boomi, Informatica, Looker, Reltio, Tableau, and ThoughtSpot.
More and more organizations are finding value in Google Cloud’s serverless data warehouse and analytics offerings. If you’d like to learn more, you can download a complimentary copy of the Gartner Magic Quadrant for Data Management Solutions for Analytics on the Google site (requires an email address).
Gartner does not endorse any vendor, product or service depicted in its research publications, and does not advise technology users to select only those vendors with the highest ratings or other designation. Gartner research publications consist of the opinions of Gartner’s research organization and should not be construed as statements of fact. Gartner disclaims all warranties, expressed or implied, with respect to this research, including any warranties of merchantability or fitness for a particular purpose.
redBus: Mastering Big Data with Google BigQuery

5397
Of your peers have already read this article.
2:30 Minutes
The most insightful time you'll spend today!
In 2006, online travel agency redBus introduced internet bus ticketing in India, unifying tens of thousands of bus schedules into a single booking operation. (Think of it as Expedia for bus booking.) Using BigQuery, redBus crunches terabytes of booking and inventory data in mere seconds and at a fraction of the cost of other big data services. BigQuery also helps engineers fix glitches quickly, minimize lost sales, and improve customer service.
Challenge
Executives at the Bangalore-based redBus needed a powerful tool to analyze booking and inventory data across their system of hundreds of bus operators serving more than 10,000 routes. They considered using clusters of Hadoop servers to process the data but decided the system would take too much time to set up and would require a specialized staff to maintain it. It also would not provide the lightning-fast analysis they needed.
“It would have taken at least a couple of hours to analyze anything,” says Pradeep Kumar, a technical architect at redBus. “Crunching very large data sets would have been a day’s job. We needed something more powerful to get the real-time analysis we were looking for.”
Solution
Kumar and his colleagues learned about BigQuery and realized it was the right match for their data processing needs. The web-based service, which enables companies to analyze massive datasets using Google’s data processing infrastructure, is easy to set up and manage since its simple, SQL-like query language doesn’t require complex technology or specialized personnel. It also has low overhead costs.
The redBus team uses BigQuery as part of an intricate data collection and analysis process. Applications hosted on a range of servers continually pump information related to customer searches, seat inventory, and bookings into a centralized data collection system. Engineers upload the data to BigQuery, which provides answers to complex queries within seconds. For example, BigQuery helps redBus staff:
- Learn how many times customers searched for seats and found none or very few available, indicating more seats should be added to a route
- Investigate decreases in bookings and notify engineers if a technical problem is the cause
- Identify server problems by quickly analyzing data related to server activity
Results
BigQuery provides near real-time data analysis capabilities at 20% of the cost of maintaining a complex Hadoop infrastructure. Queries that would have required a day to analyze on a Hadoop framework take less than 30 seconds using Google’s web-based service.
“We explored several data analytics solutions. Nothing comes remotely close to the sheer power of Google BigQuery,” Kumar says. “It made large-scale data collection and crunching possible with little effort, which has translated to a significant business advantage.”
Google Cloud Platform results
- Analyzes data sets as large as 2 terabytes in less than 30 seconds using a simple, SQL-like language
- Saves time analyzing technical problems and customer booking trends
- Spends 80% less than they would have on a Hadoop infrastructure and avoids setting up and maintaining a complex infrastructure in-house
- Strengthens the company by improving customer service and engineering quality
The fast insights gained through BigQuery are also making redBus a stronger company. By minimizing the time it takes staff members to solve technical problems, BigQuery has helped improve customer service and reduce lost sales.
“Getting to the root of problems used to be really time-consuming,” Kumar says. “By the time we figured it out, customers might have given up. Now if there are booking problems, BigQuery helps us understand the reason right away. Choosing Google BigQuery was the right decision for our company.”
More Relevant Stories for Your Company

Telehealth Improves Patient and Clinical Experiences across Continuum of Care
According to a National Academy of Medicine discussion paper, social determinants of health (SDoH) account for upwards of 80% of a population's health outcomes. Breaking this down further, 50% come just from socioeconomic and physical environment factors such as education, employment, income, family and social support, community safety, air and water



Responsible AI: From Theory to Practice
In less than 10 years, AI will be the number one driver of global GDP growth. And organizations that achieve AI absorption will be the leaders of the global economy. But as fast as AI is progressing, it also requires more care and attention from a responsibility standpoint. A more

How AI is Revolutionizing Retail: Lessons for Marketers
Reach the Right Customers How can AI help you target customers who are looking for products like yours? The challenge: This customer wants to buy the best cat food for her pets. How AI Works The Result A targeted offer for a discount on luxury cat food is shown to

Japanese Used Car Operator Uses Machine Learning to Improve Marketing
Since 1994, IDOM, Japan’s leading buyer and retailer of used cars, has enjoyed success in the auto industry with a simple yet traditional business model: buy pre-owned vehicles directly from car owners and auction them to third-party dealers, or sell them to other consumers at retail stores. In an increasingly
