






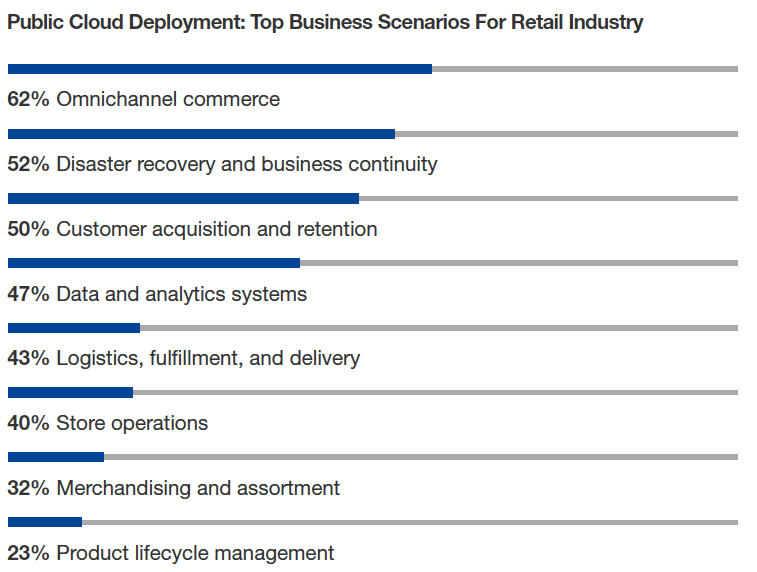
Forrester Surveyed Indian Retailers About Digital Transformation. Here’s What They Found
READ FULL INTRODOWNLOAD AGAIN3997
Of your peers have already downloaded this article
12:30 Minutes
The most insightful time you'll spend today!
AI in Manufacturing Already A Mainstream: Google Cloud Study

5682
Of your peers have already read this article.
3:00 Minutes
The most insightful time you'll spend today!
While the promise of artificial intelligence transforming the manufacturing industry is not new, long-ongoing experimentation hasn’t yet led to widespread business benefits. Manufacturers remain in “pilot purgatory,” as Gartner reports that only 21% of companies in the industry have active AI initiatives in production.
However, new research from Google Cloud reveals that the COVID-19 pandemic may have spurred a significant increase in the use of AI and other digital enablers among manufacturers. According to our data—which polled more than 1,000 senior manufacturing executives across seven countries—76% have turned to digital enablers and disruptive technologies due to the pandemic such as data and analytics, cloud, and artificial intelligence (AI). And 66% of manufacturers who use AI in their day-to-day operations report that their reliance on AI is increasing.

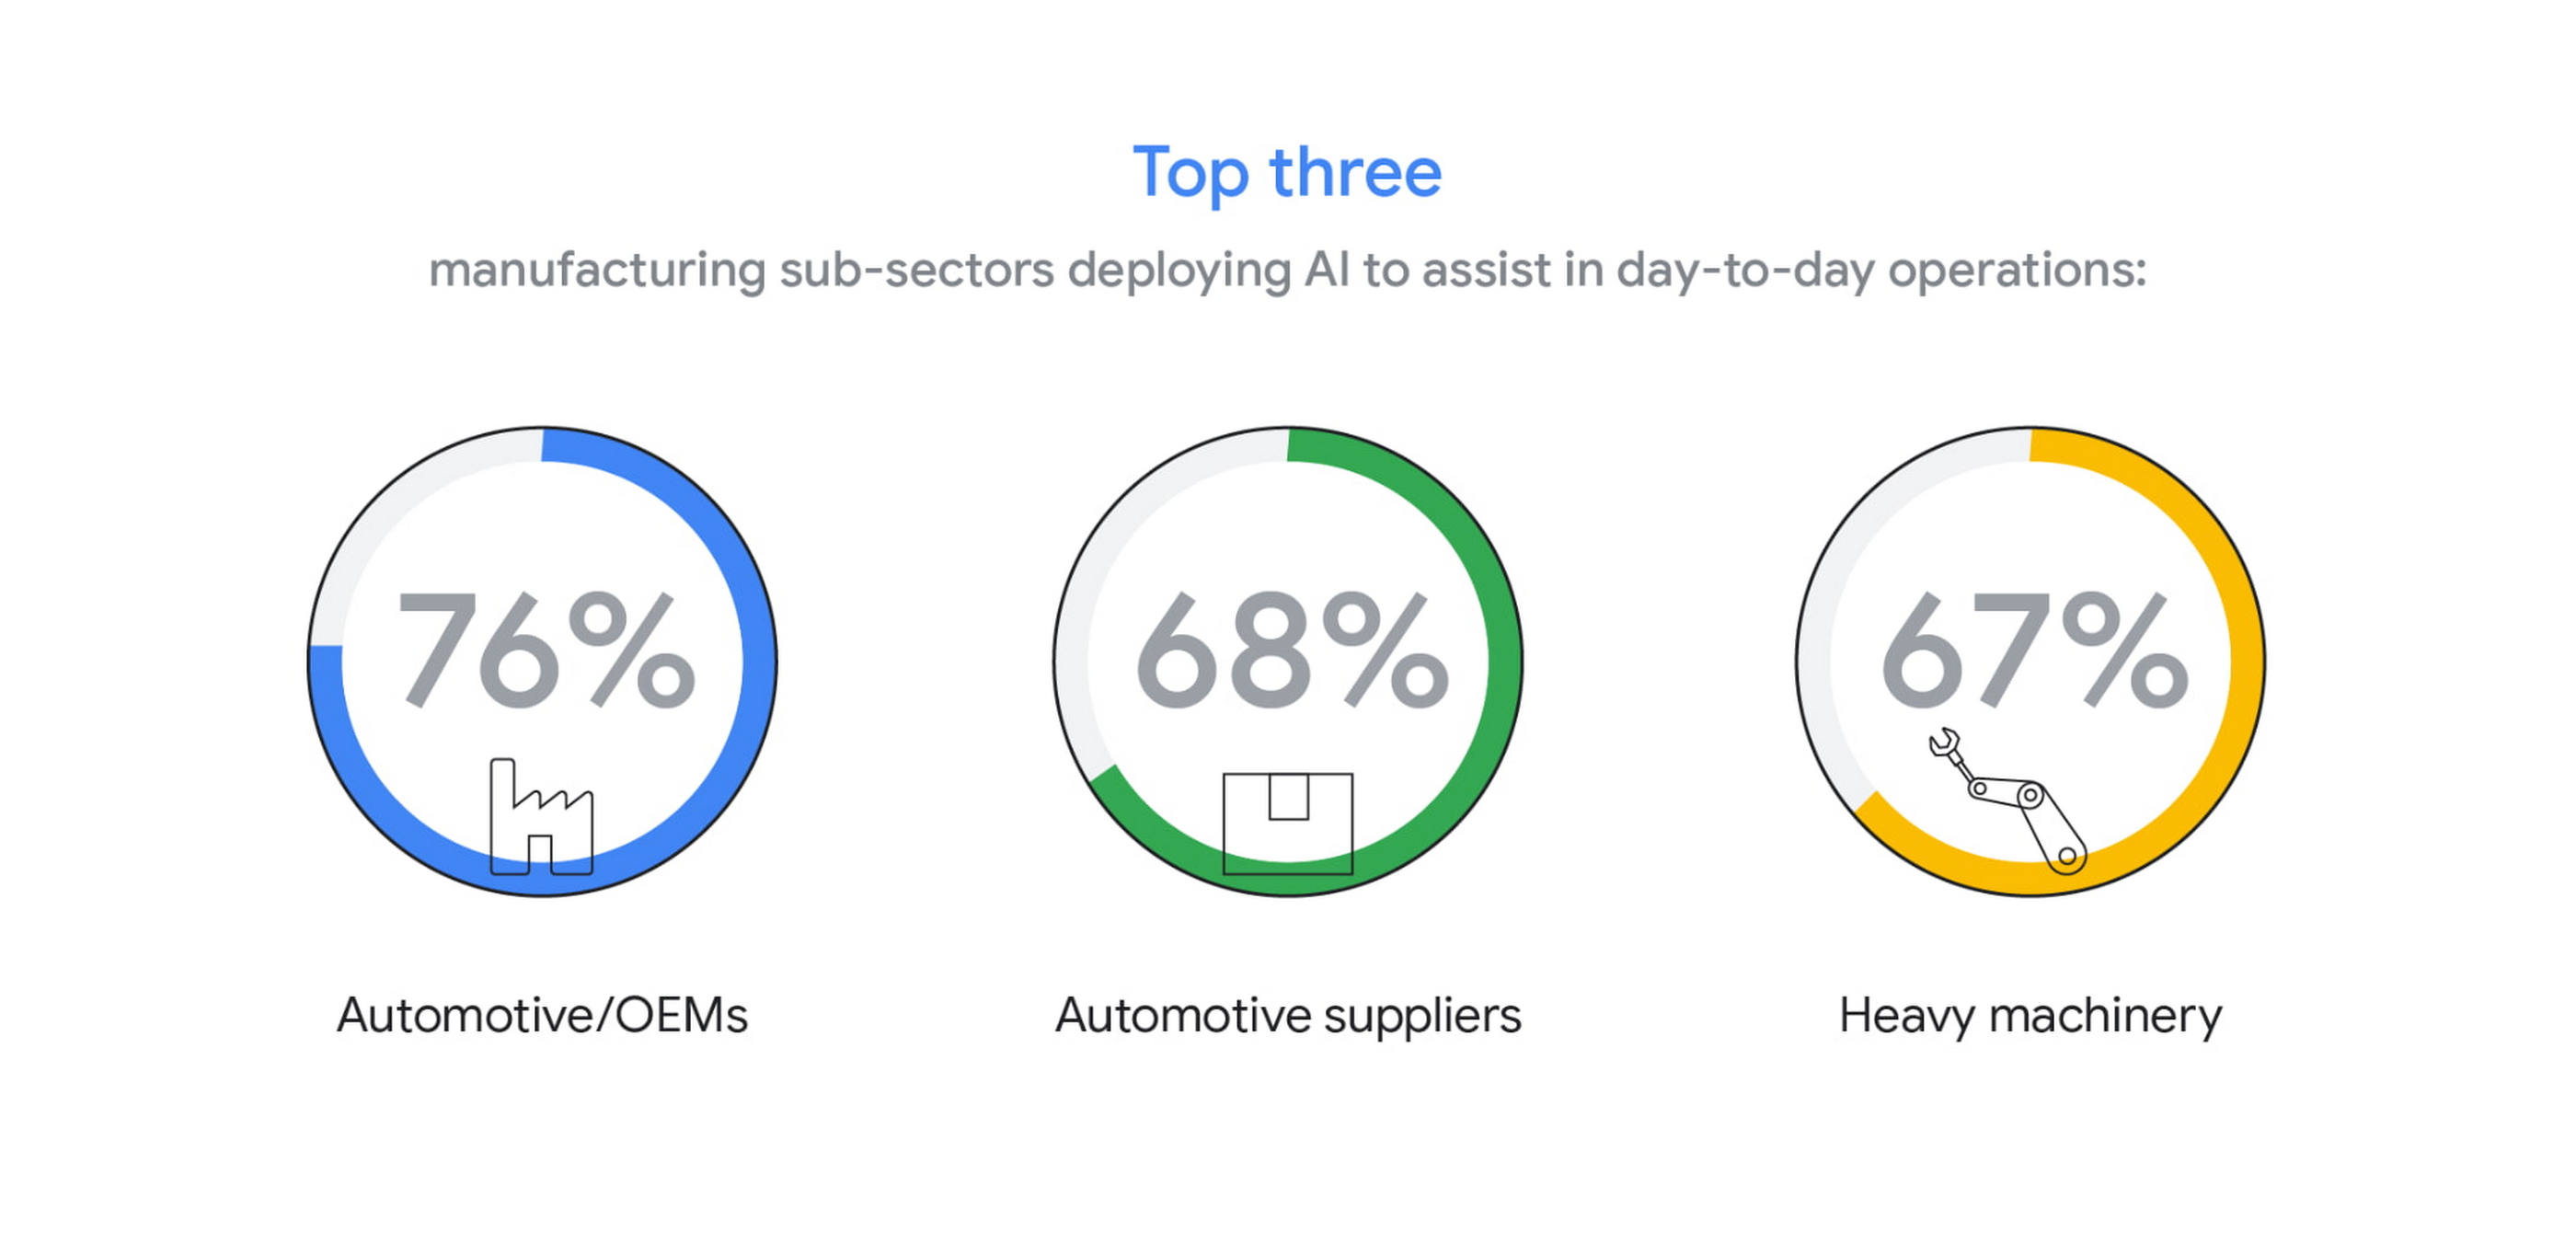
The top three sub-sectors deploying AI to assist in day-to-day operations are automotive/OEMs (76%), automotive suppliers (68%), and heavy machinery (67%).
In fact, Bryan Goodman, Director of Artificial Intelligence and Cloud, Ford Global Data & Insight and Analytics shares, “Our new relationship with Google will supercharge our efforts to democratize AI across our business, from the plant floor to vehicles to dealerships. We used to count the number of AI and machine learning projects at Ford. Now it’s so commonplace that it’s like asking how many people are using math. This includes an AI ecosystem that is fueled by data, and that powers a ‘digital network flywheel.’”
Moving from edge cases to mainstream business needs
Why are manufacturers now turning to AI in increasing numbers? Our research shows that companies who currently use AI in day-to-day operations are looking for assistance with business continuity (38%), helping make employees more efficient (38%), and to be helpful for employees overall (34%). It’s clear that AI/ML technology can augment manufacturing employees’ efforts, whether by providing prescriptive analytics like real-time guidance and training, flagging safety hazards, or detecting potential defects on the assembly line.

In terms of specific AI use cases called out by the research, two main areas emerged: quality control and supply chain optimization. In the quality control category, 39% of surveyed manufacturers who use AI in their day-to-day operations use it for quality inspection and 35% for product and/or production line quality checks. At Google Cloud, we often speak with manufacturers about AI for visual inspection of finished products. Using AI vision, production line workers can spend less time on repetitive product inspections and can instead focus on more complex tasks, such as root cause analysis.
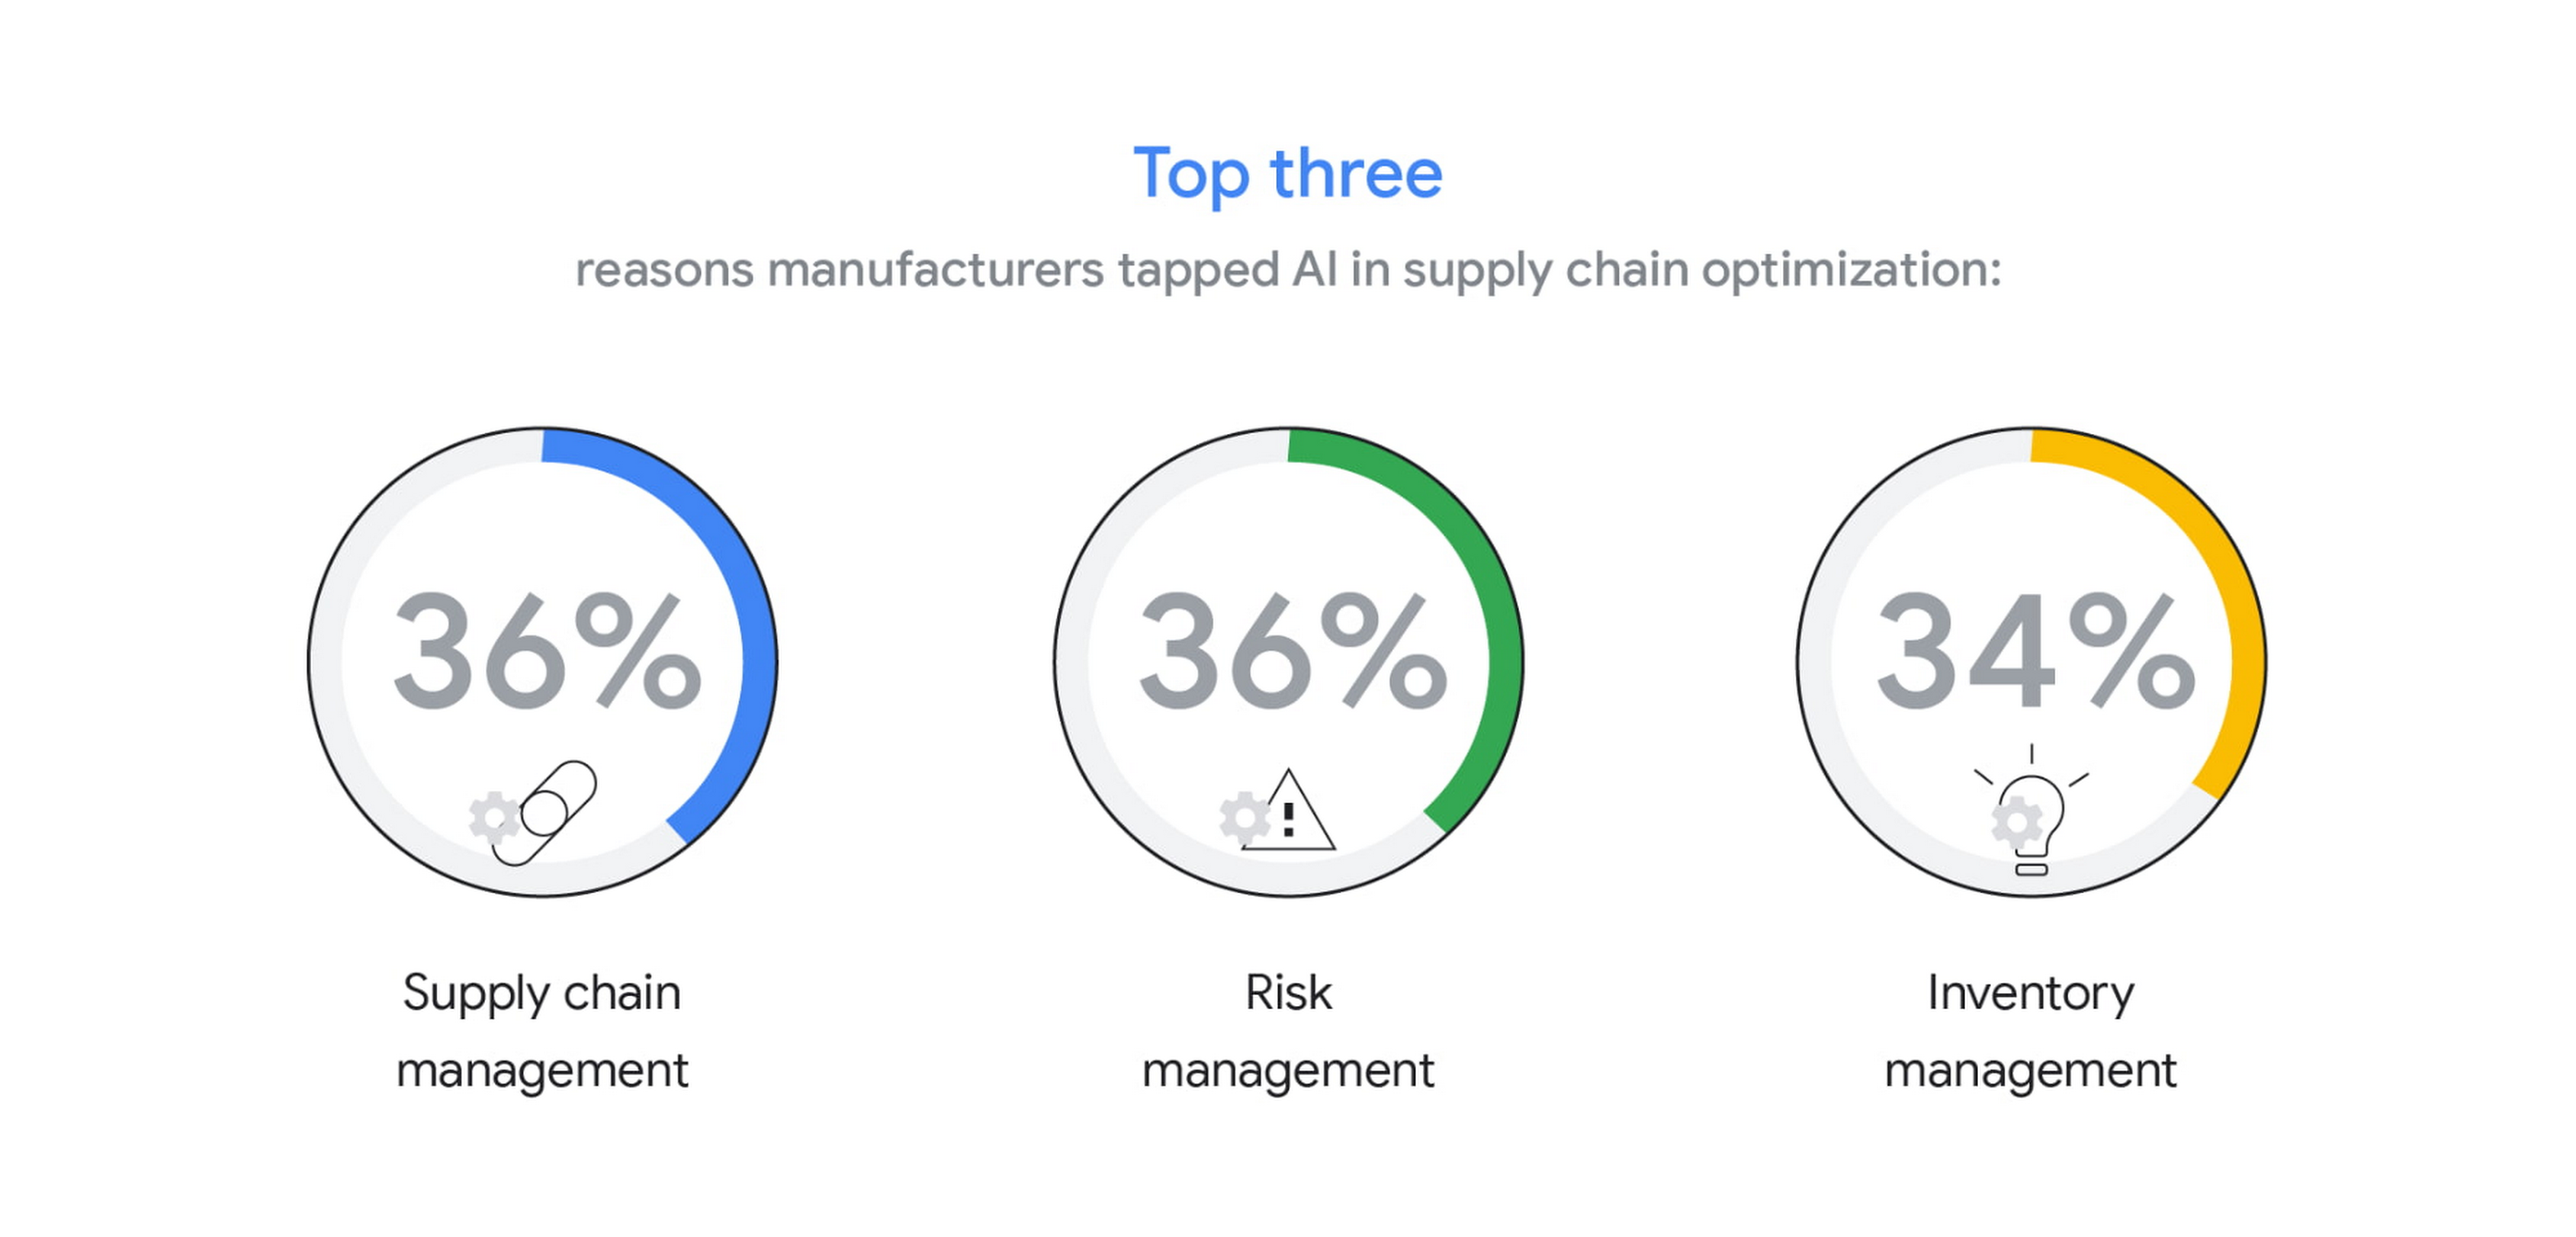
In the supply chain optimization category, manufacturers said they tapped AI for supply chain management (36%), risk management (36%), and inventory management (34%).
In our day-to-day work, we’re seeing many manufacturers rethink their supply chains and operating models to better accommodate for the increased volatility that has been brought about by the pandemic and support the secular trend of consumers asking for increasingly individualized products. We’ll share more on deglobalization in the third installment of our manufacturing insights series.
AI use differs by geography, but not for the reasons you may think
The extent to which AI is already being used today varies quite strongly between geographies, according to our research. While 80% and 79% of manufacturers in Italy and Germany respectively report using AI in day-to-day operations, that percentage plummets in the United States (64%), Japan (50%) and Korea (39%).

It’s tempting to state this disparity is due to an “AI talent gap.” Although the most common barrier, just a quarter (23%) of manufacturers surveyed believe they don’t have the talent to properly leverage AI. Cost, too, does not appear to be a roadblock (21% of those surveyed). Rather, from our observations, the missing link appears to be having the right technology platform and tools to manage a production-grade AI pipeline. This is obviously the focus of our efforts and others in the space, as we believe the cloud can truly help the industry make a step change.
Looking ahead: The Golden Age of AI for manufacturing
The key to widespread adoption of AI lies in its ease of deployment and use. As AI becomes more pervasive in solving real-world problems for manufacturers, we see the industry moving away from “pilot purgatory” to the “golden age of AI.” The manufacturing industry is no stranger to innovation, from the days of mass production, to lean manufacturing, six sigma and, more recently, enterprise resource planning. AI promises to bring even more innovation to the forefront.
To learn more about these findings and more, download our infographic here and our full report here.
Research methodology
The survey was conducted online by The Harris Poll on behalf of Google Cloud, from October 15 – November 4, 2020, among 1,154 senior manufacturing executives in France (n=150), Germany (n=200), Italy (n=154), Japan (n=150), South Korea (n=150), the UK (n=150), and the U.S. (n=200) who are employed full-time at a company with more than 500 employees, and who work in the manufacturing industry with a title of director level or higher. The data in each country were weighted by number of employees to bring them into line with actual company size proportions in the population. A global post-weight was applied to ensure equal weight of each country in the global total.
7479
Of your peers have already watched this video.
1:15 Minutes
The most insightful time you'll spend today!
An Indian Example of How to Really Up Your Customer Experience Game and Increase Conversion Rates With AI
How about selfie analysis of users to recommend them the right lipstick color?
That’s just one of the many ideas folks at Purplle.com came up with to improve the buying experience of Indian consumers.
And without the power of Google Cloud, it would probably have remained just that…an idea.
But today, thanks to Google Cloud, “Nothing seems impossible,” says Suyash Katyayani, CTO, Purplle.
Purplle.com is an online e-commerce company in India and one of the pioneers in creating a digitally-native beauty brands in India.
“The beauty industry is so data intensive that we needed to have a strong data strategy and we were looking out for solutions which would enable us to have a strong data pipeline and a strong data warehousing solution,” says Katyayani.
That’s when it turned to Google Cloud.
Additionally, Purplle.com, says Katyayani, does not have to worry about at what scale the company operates at because they have access to state-of-the-art infrastructure from Google Cloud available to them so that their developers can run experiments.
“The biggest plus point for us has been the agility that Google Cloud has added,” says Katyayani.
Google Cloud Region in Columbus to Accelerate Ohioan Businesses and Tech Transformation

3212
Of your peers have already read this article.
1:30 Minutes
The most insightful time you'll spend today!
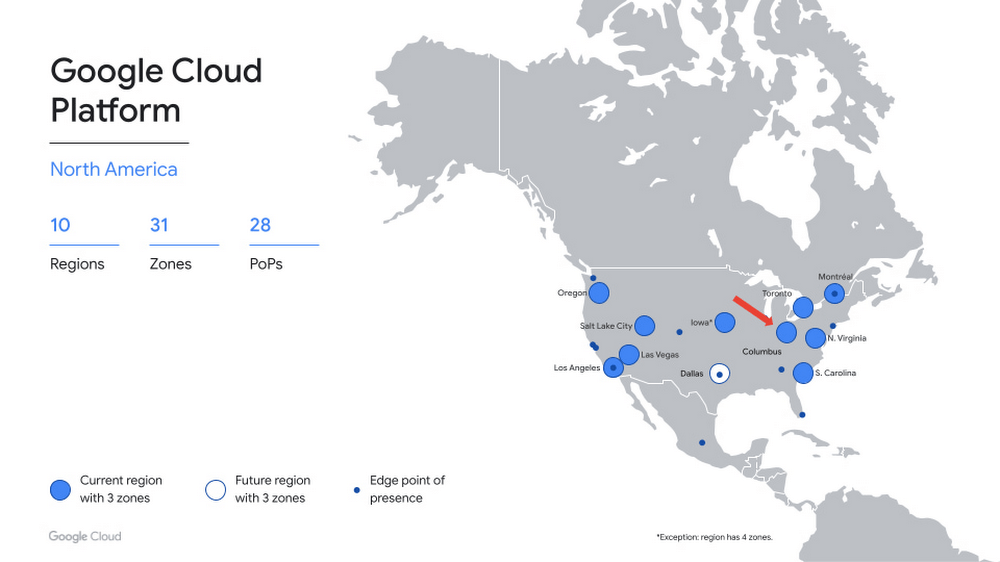
Digital tools such as cloud computing are fueling economic transformation across the US, including Ohio. Google continues to invest across cities and communities in Ohio, bringing over 200 jobs to the state, and helping provide $12.85 billion of economic activity for tens of thousands of Ohio businesses, nonprofits, publishers, creators and developers. To further accelerate the transformation of all Ohioan businesses and technologists, we’re thrilled to announce our newest Google Cloud region in Columbus, Ohio is open. The Columbus cloud region brings a second region to the Midwest, the 10th region to North America, and grows our global cloud region count to 33.
A region for the Buckeye State
Now open to Google Cloud customers, the Columbus region (us-east5) provides you with the speed and availability you need to innovate faster, build high-performing applications, and serve local customers — all on the cleanest cloud in the industry. Additionally, the region gives you added flexibility to distribute your workloads across the central, midwest, and eastern US.
The Columbus region offers immediate access to three zones, for high availability workloads, and our standard set of products, including Compute Engine, Google Kubernetes Engine, Cloud Storage, Persistent Disk, CloudSQL, and Cloud Identity. Our private backbone connects Columbus to our global network more quickly and securely. In addition, you can integrate your on-premises workloads with our new region using Cloud Interconnect. This means that Columbus-based customers can expand globally from their front door, and those based outside the region can more easily reach their users in the Midwest.
What customers are saying
Industries including retail, financial services, and IT are investing in Columbus. Organizations across these verticals have turned to the Google Cloud to innovate faster and help solve their most complex challenges
“As Wendy’s continues to innovate in new ways to create fast, frictionless, and fun interactions that redefine the way customers visit and enjoy our restaurants, our partnership with Google Cloud is a key enabler to delivering on our AI/ML and data analytics strategies. The proximity of the new Google Cloud region to Wendy’s headquarters provides the ability for us to move and scale quickly as business needs evolve. Additionally, Google Cloud’s investment in Columbus positions central Ohio as a true technology hub, which further boosts Wendy’s and other regional employers’ ability to recruit innovative talent,” said Kevin Vasconi, Chief Information Officer, Wendy’s.
“Huntington National Bank’s API Architecture is a central component to our growth and technology strategy. As our business segments grow from an offering and geographic perspective, we must evolve our technology to provide the optimal experience for our customers and our partners. Collaborating directly with Google Cloud on the build out of their cloud region in Central Ohio, provides the access our technology teams need to innovatively scale our infrastructure to meet the demands of our business with increased availability, lower latency, and greater resiliency,” said Geoff Preston, Chief Architect, Huntington National Bank.
“Google Cloud has been instrumental in our ability to scale and optimize data management and compute resources. We prioritize scale, elasticity and resilience in cloud services and Google Cloud delivers all three globally and locally. With Google Cloud security, we can efficiently process the quantities of application data required to accelerate alert detection and reduce response times for the critical infrastructure our customers depend on to enable the continuity of their vital applications.” said Sheryl Haislet, Chief Information Officer at Vertiv, a global provider of critical digital infrastructure and continuity systems headquartered in Columbus, Ohio, that leverages Google Cloud solutions to provide resilience for its operations and to better support customers.
“The addition of the new cloud region in Ohio continues to demonstrate Google Cloud’s commitment to the enterprise space and their presence in the region,” said Chris Delong, Chief Technology Officer, Designer Brands Inc. / DSW
What’s next
We are thrilled to welcome you to our new cloud region in Columbus, and eagerly await to see what you build with our platform. Register here for our Cloud Study Jam in June – an event for local developers to get hands-on training with Google Cloud. Stay tuned for more region announcements and launches this year, including our next U.S. region in Dallas, TX. And for more information, contact sales to get started with Google Cloud today.
10172
Of your peers have already watched this video.
1:00 Minutes
The most insightful time you'll spend today!
Predict User Churn on Gaming Apps with Google Analytics Data using BigQuery ML
User retention can be a major challenge for mobile game developers. According to the Mobile Gaming Industry Analysis in 2019, most mobile games only see a 25% retention rate for users after the first day. To retain a larger percentage of users after their first use of an app, developers can take steps to motivate and incentivize certain users to return. But to do so, developers need to identify the propensity of any specific user returning after the first 24 hours.
In this blog post, we will discuss how you can use BigQuery ML to run propensity models on Google Analytics 4 data from your gaming app to determine the likelihood of specific users returning to your app.
You can also use the same end-to-end solution approach in other types of apps using Google Analytics for Firebase as well as apps and websites using Google Analytics 4. To try out the steps in this blogpost or to implement the solution for your own data, you can use this Jupyter Notebook.
Using this blog post and the accompanying Jupyter Notebook, you’ll learn how to:
- Explore the BigQuery export dataset for Google Analytics 4
- Prepare the training data using demographic and behavioural attributes
- Train propensity models using BigQuery ML
- Evaluate BigQuery ML models
- Make predictions using the BigQuery ML models
- Implement model insights in practical implementations
Google Analytics 4 (GA4) properties unify app and website measurement on a single platform and are now default in Google Analytics. Any business that wants to measure their website, app, or both, can use GA4 for a more complete view of how customers engage with their business. With the launch of Google Analytics 4, BigQuery export of Google Analytics data is now available to all users. If you are already using a Google Analytics 4 property, you can follow this guide to set up exporting your GA data to BigQuery.
Once you have set up the BigQuery export, you can explore the data in BigQuery. Google Analytics 4 uses an event-based measurement model. Each row in the data is an event with additional parameters and properties. The Schema for BigQuery Export can help you to understand the structure of the data.
In this blogpost, we use the public sample export data from an actual mobile game app called “Flood It!” (Android, iOS) to build a churn prediction model. But you can use data from your own app or website.
Here’s what the data looks like. Each row in the dataset is a unique event, which can contain nested fields for event parameters.
SELECT *FROM `firebase-public-project.analytics_153293282.events_*`TABLESAMPLE SYSTEM (1 PERCENT)

This dataset contains 5.7M events from over 15k users.
SELECTCOUNT(DISTINCT user_pseudo_id) as count_distinct_users,COUNT(event_timestamp) as count_eventsFROM`firebase-public-project.analytics_153293282.events_*

Our goal is to use BigQuery ML on the sample app dataset to predict propensity to user churn or not churn based on users’ demographics and activities within the first 24 hours of app installation.

In the following sections, we’ll cover how to:
- Pre-process the raw event data from GA4
- Identify users & the label feature
- Process demographic features
- Process behavioral features
- Train classification model using BigQuery ML
- Evaluate the model using BigQueryML
- Make predictions using BigQuery ML
- Utilize predictions for activation
Pre-process the raw event data
You cannot simply use raw event data to train a machine learning model as it would not be in the right shape and format to use as training data. So in this section, we’ll go through how to pre-process the raw data into an appropriate format to use as training data for classification models.
This is what the training data should look like for our use case at the end of this section:

Notice that in this training data, each row represents a unique user with a distinct user ID (user_pseudo_id).
Identify users & the label feature
We first filtered the dataset to remove users who were unlikely to return the app anyway. We defined these ‘bounced’ users as ones who spent less than 10 mins with the app. Then we labeled all remaining users:
- churned: No event data for the user after 24 hours of first engaging with the app.
- returned: The user has at least one event record after 24 hours of first engaging with the app.
For your use case, you can have a different definition of bounce and churning. Also you can even try to predict something else other than churning, e.g.:
- whether a user is likely to spend money on in-game currency
- likelihood of completing n-number of game levels
- likelihood of spending n amount of time in-game etc.
In such cases, label each record accordingly so that whatever you are trying to predict can be identified from the label column.
From our dataset, we found that ~41% users (5,557) bounced. However, from the remaining users (8,031), ~23% (1,883) churned after 24 hours:
SELECTbounced,churned,COUNT(churned) as count_usersFROMbqmlga4.returningusersGROUP BY 1,2ORDER BY bounced

To create these bounced and churned columns, we used the following snippet of SQL code.
...#churned = 1 if last_touch within 24 hr of app installation, else 0IF (user_last_engagement < TIMESTAMP_ADD(user_first_engagement,INTERVAL 24 HOUR),1,0 ) AS churned,#bounced = 1 if last_touch within 10 min, else 0IF (user_last_engagement <= TIMESTAMP_ADD(user_first_engagement,INTERVAL 10 MINUTE),1,0 ) AS bounced,...
You can view the Jupyter Notebook for the full query used for materializing the bounced and churned labels.
Process demographic features
Next, we added features both for demographic data and for behavioral data spanning across multiple columns. Having a combination of both demographic data and behavioral data helps to create a more predictive model.
We used the following fields for each user as demographic features:
geo.countrydevice.operating_systemdevice.language
A user might have multiple unique values in these fields — for example if a user uses the app from two different devices. To simplify, we used the values from the very first user engagement event.
CREATE OR REPLACE VIEW bqmlga4.user_demographics AS (WITH first_values AS (SELECTuser_pseudo_id,geo.country as country,device.operating_system as operating_system,device.language as language,ROW_NUMBER() OVER (PARTITION BY user_pseudo_id ORDER BY event_timestamp DESC) AS row_numFROM `firebase-public-project.analytics_153293282.events_*`WHERE event_name="user_engagement")SELECT * EXCEPT (row_num)FROM first_valuesWHERE row_num = 1 #first engagement);
Process behavioral features
There is additional demographic information present in the GA4 export dataset, e.g. app_info, device, event_params, geo etc. You may also send demographic information to Google Analytics through each hit via user_properties. Furthermore, if you have first-party data on your own system, you can join that with the GA4 export data based on user_ids.
To extract user behavior from the data, we looked into the user’s activities within the first 24 hours of first user engagement. In addition to the events automatically collected by Google Analytics, there are also the recommended events for games that can be explored to analyze user behavior. For our use case, to predict user churn, we counted the number of times the follow events were collected for a user within 24 hours of first user engagement:
user_engagementlevel_start_quickplaylevel_end_quickplaylevel_complete_quickplaylevel_reset_quickplaypost_scorespend_virtual_currencyad_rewardchallenge_a_friendcompleted_5_levelsuse_extra_steps
The following query shows how these features were calculated:
WITHevents_first24hr AS (SELECTe.*FROM`firebase-public-project.analytics_153293282.events_*` eJOINbqmlga4.returningusers rONe.user_pseudo_id = r.user_pseudo_idWHERETIMESTAMP_MICROS(e.event_timestamp) <= r.ts_24hr_after_first_engagement)SELECTuser_pseudo_id,SUM(IF(event_name = 'user_engagement', 1, 0)) AS cnt_user_engagement,# ... repeated for all behavior data ...SUM(IF(event_name = 'use_extra_steps', 1, 0)) AS cnt_use_extra_steps,FROMevents_first24hrGROUP BY1
View the notebook for the query used to aggregate and extract the behavioral data. You can use different sets of events for your use case. To view the complete list of events, use the following query:
SELECTevent_name,COUNT(event_name) as event_countFROM`firebase-public-project.analytics_153293282.events_*`GROUP BY 1ORDER BYevent_count DESC
After this we combined the features to ensure our training dataset reflects the intended structure. We had the following columns in our table:
- User ID:
user_pseudo_id
- Label:
churned
- Demographic features
countrydevice_osdevice_language
- Behavioral features
cnt_user_engagementcnt_level_start_quickplaycnt_level_end_quickplaycnt_level_complete_quickplaycnt_level_reset_quickplaycnt_post_scorecnt_spend_virtual_currencycnt_ad_rewardcnt_challenge_a_friendcnt_completed_5_levelscnt_use_extra_stepsuser_first_engagement
At this point, the dataset was ready to train the classification machine learning model in BigQuery ML. Once trained, the model will output a propensity score between churn (churned=1) or return (churned=0) indicating the probability of a user churning based on the training data.
Train classification model
When using the CREATE MODEL statement, BigQuery ML automatically splits the data between training and test. Thus the model can be evaluated immediately after training (see the documentation for more information).
For the ML model, we can choose among the following classification algorithms where each type has its own pros and cons:

Often logistic regression is used as a starting point because it is the fastest to train. The query below shows how we trained the logistic regression classification models in BigQuery ML.
CREATE OR REPLACE MODEL bqmlga4.churn_logregTRANSFORM(EXTRACT(MONTH from user_first_engagement) as month,EXTRACT(DAYOFYEAR from user_first_engagement) as julianday,EXTRACT(DAYOFWEEK from user_first_engagement) as dayofweek,EXTRACT(HOUR from user_first_engagement) as hour,* EXCEPT(user_first_engagement, user_pseudo_id))OPTIONS(MODEL_TYPE="LOGISTIC_REG",INPUT_LABEL_COLS=["churned"]) ASSELECT*FROMbqmlga4.train
We extracted month, julianday, and dayofweek from datetimes/timestamps as one simple example of additional feature preprocessing before training. Using TRANSFORM() in your CREATE MODEL query allows the model to remember the extracted values. Thus, when making predictions using the model later on, these values won’t have to be extracted again. View the notebook for the example queries to train other types of models (XGBoost, deep neural network, AutoML Tables).
Evaluate model
Once the model finished training, we ran ML.EVALUATE to generate precision, recall, accuracy and f1_score for the model:
SELECT*FROMML.EVALUATE(MODEL bqmlga4.churn_logreg)

The optional THRESHOLD parameter can be used to modify the default classification threshold of 0.5. For more information on these metrics, you can read through the definitions on precision and recall, accuracy, f1-score, log_loss and roc_auc. Comparing the resulting evaluation metrics can help to decide among multiple models.Furthermore, we used a confusion matrix to inspect how well the model predicted the labels, compared to the actual labels. The confusion matrix is created using the default threshold of 0.5, which you may want to adjust to optimize for recall, precision, or a balance (more information here).
SELECTexpected_label,_0 AS predicted_0,_1 AS predicted_1FROMML.CONFUSION_MATRIX(MODEL bqmlga4.churn_logreg)

This table can be interpreted in the following way:

Make predictions using BigQuery ML
Once the ideal model was available, we ran ML.PREDICT to make predictions. For propensity modeling, the most important output is the probability of a behavior occurring. The following query returns the probability that the user will return after 24 hrs. The higher the probability and closer it is to 1, the more likely the user is predicted to return, and the closer it is to 0, the more likely the user is predicted to churn.
SELECTuser_pseudo_id,returned,predicted_returned,predicted_returned_probs[OFFSET(0)].prob as probability_returnedFROMML.PREDICT(MODEL bqmlga4.churn_logreg,(SELECT * FROM bqmlga4.train)) #can be replaced with a proper test dataset
Utilize predictions for activation
Once the model predictions are available for your users, you can activate this insight in different ways. In our analysis, we used user_pseudo_id as the user identifier. However, ideally, your app should send back the user_id from your app to Google Analytics. In addition to using first-party data for model predictions, this will also let you join back the predictions from the model into your own data.
- You can import the model predictions back into Google Analytics as a user attribute. This can be done using the Data Import feature for Google Analytics 4. Based on the prediction values you can Create and edit audiences and also do Audience targeting. For example, an audience can be users with prediction probability between 0.4 and 0.7, to represent users who are predicted to be “on the fence” between churning and returning.
- For Firebase Apps, you can use the Import segments feature. You can tailor user experience by targeting your identified users through Firebase services such as Remote Config, Cloud Messaging, and In-App Messaging. This will involve importing the segment data from BigQuery into Firebase. After that you can send notifications to the users, configure the app for them, or follow the user journeys across devices.
- Run targeted marketing campaigns via CRMs like Salesforce, e.g. send out reminder emails.
You can find all of the code used in this blogpost in the Github repository:
What’s next?
Continuous model evaluation and re-training
As you collect more data from your users, you may want to regularly evaluate your model on fresh data and re-train the model if you notice that the model quality is decaying.
Continuous evaluation—the process of ensuring a production machine learning model is still performing well on new data—is an essential part in any ML workflow. Performing continuous evaluation can help you catch model drift, a phenomenon that occurs when the data used to train your model no longer reflects the current environment.
To learn more about how to do continuous model evaluation and re-train models, you can read the blogpost: Continuous model evaluation with BigQuery ML, Stored Procedures, and Cloud Scheduler
More resources
If you’d like to learn more about any of the topics covered in this post, check out these resources:
- BigQuery export of Google Analytics data
- BigQuery ML quickstart
- Events automatically collected by Google Analytics 4
- Qwiklabs: Create ML models with BigQuery ML
Or learn more about how you can use BigQuery ML to easily build other machine learning solutions:
- How to build demand forecasting models with BigQuery ML
- How to build a recommendation system on e-commerce data using BigQuery ML
Let us know what you thought of this post, and if you have topics you’d like to see covered in the future! You can find us on Twitter at @polonglin and @_mkazi_.Thanks to reviewers: Abhishek Kashyap, Breen Baker, David Sabater Dinter.
Insurer Uses Google Cloud AI to Battle Slow Growth: It Improves Sales by 5% in 8 Weeks

8842
Of your peers have already read this article.
7:30 Minutes
The most insightful time you'll spend today!
For a business to succeed in the long term, it needs to learn not just to adapt to inevitable change, but to harness it. South Africa-based PPS has been an insurance company since 1941 and today is the biggest mutual insurance provider in the country.
As a mutual company, PPS is owned by more than 200,000 members, making them shareholders. In recent years, PPS and other companies like it have been affected by a number of external factors.
“For one thing, technology platforms have brought in a new gig economy that has all kinds of implications for insurance,” says Avsharn Bachoo, CTO at PPS. “What we’ve been seeing is basically a disruption of the South African insurance industry. We chose to see that as an opportunity.”
“Our servers were at the end of their life cycle and we had to decide whether to refresh them or switch completely. To embrace the world of AI and machine learning effectively, we knew we needed a cloud-based infrastructure. We’ve found the answer in Google Cloud Platform.”
—Avsharn Bachoo, CTO, PPS
In early 2018, faced with an uncertain economic environment that was squeezing growth and profitability, PPS decided to transform itself from a traditional broker-based business into a digital insurance provider. A key pillar of this new strategy was to overhaul the company’s technology infrastructure. To turn the strategy into reality, Avsharn and his team chose Google Cloud Platform (GCP).
“Our servers were at the end of their life cycle and we had to decide whether to refresh them or switch completely,” says Avsharn. “To embrace the world of AI and machine learning (ML) effectively, we knew we needed a cloud-based infrastructure. We’ve found the answer in Google Cloud Platform.”
Power, speed, flexibility with Google Cloud Platform
Previously, PPS maintained an on-premises IT infrastructure, which worked for its traditional business but was unsuited for its new way of working. In early 2018, the company started working on new products for its members but this required large amounts of compute power that proved prohibitively expensive with on-premises servers. Even existing products were starting to require more than the infrastructure could deliver. Aging equipment meant that it’s testing and quality assurance environments bore little resemblance to the actual production environment.
“We had no pre-production environments at all,” says Avsharn, resulting in more work for developers after products had been released. Meanwhile, the capital required to buy and configure more servers for new projects meant fewer resources available for innovation, and left the company less able to react to changes in the market. PPS knew it had to find a cloud-based alternative.
Shortly after devising a new digital strategy, PPS engineers attended a training session on cloud infrastructure given by leading South African Google Cloud Partner Siatik. Impressed with the presentation, PPS engaged Siatik to help run a proof of concept for a cloud-based infrastructure, running on GCP. With on-site engineers and constant communication, Siatik formed a very close working relationship with PPS. “The team at Siatik was exemplary,” recalls Avsharn. “They were well-organized, with cutting-edge technical acumen and very creative solutions to our problems. They were real game-changers.”
“We wanted the platform to retrain its models in response to new data and improve its recommendations with more information. Normally this would be a manual process but Google Cloud ML Engine lets the models do this automatically.”
—Kimoon Kim, Lead Solution Architect and Data Engineer, Siatik
The proof of concept was successful, with GCP outperforming the existing infrastructure in terms of how it handled compute demands, databases, and storage.
“It’s the speed of GCP that really impresses us,” says Avsharn. PPS saw that GCP wasn’t just an opportunity to migrate its existing infrastructure to the cloud. With Siatik’s help, it redesigned its monolithic core architecture to one based around microservices using Google Kubernetes Engine (GKE). For data processing and storage, Cloud Dataflow and Cloud Datastore proved invaluable, while Stackdriver helped the IT team stay on top of logging and monitoring the system.
“Google Cloud makes migrations very easy,” says Brett St. Clair, CEO at Siatik. “It takes care of all the hard work with configurations and replications, so when we switch the machines on, everything is ready and working.”
The ease with which PPS migrated to GCP means that it can now tackle strategic goals much more quickly than before. The most ambitious of these is an AI-powered product recommendation platform. Information is collected from customers who opt in at a defined point in their journey, this database is queried using BigQuery, and the information is fed into the platform. The AI model then calculates the most appropriate products for each member, according to their personal history.
“Most of the product recommendation engines out there are based on clustering, where you’re offered products based on your peer groups,” explains Avsharn. “For the first time, we can make recommendations to members based on their individual preferences and historical behavior. That’s really powerful for us.”
Siatik helped PPS use TensorFlow and Cloud Machine Learning Engine to build the AI platform. For the engineers, these easy-to-use tools helped speed up the process considerably, allowing them to host the models locally without any fuss. Previously, it took one to three months to manually build the model and match an offer to a customer. With the AI platform, a match takes just a few minutes. Cloud ML Engine, in particular, helped the platform adapt to new information on the fly and easily make adjustments to its hyperparameters, that is, preset variables which define the model-training process.
“We wanted the platform to retrain its models in response to new data and improve its recommendations with more information,” says Kimoon Kim, Lead Solution Architect and Data Engineer at Siatik. “Normally this would be a manual process but Google Cloud ML Engine lets the models do this automatically.”
“Google Cloud helped us cancel out a lot of the noise around machine learning and AI. We don’t have to build new complicated algorithms or hire huge teams of data scientists to benefit. We just bring our data and use the right tools to focus on what’s really important.”
—Avsharn Bachoo, CTO, PPS
Harnessing artificial intelligence for real-world results
PPS deployed its new AI recommendation platform in December, 2018. Just a couple of months later, its impact was clear. “In around eight weeks, we saw a 5 percent growth in sales,” says Avsharn. “It’s been a direct result of building our recommendation platform with Google Cloud. We can offer the right products to the right members.”
For developers and engineers at PPS, working with Google Cloud gives them access to high performance technology and automation options with GKE. As a result, the infrastructure runs 70 percent faster than before with fewer cores and less memory. Developers can also work in mature testing environments, and for the first time, are able to build pre-production environments, leading to better quality products. More strategically, moving to a serverless, cloud-based infrastructure has helped PPS take control of its budget, moving away from intermittent, large capital spends to more manageable, project-to-project flows of operational expenditure. The company expects to see savings of around 50 percent, or $695,000.
“We have a lot more flexibility with our resources thanks to Google Cloud,” says Avsharn. “When we have a new idea, we don’t have to outlay new capital such as servers before we can even start working on it. We just spin up instances when we want and spin them back down when we’re done.”
With the AI platform deployed and working well, PPS is already looking at ways to improve it, including real-time updates and further automation. Soon, the company will integrate the platform with more sales campaigns for more effective targeting to boost sales even further. Meanwhile, it’s also experimenting with machine learning to spot patterns in data at scale for fraud analytics and risk assessment.
For PPS, working with Google Cloud has helped it transform quickly and effectively from disrupted to disruptor. The company is now looking to gain the same transformative effects by implementing G Suite for increased productivity and collaboration.
“Google Cloud helped us cancel out a lot of the noise around machine learning and AI,” says Avsharn. “We don’t have to build new complicated algorithms or hire huge teams of data scientists to benefit. We just bring our data and use the right tools to focus on what’s really important.”
More Relevant Stories for Your Company

Connected Data is the Lifeblood of Today’s Retailers: IDC’s 2022 Research
For a look ahead at the trends that will animate the retail industry this year, let’s take a look back at the 2022 National Retail Federation (NRF) "Big Show" in NYC. Attendees at January’s event were treated to tangible examples of how retail challenges are being solved today, including new

Manhattan Associates and Google Cloud: How the Partnership Accelerates Future of Digital Retail
While the shift to digital business and the cloud has been well under way for some years now, organizations today have a new sense of urgency due to COVID-19. Delivering digital transformation is no longer a ‘nice to have’ option, rather, it is an operational imperative. Taking advantage of the

SevenRooms: Building a profitable, sustainable future in food and beverage with Google Cloud
Finding ways to increase customer loyalty and profitability in a post-COVID world is top of mind for hotels, bars, and restaurants. Unfortunately, many food and beverage services providers struggle to deliver the personalized experiences that keep guests coming back for more. The reality is that most traditional hospitality apps offer




HSBC Looks to Google Cloud to Transform Banking
HSBC, a global bank that is a central part of global commerce with a presence in 67 countries, serving 38 million customers ranging from individuals to small businesses to corporations and governments, and having over $2.5 trillion assets in its balance sheet, had a vision of being a cloud first
