





5586
Of your peers have already watched this video.
1:20 Minutes
The most insightful time you'll spend today!
Nippon India Mutual Fund Re-Invents How Indians Buy with AI
Nippon India Mutual Fund, formerly Reliance Mutual Funds is changing the way Indians purchase funds making it easier and faster, with the help of Google Cloud.
In India, only 3-4 percent of the population has invested in mutual funds. There’s a sizeable market to tap into for mutual fund houses–if they can find ways to make it easier for first-time investors to take the plunge.
As the leading retail asset management company in the country, Reliance Mutual Funds, decided to use voice to facilitate transactions.
“That would create a delightful experience for the investor,” says Arpan Saha, Head of Digital Business, Nippon India Mutual Fund.
That’s exactly what the company did using the Google Cloud Platform.
Today, the company has over 10,000 interactions using the Google AI Platform.
“Today we see more consumer coming and doing more transactions with us, and we only see this going up as we make this experience razor-sharp,” says Saha.
Dataflow Guarantees 50+% Increase in Developer Productivity and Infrastructure Cost Savings: Read More

8397
Of your peers have already read this article.
3:00 Minutes
The most insightful time you'll spend today!
In our conversations with technology leaders about data-driven transformation using Google Data Cloud – industry’s leading unified data and AI solution – , one important topic is incorporating continuous intelligence to move from answering questions such as “What has happened? to questions like “What is happening?” and “What might happen?”. The core to this evolution is the need for an underlying data processing that not only provides powerful real-time capabilities for events happening close to origination, but also brings together existing data sources under one unified data platform to enable organizations to draw insights and take actions holistically. Dataflow, Google’s cloud-native data processing and streaming analytics platform, is a key component of any modern data and AI architecture and data transformation journey, along with BigQuery, Google’s internet-scale warehouse with built-in streaming, BI engine and ML; Pub/Sub, a global no-ops event delivery service; and Looker, a modern BI and embedded analytics platform. One of the key evaluation factors is potential economic value of Dataflow to their organization, particularly in the context of engaging other stakeholders is key for many of the leaders that we engage with. So we commissioned Forrester Consulting to conduct a comprehensive study on the impact that Dataflow had on their organization by interviewing actual customers .
Today we’re excited to share our commissioned study conducted by Forrester Consulting, the Total Economic Impact™ of Google Cloud Dataflow, which allows data leaders to understand and quantify the benefits of Dataflow, and use cases it enables. Forrester conducted interviews with Dataflow customers to evaluate the benefits, costs, and risks of investing in Dataflow across an organization. Based on their interviews, Forrester identified major financial benefits across four different areas: business growth, infrastructure cost savings, data engineer productivity, and administration efficiency. In fact, Forrester found that customers adopting Dataflow can achieve a 55% boost in developer productivity and a 50% reduction in infrastructure costs. In fact, Forrester projects that customers adopting Dataflow can achieve a range of up to 171% Return on Investment (ROI) and a less than six months payback period. Customers can now use figures in the report to compute their own Return on Investment (ROI) and payback period.
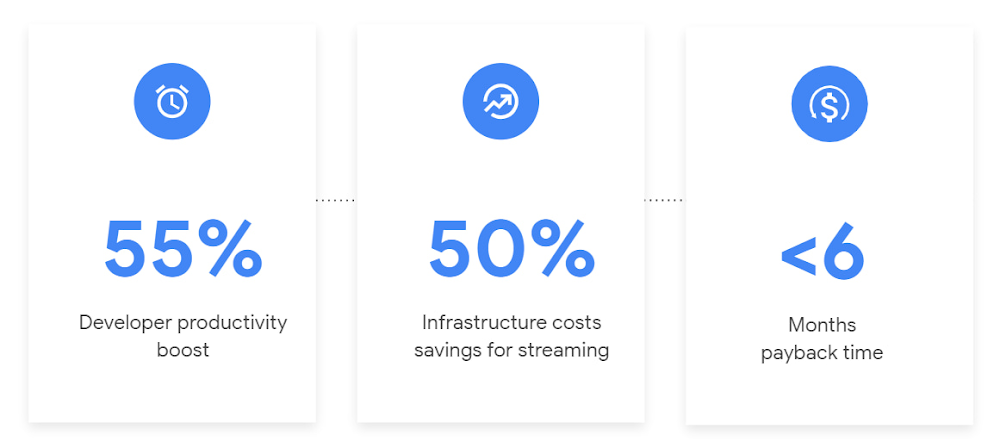
“Dataflow is integral to accelerating time-to-market, decreasing time-to-production, reducing time to figure out how to use data for use cases, focusing time on value-add tasks, streamlining ingestion, and reducing total cost of ownership.” – Lead technical architect, CPG
Let’s take a deeper look at the ways that Forrester found that Dataflow can help you achieve your goals and unlock your business potential.
Benefit #1: Increase data engineer productivity by 55%
Developers can choose among a variety of programming languages to define and execute data workflows. Dataflow also seamlessly integrates with other Google Cloud Platform and open source technologies to maximize value and applicability to a wide variety of use cases. Dataflow streamlined workflows with code reusability,dynamic templates, and the simplicity of a managed service. Engineers trusted pipelines to run correctly and adhere to governance. Data engineers avoided laborious issue-monitoring and remediation tasks that were common in the legacy environments such as poor performance, lack of availability, and failed jobs. Teams valued the language flexibility and open source base.
“Dataflow provided us with ETL replacement that opened limitless potential use cases and enabled us to do smarter data enhancement while data remains in motion.” — Director of data projects, financial services
Benefit #2: Reduce infrastructure costs by up-to 50% for batch and streaming workloads
Dataflow’s serverless autoscaling and discrete control of job needs, scheduling, and regions eliminated overhead and optimized technology spending. Consolidating global data processing solutions to Dataflow further eliminated excess costs while ensuring performance, resilience, and governance across environments. Dataflow’s unified streaming and batch data platform gives organizations the flexibility to define either workload in the same programming model, run it on the same infrastructure, and manage it from a single operational management tool.
“Our costs with our cloud data platform using Dataflow are just a fraction of the costs we faced before. Now we only pay for cloud infrastructure consumption because the open source base helps us avoid licensing costs. We spend about $120,000 per year with Dataflow, but we’d be spending millions with our old technologies.” – Lead technical architect, CPG
Benefit #3: Increase top-line revenue by improving customer experience and retention with payback time of < 6 months
Streaming analytics is an essential capability in today’s digital world to gain real-time actionable insights. Likewise, organizations must also have flexible, high- performance batch environments to analyze historical data for building machine learning models, business intelligence, and advanced analytics. Dataflow enabled real-time streaming use cases, improved data enrichment, encouraged data exploration,improved performance and resiliency, reduced errors, increased trust, and eliminated barriers to scale. As a result, organizations provided customers with more accurate, relevant, and in-the-moment data-backed services and insights — boosting customer experience, creating new revenue streams, and improving acquisition, retention, and enrichment.
“It’s already been proven that we are getting more business [with Dataflow] because we can turn around results faster for customers.” – VP of technology, financial services technology
“When we provide data to our customers and partners with Dataflow, we are much more confident in those numbers and can provide accurate data within a minute. Our customers and partners have taken note and commented on this. It’s reduced complaints and prevented churn.” – Senior software engineer, media
Other benefits
Eliminated administrative overhead and toil
As a cloud-native managed service, all administration tasks such as provisioning, scaling, and updates are automatically handled by Google Cloud. Teams no longer need to manage servers and related software for legacy data processing solutions. Admins also streamlined processes for setting up data sources, adding pipelines, and enforcing governance.
Saved business operations costs for support teams and data end users
Dataflow improved the speed, quality, reliability, and ease of access to data for insights for general business users, saving time and empowering users to drive better data-backed outcomes. It also reduced support inquiry volume while automating manual job creation.
What’s next?
Download the Forrester Total Economic Impact study today to dive deep into the economic impact Dataflow can deliver your organization. We would love to partner with you to explore the potential Dataflow can unlock in your teams. Please reach out to our sales team to start a conversation about your data transformation with Google Cloud.
Google’s Latest ‘Carbon Footprint’ can Flag Users about Carbon Emission Levels from their Cloud Usage

7089
Of your peers have already read this article.
4:00 Minutes
The most insightful time you'll spend today!
Google Cloud is proud to support our customers with the cleanest cloud in the industry. For the past four years, we’ve matched 100% of our electricity use with renewable energy purchases, and we were the first company of our size to commit going even further by running on carbon-free energy 24/7 by 2030. As we work to achieve 24/7 carbon-free energy, we help you take immediate action to decarbonize your digital applications and infrastructure. We’re also working with our customers across every industry to develop new solutions for the unique climate change challenges that organizations face. Today, we’re excited to expand our portfolio of carbon-free solutions and announce new partnerships that will help every company build a more sustainable future.
First, we’re launching Carbon Footprint, a new product that provides customers with the gross carbon emissions associated with their Google Cloud Platform usage. Now available to every GCP user for free in the Cloud Console, this tool helps you measure, track and report on the gross carbon emissions associated with the electricity of your cloud usage. Of course, the net operational emissions associated with your Google Cloud usage is still zero. With growing requirements for Environmental Social and Governance (ESG) reporting, companies are looking for ways to show their employees, boards and customers their progress against climate targets. Using Carbon Footprint, you have access to the gross energy related emissions data you need for internal carbon inventories and external carbon disclosures, with one click.
Built in collaboration with customers like Atos, Etsy, HSBC, L’Oréal, Salesforce, Thoughtworks and Twitter, our Carbon Footprint reporting introduces a new standard of transparency to support you in meeting your climate goals. You can monitor your gross cloud emissions over time, by project, by product and by region, giving IT teams and developers metrics that can help them reduce their carbon footprint. Our detailed calculation methodology is published so that auditors and reporting teams can verify that their cloud emissions data meets GHG Protocol guidance.

“The power of knowledge combined with the power of technology innovation plays a vital role in proactively responding to the climate crisis we are facing. With Google Carbon Footprint reporting, Atos feeds emissions data in our Decarbonization Data Platform, demonstrating potential emissions reductions from the Google Cloud Platform to our customers. This reporting opens up new levels of emissions transparency, trajectory planning, and data insight to support our customers in meeting, and potentially accelerating towards, their climate goals.”—Nourdine Bihmane, Head of Decarbonization Business Line, Atos
“The capability to measure and understand the environmental footprint of our Public Cloud usage is among the key axis of our sustainable tech roadmap. With Google Cloud Carbon Footprint, we are now able to directly follow the impact of our sustainable infrastructure approach and architecture principles.”—Hervé DUMAS, Sustainability IT Director, L’Oreal
While digital infrastructure emissions are just one part of your environmental footprint, accurately accounting for IT carbon emissions is necessary to measure progress against the carbon reduction targets required to avert the worst consequences of climate change. To help you account for emissions beyond our cloud and across your organization, we’re excited to partner with Salesforce Sustainability Cloud, integrating our Google Cloud Platform emissions data into their carbon accounting platform.
“As we face unprecedented climate challenges, companies across the globe need to embed sustainability into the core of their business in order to meet growing customer and stakeholder expectations, and reduce their environmental impact. Together, Google Cloud and Salesforce Sustainability Cloud can help our joint customers accelerate their path to Net Zero, leveraging data-driven insights and visualizations to track and reduce their carbon emissions to drive sustainable change.”—Ari Alexander, GM of Salesforce Sustainability Cloud.
From information to action
With the gross energy-related emissions footprint of data associated with your Google Cloud usage now available, we’re committed to providing tools to not only measure your carbon footprint, but help you reduce it. We recently launched low-carbon region icons to help you choose cleaner regions to locate your Google Cloud resources. New users who see the icons are over 50% more likely to choose clean regions over others, ensuring their applications emit less carbon over time.
For current Google Cloud users, we’re pleased to announce that Active Assist Recommender will include a new sustainability impact category, extending its original core pillars of cost, performance, security, and manageability. Starting with the Unattended Project Recommender, you’ll soon be able to estimate the gross carbon emissions you’ll save by removing your idle resources. Unattended Project Recommender uses machine learning to identify, with a high degree of confidence, projects that are likely abandoned based on API and networking activity, billing, usage of cloud services, and other signals, and provides actionable recommendations on how to remediate those abandoned projects. By deleting these projects, not only can you reduce costs and mitigate security risks, but you can also reduce your carbon emissions. In August, Active Assist analyzed the aggregate data from all customers across our platform, and over 600,000 gross kgCo2e was associated with projects that it recommended for cleanup or reclamation. If customers deleted these projects they would significantly reduce future gross carbon emissions. Check out this blog to learn more about Active Assist.

Solutions for climate resilience
Many of our customers face difficult questions about how their business impacts the natural environment today, and how it will be affected by climate change in the future. Answering these questions requires rich datasets about the planet, better analytics tools and smarter models to predict potential outcomes. For over a decade Google Earth Engine has supported scientists and developers with hyperscale computing power and the world’s largest catalog of satellite image data. Today, we are delighted to announce the preview of Earth Engine as part of Google Cloud Platform. Now, you can access Earth Engine and combine it with other geospatial-enabled products like BigQuery. By extending Earth Engine’s powerful platform to enterprises through Google Cloud, we are bringing the best of Google together.
Over the past year we’ve worked with a number of organizations to use Earth Engine technology with tools like BigQuery and the Cloud AI Platform to develop new solutions for responsible commodity sourcing, sustainable land management and carbon emissions reduction. Earth Engine enables companies to track, monitor and predict changes in the Earth’s surface due to extreme weather events or human-caused activities, thus helping them save on operational costs, mitigate and better manage risks, and become more resilient to climate change threats. This new offering will wrap the unique data, insights and functionality of Earth Engine with a fully-managed, enterprise-grade experience and reliability.
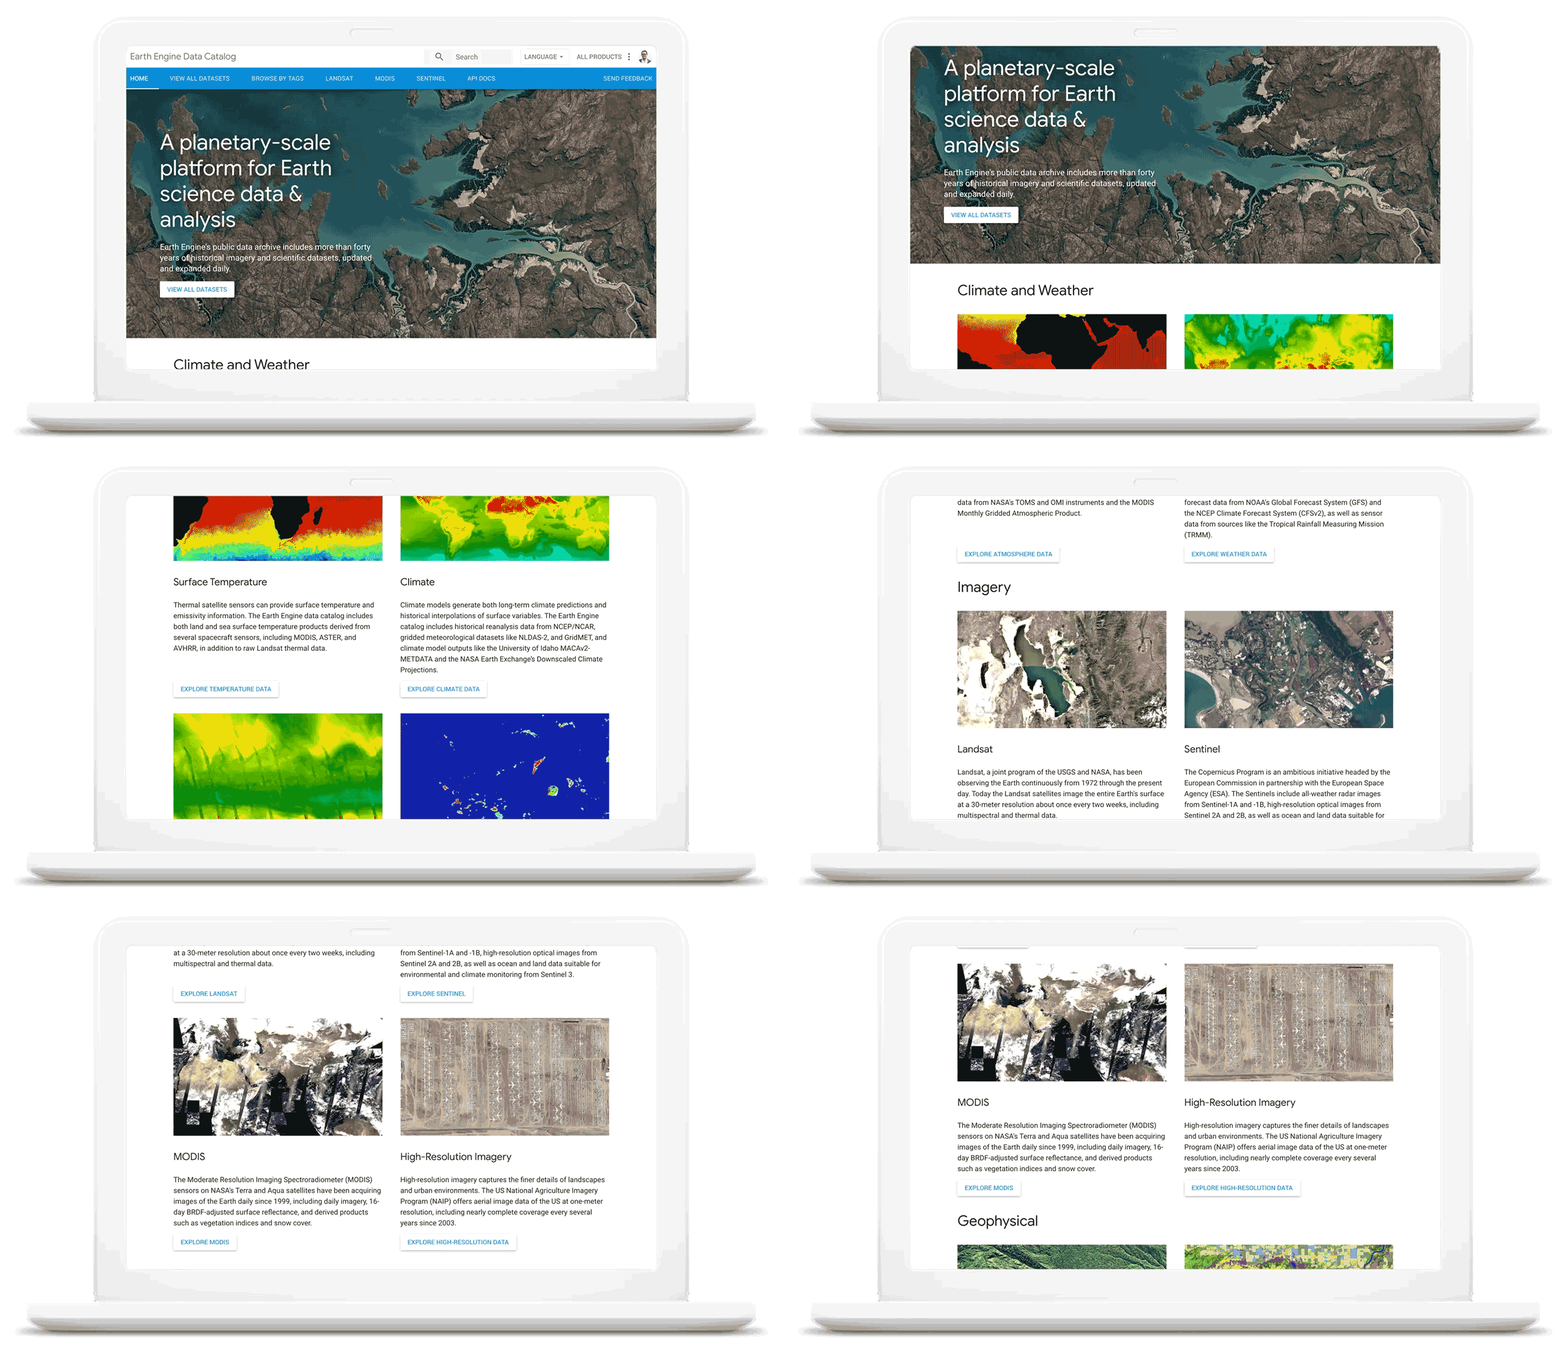
As we work with our customers to accelerate their sustainability initiatives, earth observation data is proving critical to effectively plan for the long-term impacts of climate change. To extend our geospatial and sustainability use cases we’re also expanding our partnerships with CARTO, Climate Engine, Geotab, NGIS, and Planet to bring their data and core applications to Google Cloud.
These partners will each make their existing platforms and datasets available globally on Google Cloud, giving you low-latency and reliable access to critical data and applications that will inform your sustainability initiatives. By integrating water availability, agricultural data, weather risks, and extensive daily satellite imagery into Earth Engine and BigQuery, you can achieve more ambitious goals for the sustainability of your business and our planet.
Committing to help you meet your climate goals
With each of these tools, we’re working to reduce the barriers you face in adopting more sustainable technology practices. We understand that building more sustainable applications and infrastructure is not easy. You face competing priorities, technical challenges, and the perception that climate action is costly.
It doesn’t have to be this way. Today, we are making a sustainability pledge to you: teams across Google Cloud are committing to eliminating the barriers you face in building a more sustainable digital future for your organization, and will help you take action today to realize your climate goals. We’ll do this in a number of ways:
- In digital transformation projects and workshops, sustainability teams will always have a seat at the planning table, so we can work together on using cloud technology to build a more sustainable future.
- We’re putting low-carbon signals natively into our products to help developers choose more sustainable options early in their application development.
- We’ll ensure carbon impact is measured consistently with other key performance indicators. Leveraging the social cost of carbon, the ROI models and value assessments you conduct with Google Cloud will project your emissions impact too.
- We’ll be transparent about our carbon impact, by publishing third-party reviewed reports and methodologies, so you can trust the data for your own reports and disclosures.
- We’ll continue to work with the industry on best practices, including educational resources like Sustainable IT – Decoded, a new masterclass created in partnership with Intel, that shares the expertise of sustainability thought leaders.
For the next decade we need to work together to avert the worst consequences of climate change. We’ve made tremendous progress in building technology that helps everyone do more for the planet, and we’re excited to see what you do with it. Visit this page to learn more about Google Cloud’s sustainability efforts.
How Notified Managed to Boost AI-driven, Dynamic Influencer Discovery and Classify its Content Using NLP

3006
Of your peers have already read this article.
2:00 Minutes
The most insightful time you'll spend today!
Notified is a leading communications cloud for events, public relations, and investor relations to drive meaningful insights and outcomes. They provide communications solutions to effectively reach and engage customers, investors, employees, and the media.
One of Notified’s Public Relations solutions is the ‘Media Contact Database’ that allows customers to discover media and influencers in a unique media database powered by AI and human-curated research.
The goal of the initiative is to expand the scope of the AI driven, dynamically discovered influencers, and analyze online news articles using AI/ML technologies to extract entities and classify content. The prior process to extract insights from news articles provided only 30-40% of the desired results, and there were accuracy and stability issues that resulted in a lot of manual intervention.
Journalist Beat
A key outcome of the AI driven process is to identify the ‘Journalist Beat’. A Journalist Beat essentially summarizes the individual’s area of focus such as a sports writer, financial journalist etc.
Three options were evaluated for the AI/ML process to generate the Journalist Beats :
Option 1: Topic ML
Unsupervised ML approach to determine the commonly used terms.
- Pro: Common approach to grouping documents and determine similar text
- Con: Unbounded list of text
Option 2: ML Classification
Build classification models (supervised) to map reference articles to ‘Beats’
- Pro: Aligns to ‘Research Analytics’ existing processes
- Con: Time to build and maintain ML models for hundreds of beats.
Option 3: GCP Context Classification
Leverage GCP’s Natural Language API for initial classification and as input to Notified single model
- Pro: Aligns to ‘Research Analytics’ without building ML models.
Ultimately the GCP Natural Language API solution was chosen because of the speed of execution and a high level of accuracy with the pretrained models. The Notified team was able to launch the product feature within a few weeks, without ever needing to do extensive data collection and train the models.
Here is the high level process that was implemented for Journalist Beats.
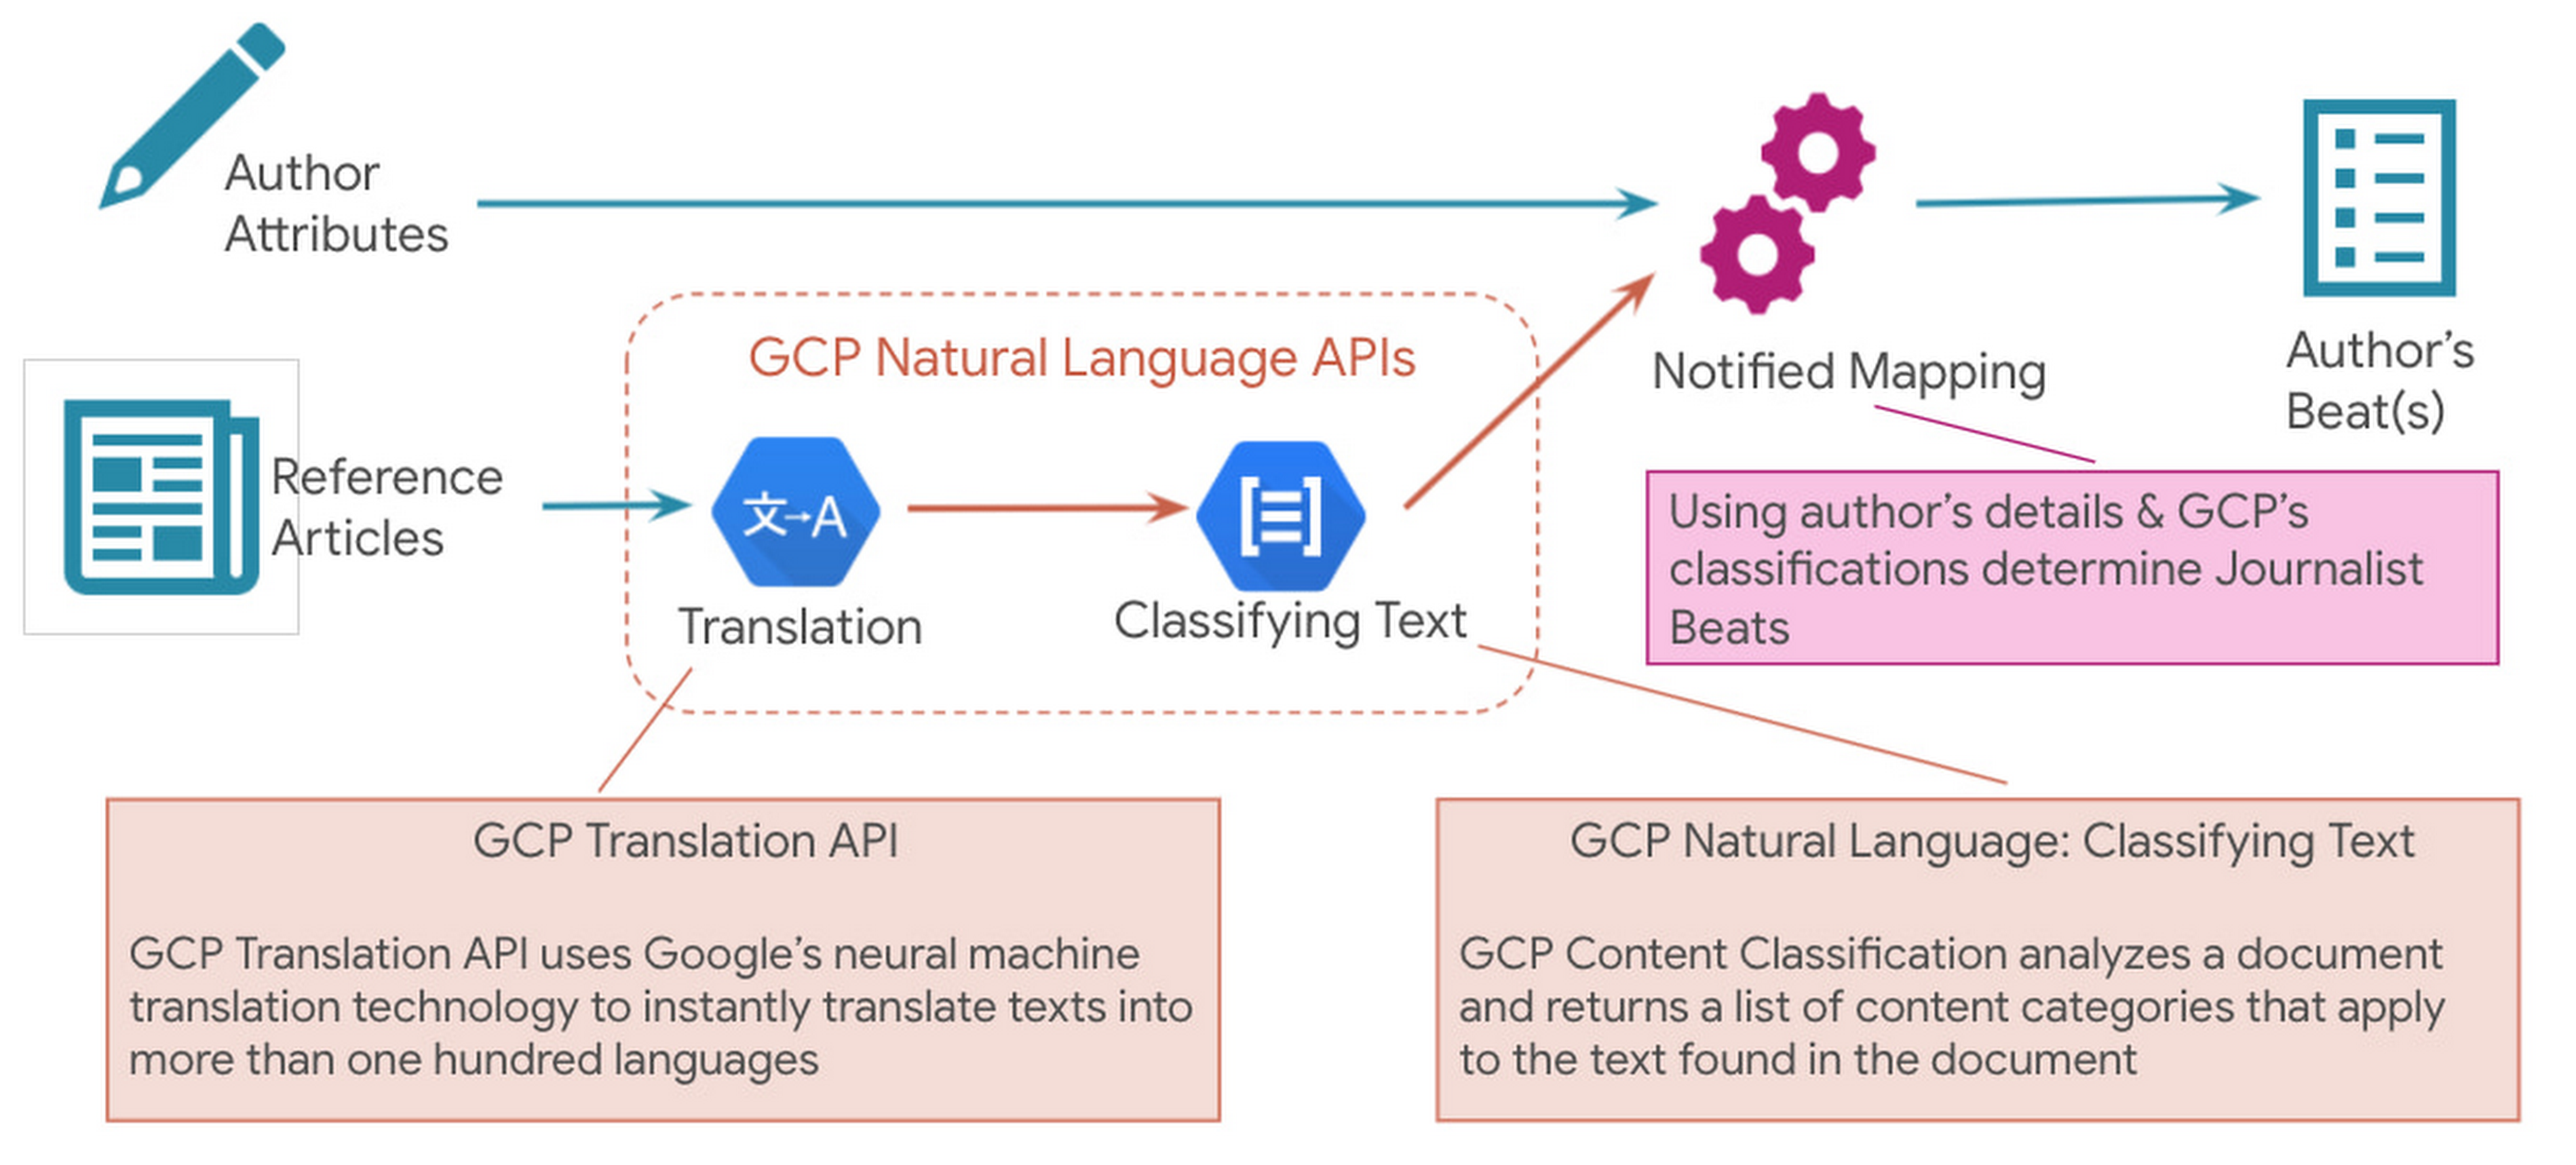
Since Notified supports curated media contacts globally, news articles were instantly translated to English using GCP Translation API. GCP Natural Language API’s solution to classify text was used to analyze the translated text and generate the list of content categories.
Solution Architecture
Here is a sample solution architecture for the ‘Discovered Journalist’ process.

Three core principles guided the above architecture – Serverless & Fully Managed, Scalability & Elasticity for flexibility and to optimize costs, API led real-time processing.
In addition to the GCP Natural Language API and Translation API below are a few serverless GCP products that were part of the automated solution:
- BigQuery is Google Cloud’s fully managed, petabyte-scale, and cost-effective analytics data warehouse that lets you run analytics over vast amounts of data in near real time.
- Cloud Run is a fully managed serverless platform that can be used to develop and deploy highly scalable containerized applications.
- Cloud Tasks is a fully managed service that allows you to manage the execution, dispatch, and delivery of a large number of distributed tasks.
The powerful pre-trained models of the Natural Language API provide a comprehensive set of features to apply natural language understanding to applications such as sentiment analysis, entity analysis, entity sentiment analysis, content classification, and syntax analysis.
Notified looks ahead to super-scaling
In an effort to even further improve its best in class ‘Media Contact Database’, Notified looks to super scale the above AI driven Influencer Discovery process to the order of 100+ million news articles per month. It plans to expand the scope of entities extracted from the news articles and provide a news exploration service for its customers by performing intelligent entity-based searches.To watch your markets evolve, see how competitors add AI insights. To actually stay in the market, make AI the main driver of your product road maps. GCP Natural Language API accelerated our ability to adopt AI at scale.
Thomas Squeo, CTO, Notified
Acknowledgments
We’d like to thank our collaborators at Google and Notified for making this blog post possible. Thanks to Arpit Agrawal at MediaAgility for contributing to this blog post.
To learn more about how Google Cloud Natural Language AI can help your enterprise, try out an interactive demo and take the next step, visit the product overview page here.
The Future of Language Processing: Google Cloud’s Enhanced NLP Models

1343
Of your peers have already read this article.
1:30 Minutes
The most insightful time you'll spend today!
Natural language understanding (NLU) is getting increasingly better at solving complex problems and these language breakthroughs are creating big waves in Artificial Intelligence. For example, new language models are enabling Everyday Robots to create more helpful robots that can break down user instructions and have even enabled people to generate imaginative visuals from complex text prompts.
These leaps in NLU are powered by neural networks trained to understand human language. This technology has greatly advanced since the introduction of Google’s Transformer architecture in 2017 with the introduction of large models trained on massive amounts of data like GPT-3 and, even more recently, with GLaM, LaMDA, and PaLM. This latest generation of models are called Large Language Models (LLMs) because of their sheer size and the vast volumes of data on which they are trained, and they can be applied to a range of tasks to create more powerful digital assistants, generate better search results and product recommendations, enforce smarter platform curation and safety features, and much more.
For these reasons, we’re pleased to announce we’ve updated the Google Cloud Natural Language (NL) API with a new LLM-based model for Content Classification.
With an expansive pre-trained classification taxonomy, the newest version of Content Classification from the Natural Language API leverages the latest Google research to improve customer use cases spanning actionable insights on user trends, to ad targeting, to content-based filtering. In this article, we’ll explore the NL API’s new capabilities, which are the first of many efforts we’ll be making to bring the power of LLMs to Google Cloud.
How LLMs help machines understand human language
As Google Cloud VP and General Manager of AI and Industry Solutions, Andrew Moore has argued, if computer systems become more conversant with natural human languages, they become a foundation for more sophisticated use cases, able to not only understand user intent but also create complex bespoke solutions. Google has been a leading research force in this space, with LLM projects like LaMDA, PaLM and T5 contributing to the Cloud NL API’s improved v2 classification model.
Parsing language is a difficult AI task for machines due in part to the contextual and individual interpretation of words or phrases. The word “server,” for example, could refer to a computer, a restaurant employee, or a tennis player. To understand the word, a model needs to be trained around not only a basic definition but also the context and positioning of the word within a sentence or conversation and its evolving connotations. Because they process voluminous training data via Transformers, LLMs are well-suited to this type of work.
Thanks to the integration of Google’s latest language modeling technology, and an updated and expanded training data set, the next generation of the Content Classification API not only has over 1,000 labels (up from around 600 previously), but now also supports 11 languages (with Chinese, French, German, Italian, Japanese, Korean, Portuguese, Russia, Spanish, and Dutch joining previously-available English)—and does so with improved accuracy.
AI raises questions about the best way to build fairness, interpretability, privacy, and security into these new systems in order to benefit people and society. At Google, we prioritize the responsible development of AI and take steps to offer products where a responsible approach is built in by design. For Content Classification, we limited use of sensitive labels and conducted performance evaluations. See our Responsible AI page for more information about our commitments to responsible innovation.
Get Started
Today’s announcement is just the first step in bringing LLM capabilities to Google Cloud AI products, and we’re excited to see how our more powerful Natural Language API helps developers, analysts and data scientists generate insights and offer superior experiences. Our early adopters are implementing the API to improve user recommendations, display ad targeting, and insights about new trends.
If you’re ready to get started with this major leap in Google Cloud language services, visit our NL API documentation, and to learn more about Google Cloud’s AI services, visit our AI and machine learning products page.
Make Meaningful Analysis with Geo Boundary Public Datasets on BigQuery

6348
Of your peers have already read this article.
4:00 Minutes
The most insightful time you'll spend today!
Geospatial data is a critical component for a comprehensive analytics strategy. Whether you are trying to visualize data using geospatial parameters or do deeper analysis or modeling on customer distribution or proximity, most organizations have some type of geospatial data they would like to use – whether it be customer zipcodes, store locations, or shipping addresses. However, converting geographic data into the correct format for analysis and aggregation at different levels can be difficult. In this post, we’ll walk through some examples of how you can leverage the Google Cloud platform alongside Google Cloud Public Datasets to perform robust analytics on geographic data. The full queries can be accessed from this notebook here.
Public US Geo Boundaries dataset
BigQuery hosts a slew of public datasets for you to access and integrate into your analytics. Google pays for the storage of these datasets and provides public access to the data via the bigquery-public-data project. You only pay for queries against the data. Plus, the first 1 TB per month is free! These public datasets are valuable on their own, but when joined against your own data they can unlock new analytics use cases and save the team a lot of time.
Within the Google Cloud Public Datasets Program there are several geographic datasets. Here, we’ll work with the geo_us_boundaries dataset, which contains a set of tables that have the boundaries of different geospatial areas as polygons and coordinates based on the center point (GEOGRAPHY column type in BigQuery), published by the US Census Bureau.

Mapping geospatial points to hierarchical areas
Many times you will find yourself in situations where you have a string representing an address. However, most tools require lat/long coordinates to actually plot points. Using the Google Maps Geocoding API we can convert an address into a lat/long and then store the results in the BigQuery table.
With a lat/long representation of our point, we can join our initial dataset back onto any of the tables here using the ST_WITHIN function. This allows us to check and see if a point is within the specified polygon.
ST_WITHIN(geography_1, geography_2)
This can be helpful for ensuring standard nomenclature; for example, metropolitan areas that might be named differently. The query below maps each customers’ address to a given metropolitan area name.
SELECTcust.id as customer_id,metro.name as metro_nameFROM `looker-private-demo.retail.customers` as cust,`bigquery-public-data.geo_us_boundaries.metropolitan_divisions` as metroWHERE ST_WITHIN(ST_GEOGPOINT(cust.longitude, cust.latitude),metro.metdiv_geom)
It can also be useful for converting to designated market area (DMA), which is often used in creating targeted digital marketing campaigns.
SELECTcust.id as customer_id,dma.dma_nameFROM `looker-private-demo.retail.customers` as cust,`bigquery-public-data.geo_us_boundaries.designated_market_area` as dmaWHERE ST_WITHIN(ST_GEOGPOINT(cust.longitude, cust.latitude),dma.dma_geom)
Or for filling in missing information; for example, some addresses may be missing zip code which results in incorrect calculations when aggregating up to the zipcode level. By joining onto the zip_codes table we can ensure all coordinates are mapped appropriately and aggregate up from there.
SELECTzip.zip_code,count(distinct cust.id) as unique_customersFROM `looker-private-demo.retail.customers` as cust,`bigquery-public-data.geo_us_boundaries.zip_codes` as zipWHERE ST_WITHIN(ST_GEOGPOINT(cust.longitude, cust.latitude),zip.zip_code_geom)GROUP BY 1
Note that the zip code table isn’t a comprehensive list of all US zip codes, they are zip code tabulation areas (ZCTAs). Details about the differences can be found here. Additionally, the zip code table gives us hierarchical information, which allows us to perform more meaningful analytics. One example is leveraging hierarchical drilling in Looker. I can aggregate my total sales up to the country level, and then drill down to state, city and zipcode to identify where sales are highest. You can also use the BigQuery GeoViz tool to visualize geospatial data!

Aside from simply checking if a point is within an area, we can also use ST_DISTANCE to do something like find the closest city using the centerpoint for the metropolitan area table.
SELECTcust.id as customer_id,ARRAY_AGG(metro.name order by ST_DISTANCE(ST_GEOGPOINT(cust.longitude, cust.latitude),metro.internal_point_geom) asc limit 1)[offset(0)] as metro_nameFROM`looker-private-demo.retail.customers` as cust,`bigquery-public-data.geo_us_boundaries.metropolitan_divisions` as metroGROUP BY cust.id
This concept doesn’t just hold true for points, we can also leverage other GIS functions to see if a geospatial area is contained within areas that are listed in the boundaries datasets. If your data comes into BigQuery as a GeoJSON string, we can convert it to a GEOGRAPHY type using the ST_GEOGFROMGEOJSON function. Once our data is in a GEOGRAPHY type we can do things like check to see what urban area the geo is within – using either ST_WITHIN or ST_INTERSECTS to account for partial coverage. Here, I am using the customer’s zip code to find all metropolitan divisions where the zip code polygon and the metropolitan polygon intersect. I am then selecting the metropolitan area that has the most overlap (or the intersection has the largest area) to be the customer’s metro that we use for reporting.
SELECTcust.id as customer_id,ARRAY_AGG(metro.name order by ST_AREA(ST_INTERSECTION(zip.zip_code_geom,metro.metdiv_geom)) desc limit 1)[offset(0)] as metro_nameFROM`looker-private-demo.retail.customers` as custJOIN `bigquery-public-data.geo_us_boundaries.zip_codes` as zip on cust.zip=zip.zip_code,`bigquery-public-data.geo_us_boundaries.metropolitan_divisions` as metroWHERE ST_INTERSECTS(zip.zip_code_geom,metro.metdiv_geom)GROUP BY cust.id
The same ideas can be applied to the other tables in the dataset including the county, urban areas and National Weather Service forecast regions (which can also be useful if you want to join your datasets onto weather data).
Correcting for data discrepancy
One problem that we may run into when working with geospatial data is that different data sources may have different representations of the same information. For example, you might have one system that records state as a two letter abbreviation and another using the full name. Here, we can use the state table to join the different datasets.
SELECTst.state_name,sum(ab.sales+fn.sales) as total_salesFROM `bigquery-public-data.geo_us_boundaries.states` as stLEFT JOIN abbreviated_table as ab on ab.state = st.stateLEFT JOIN fullname_table as fn on fn.state = st.state_nameWHERE COALESCE(ab.state, fn.state) IS NOT NULLGROUP BY 1
Another example might be using the tables as a source of truth for fuzzy matching. If the address is a manually entered field somewhere in your application, there is a good chance that things will be misspelled. Different representations of the same name may prevent tables from joining with each other or lead to duplicate entries when performing aggregations. Here, I use a simple Soundex algorithm to generate a code for each county name, using helper functions from this blog post. We can see that even though some are misspelled they have the same Soundex code.

Next, we can join back onto our counties table so we make sure to use the correct spelling of the county name. Then, we can simply aggregate our data for more accurate reporting.
SELECTc.county_name,sum(sales) as total_salesFROMtableJOIN `bigquery-public-data.geo_us_boundaries.counties` as con testing.dq_fm_Soundex(table.county) = testing.dq_fm_Soundex(c.county_name)WHERE c.state_fips_code = cast(36 as string)GROUP BY 1
Note that fuzzy matching definitely isn’t perfect and you might need to try different methods or apply certain filters for it to work best depending on the specifics of your data.
The US Geo Boundary datasets allow you to perform meaningful geographic analysis without needing to worry about extracting, transforming or loading additional datasets into BigQuery. These datasets, along with all the other Google Cloud Public Datasets, will be available in the Analytics Hub. Please sign up for the Analytics Hub preview, which is scheduled to be available in the third quarter of 2021, by going to g.co/cloud/analytics-hub.
More Relevant Stories for Your Company

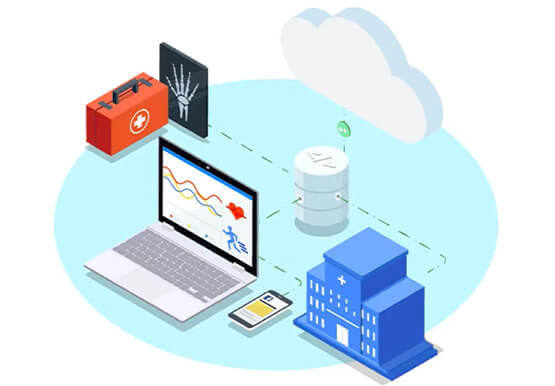

Hospitals Can Offer Interconnected Patient Experiences Using Google’s Natural Language Services
Machine Learning (ML) in healthcare helps extract data from conversations, medical records, forms, research reports, insurance claims and other documents across the care value-chain to help care providers have a holistic view of their patients to draw insights for diagnoses and treatments. With Natural Language Processing(NLP), healthcare organizations can program

Google Dataflow Named Leader in The 2021 Forrester Wave™: Streaming Analytics
We are excited to announce that Google has been named a Leader in The Forrester Wave™: Streaming Analytics, Q2 2021 report. Thank you to our strong community of customers and partners for working with us to deliver a customer focused product. We believe Forrester’s recognition is an acknowledgement of our leadership

Google’s Record-breaking Performance Tops the MLPerf Benchmark Results
The latest round of MLPerf benchmark results have been released, and Google's TPU v4 supercomputers demonstrated record-breaking performance at scale. This is a timely milestone since large-scale machine learning training has enabled many of the recent breakthroughs in AI, with the latest models encompassing billions or even trillions of parameters

Digital Maturity in Higher Ed Tied to Improvements in Students’ Journey: Study
Why Higher Ed Needs to Go All-in on Digital In the wake of the COVID-19 pandemic, the majority of students within the 18-24-year-old demographic now expect hybrid learning environments--even once we are beyond the pandemic. And a vast number of adult learners are seeking options that accommodate their work and
