





Simplifying Unstructured Data Analytics with BigQuery ML and Vertex AI: A Comprehensive Guide

1531
Of your peers have already read this article.
6:30 Minutes
The most insightful time you'll spend today!
Unstructured data such as images, speech and textual data can be notoriously difficult to manage, and even harder to analyze. The analysis of unstructured data includes use cases such as extracting text from images using OCR, sentiment analysis on customer reviews and simplifying translation for analytics. All of this data needs to be stored, managed and made available for machine learning.
The new BigQuery ML inference engine empowers practitioners to run inferences on unstructured data using pre-trained AI models. The results of these inferences can be analyzed to extract insights and improve decision making. This can all be done in BigQuery, using just a few lines of SQL.
In this blog, we’ll explore how the new BigQuery ML inference engine can be used to run inferences against unstructured data in BigQuery. We’ll demonstrate how to detect and translate text from movie poster images, and run sentiment analysis against movie reviews.
BigQuery ML’s new inference engine
Google Cloud is home to a suite of pre-trained AI models and APIs. The BigQuery ML inference engine can call these APIs and manage the responses on your behalf. All you have to do is define the model you want to use and run inferences against your data. All of this is done in BigQuery using SQL. The inference results are returned in JSON format and stored in BigQuery for analysis.
Why run your inferences in BigQuery?
Traditionally, working with AI models to run inferences required expertise in programming languages like Python. The ability to run inferences in BigQuery using just SQL can make generating insights from your data using AI simple and accessible. BigQuery is also serverless, so you can focus on analyzing your data without worrying about scalability and infrastructure.
The inference results are stored in BigQuery, which allows you to analyze your unstructured data immediately, without the need to move or copy your data. A key advantage here is that this analysis can also be joined with structured data stored in BigQuery, giving you the opportunity to deepen your insights. This can simplify data management and minimize the amount of data movement and duplication required.
Which models are supported?
For now, the BigQuery ML inference engine can be used with these pre-trained Vertex AI models:
- Vision AI API: This model can be used to extract features from images managed by BigQuery Object Tables and stored on Cloud Storage. For example, Vision AI can detect and classify objects, or read handwritten text.
- Translation AI API: This model can be used to translate text in BigQuery tables into over one hundred languages.
- Natural Language Processing API: This model can be used to derive meaning from textual data stored in BigQuery tables. For example, features like sentiment analysis can be used to determine whether the emotional tone of text is positive or negative.
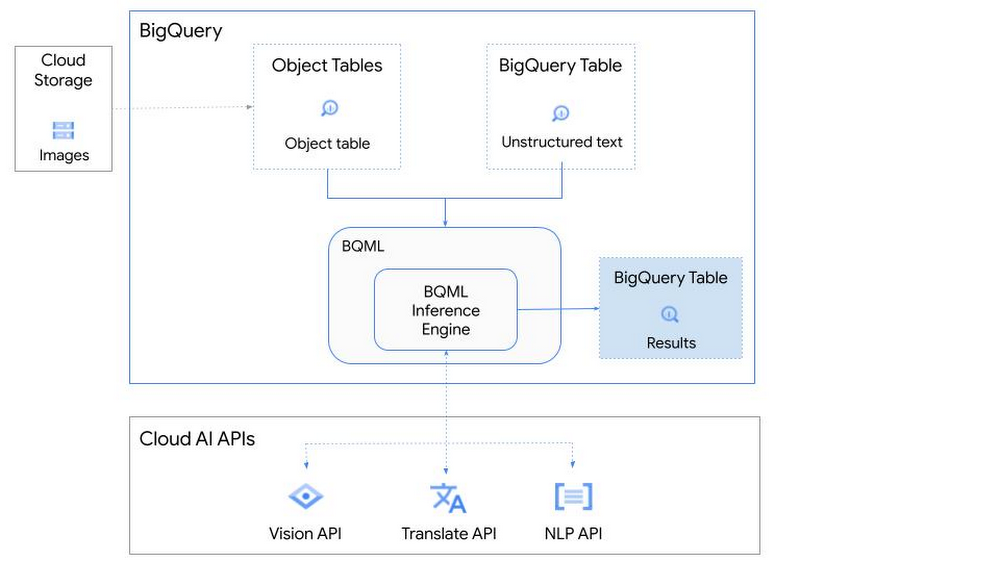
So, how does this work in practice? Let’s look at an example using images of movie posters

- We will define our pre-trained models for Vision AI, Translation AI and NLP AI in BigQuery ML.
- We’ll then use Vision AI to detect the text from some classic movie posters images.
- Next, we’ll use Translation AI to detect any foreign posters and translate them to a language of our choosing – English in this case.
- Finally, we’ll combine our unstructured data with structured data in BigQuery.
We’ll use the extracted movie titles from our movie posters to look up the viewer reviews from the BigQuery IMDB public dataset. We can then run sentiment analysis against these reviews using NLP AI.
Note: The BigQuery ML inference engine is currently in Preview. You will need to complete this enrollment form to have your project allowlisted for use with the BQML Inference Engine.
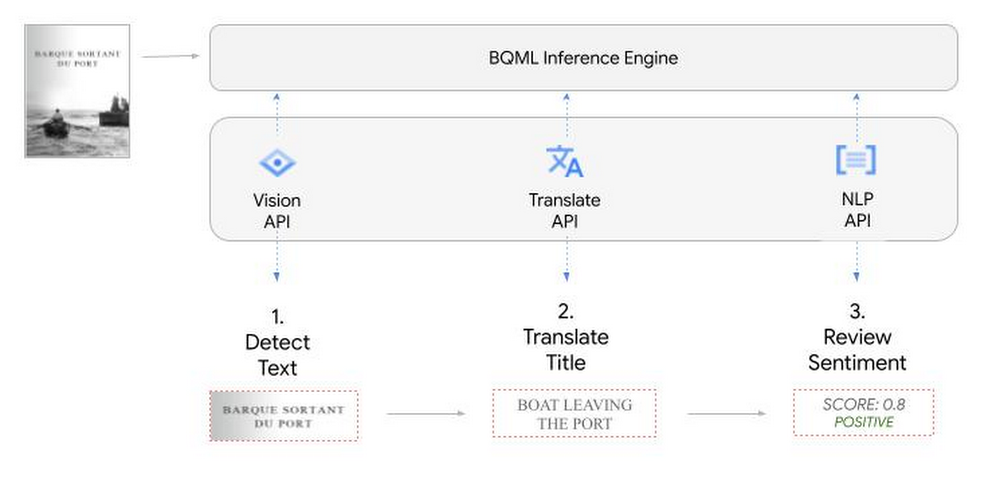
We’ll give examples of the BigQuery SQL needed to define your models and run your inferences. You’ll want to check out our notebook for a detailed guide on how to get this up and running in your Google Cloud project.
1. Define your AI Models in BigQuery
You will need to enable the APIs listed below, and also create a Cloud resource connection to enable BigQuery to interact with these services.
| API | Model Name |
| Vision AI API | Cloud_ai_vision_v1 |
| Translation AI API | Cloud_ai_translate_v3 |
| NLP AI API | Cloud_ai_natural_language_v1 |
You can then run the CREATE MODEL query for each AI service to create your pretrained models, replacing the model_name as required.
CREATE OR REPLACE MODEL
`{PROJECT_ID}.{DATASET_ID}.{VISION_MODEL_NAME}`
REMOTE WITH
CONNECTION `{PROJECT_ID}.{REGION}.{CONN_NAME}`
OPTIONS ( remote_service_type = '<model_name>' );
2. Use the Vision AI API to detect text in images stored in Cloud Storage
You will need to create an object table for your images in Cloud Storage. This read-only object table provides metadata for images stored in Cloud Storage:
CREATE OR REPLACE EXTERNAL TABLE
`{PROJECT_ID}.{DATASET_ID}.{OBJECT_TABLE_NAME}`
WITH
CONNECTION `{REGION}.{CONN_NAME}`
OPTIONS (object_metadata = 'SIMPLE', uris = ['{BUCKET_LOCATION}/*']);
To detect the text from our posters, you can then use ML.ANNOTATE_IMAGE and specify the text_detection feature.
SELECT
       ml_annotate_image_result.full_text_annotation.text AS text_content,
       *
FROM
       ML.ANNOTATE_IMAGE(
         MODEL `{PROJECT_ID}.{DATASET_ID}.{VISION_MODEL_NAME}`,
         TABLE `{DATASET_ID}.{OBJECT_TABLE_NAME}`,
         STRUCT(['TEXT_DETECTION'] AS vision_features));
A JSON response will be returned to BigQuery that includes the text content and language code of the text. You can parse the JSON to a scalar result using the dot annotation highlighted above.

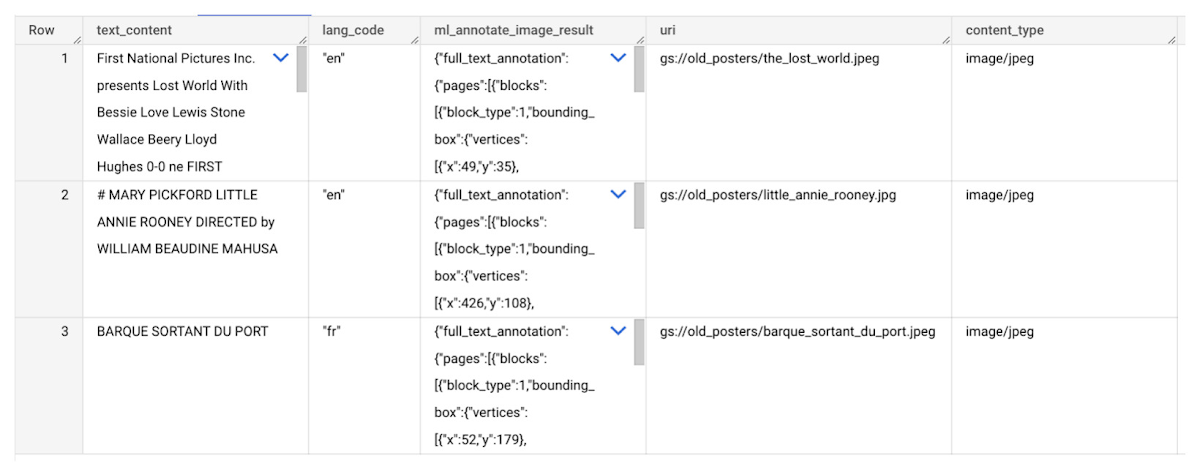
3. Use the Translation AI API to translate foreign movie titles
ML.TRANSLATE can now be used to translate the foreign titles we’ve extracted from our images into English. You just need to specify the target language and the table of the movie posters for translation:
SELECT
text_content,
STRING(ml_translate_result.translations[0].detected_language_code)
as original_language,
STRING(ml_translate_result.translations[0].translated_text)
as translated_title
FROM
  ML.TRANSLATE(
MODEL `{PROJECT_ID}.{DATASET_ID}.{TRANSLATE_MODEL_NAME}`,
TABLE `{DATASET_ID}.image_results`,
STRUCT('TRANSLATE_TEXT' as translate_mode, "en" as target_language_code));
Note: The table column with the text you want to translate must be named text_content:
The table of results will include json that can be parsed to extract both the original language and the translated text. In this case, the model has detected that title text is in French and has translated it to English:

4. Finally, use natural language processing (NLP) to run sentiment analysis against movie reviews
You can easily join inference results from your unstructured data with other BigQuery datasets to bolster your analysis. For example, we can now join the movie titles we extracted from our posters with thousands of movie reviews stored in BigQuery’s IMDB public dataset `bigquery-public-data.imdb.reviews`.
You can use ML.UNDERSTAND_TEXT with the analyze_sentiment feature to run sentiment analysis against some of these reviews to determine whether they are positive or negative:
SELECT
   primary_title, start_year, text_content AS review,
   FLOAT64(ml_understand_text_result.document_sentiment.score) AS score,
   FLOAT64(ml_understand_text_result.document_sentiment.magnitude) AS magnitude,
FROM
   ML.UNDERSTAND_TEXT(
     MODEL `{PROJECT_ID}.{DATASET_ID}.{NLP_MODEL_NAME}`,
           (
           SELECT
             primary_title, start_year, review AS text_content
           FROM
             `bigquery-public-data.imdb.title_basics` titles
           JOIN
             `bigquery-public-data.imdb.reviews` reviews
           ON
             reviews.movie_id = titles.tconst
           WHERE
             UPPER(titles.primary_title) = 'THE LOST WORLD' AND
             start_year = 1925
           ),
      STRUCT("analyze_sentiment" AS nlu_option)) ;
Note: The table column with the text you want to analyze must be named text_content:
The JSON response will include a score and magnitude. The score indicates the overall emotion of the text while the magnitude indicates how much emotional content is present:
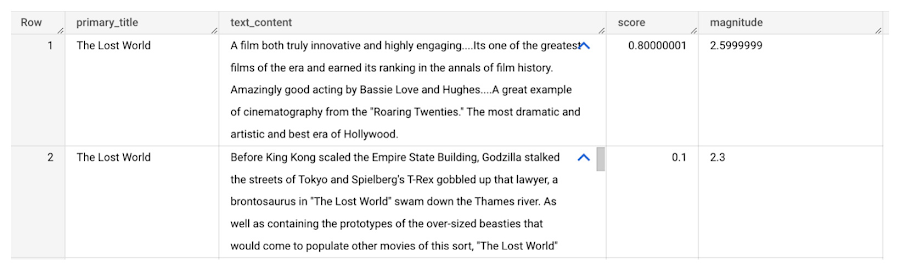
So, how did the Lost World compare with other movies that year?
To wrap up, we’ll compare the average review score of the 1925 Lost World movie to other movies released that year to see which was more popular. This can be done using familiar SQL analysis:
SELECT
 primary_title, start_year,
 AVG(FLOAT64(ml_understand_text_result.document_sentiment.score))AS av_score,
 AVG(FLOAT64(ml_understand_text_result.document_sentiment.magnitude)) AS av_magnitude
FROM
 ML.UNDERSTAND_TEXT(
   MODEL `{PROJECT_ID}.{DATASET_ID}.{NLP_MODEL_NAME}`,
         (
         SELECT
           primary_title, start_year, movie_id, review AS text_content
         FROM
           `bigquery-public-data.imdb.title_basics` titles
         JOIN
           `bigquery-public-data.imdb.reviews` reviews
         ON
           reviews.movie_id = titles.tconst
         WHERE
           start_year = 1925
         ),
   STRUCT("analyze_sentiment" AS nlu_option))
GROUP BY
   primary_title, start_year
ORDER BY
   av_score DESC;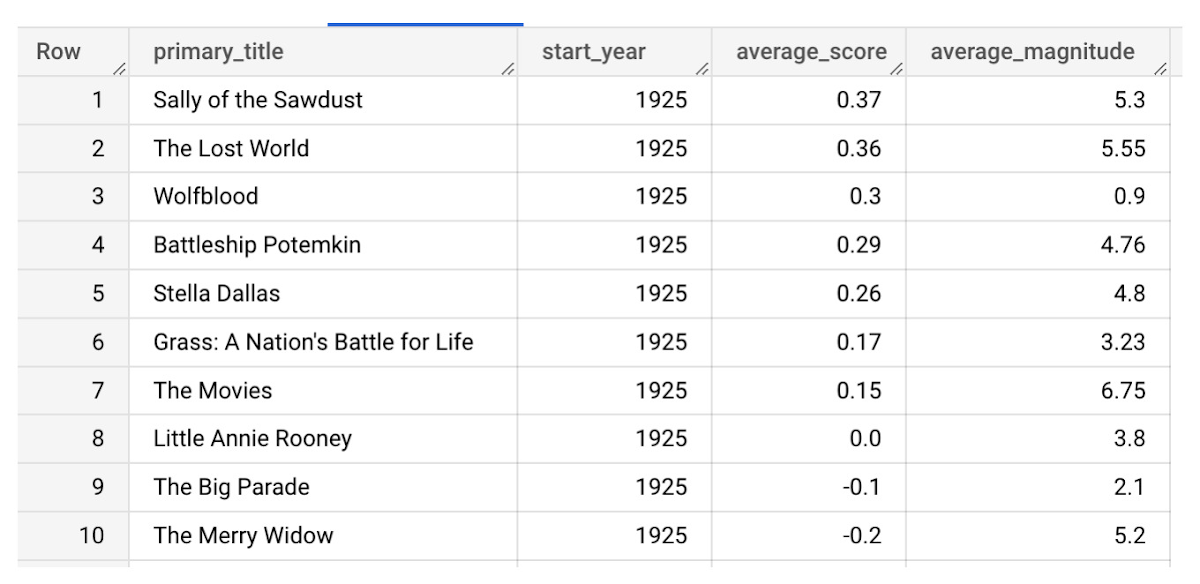
It looks like The Lost World narrowly missed out on the top spot to Sally of the Sawdust!
Want to learn more?
Check out our notebook for a step by step guide on using the BQML inference engine for unstructured data in Google Cloud. You can also check out our Cloud AI service table-valued functions overview page for more details. Curious about pricing? The BQML Pricing page gives a breakdown of how costs are applied across these services.
Real-time analytics for on-time delivery: Mercado Libre

3039
Of your peers have already read this article.
1:30 Minutes
The most insightful time you'll spend today!
Iteration and innovation fuel the data-driven culture at Mercado Libre. In our first post, we presented our continuous intelligence approach, which leverages BigQuery and Looker to create a data ecosystem on which people can build their own models and processes.
Using this framework, the Shipping Operations team was able to build a new solution that provided near real-time data monitoring and analytics for our transportation network and enabled data analysts to create, embed, and deliver valuable insights.
The challenge
Shipping operations are critical to success in e-commerce, and Mercado Libre’s process is very complex since our organization spans multiple countries, time zones, and warehouses, and includes both internal and external carriers. In addition, the onset of the pandemic drove exponential order growth, which increased pressure on our shipping team to deliver more while still meeting the 48-hour delivery timelines that customers have come to expect.
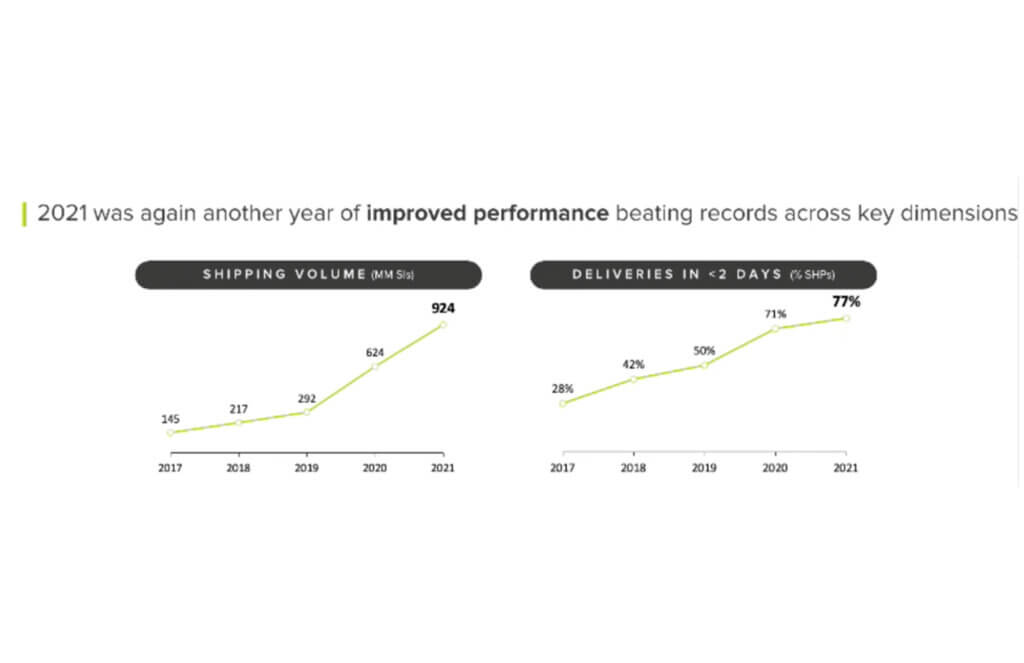
This increased demand led to the expansion of fulfillment centers and cross-docking centers, doubling and tripling the nodes of our network (a.k.a. meli-net) in the leading countries where we operate. We also now have the largest electric vehicle fleet in Latin America and operate domestic flights in Brazil and Mexico.
We previously worked with data coming in from multiple sources, and we used APIs to bring it into different platforms based on the use case. For real-time data consumption and monitoring, we had Kibana, while historical data for business analysis was piped into Teradata. Consequently, the real-time Kibana data and the historical data in Teradata were growing in parallel, without working together. On one hand, we had the operations team using real-time streams of data for monitoring, while on the other, business analysts were building visualizations based on the historical data in our data warehouse.
This approach resulted in a number of problems:
- The operations team lacked visibility and required support to build their visualizations. Specialized BI teams became bottlenecks.
- Maintenance was needed, which led to system downtime.
- Parallel solutions were ungoverned (the ops team used an Elastic database to store and work with attributes and metrics) with unfriendly backups and data bounded for a period of time.
- We couldn’t relate data entities as we do with SQL.
Striking a balance: real-time vs. historical data
We needed to be able to seamlessly navigate between real-time and historical data. To address this need, we decided to migrate the data to BigQuery, knowing we would leverage many use cases at once with Google Cloud.
Once we had our real-time and historical data consolidated within BigQuery, we had the power to make choices about which datasets needed to be made available in near real-time and which didn’t. We evaluated the use of analytics with different time windows tables from the data streams instead of the real-time logs visualization approach. This enabled us to serve near real-time and historical data utilizing the same origin.
We then modeled the data using LookML, Looker’s reusable modeling language based on SQL, and consumed the data through Looker dashboards and Explores. Because Looker queries the database directly, our reporting mirrored the near real-time data stored in BigQuery. Finally, in order to balance near real-time availability with overall consumption costs, we analyzed key use cases on a case-by-case basis to optimize our resource usage.
This solution prevented us from having to maintain two different tools and featured a more scalable architecture. Thanks to the services of GCP and the use of BigQuery, we were able to design a robust data architecture that ensures the availability of data in near real-time.
Streaming data with our own Data Producer Model: from APIs to BigQuery
To make new data streams available, we designed a process which we call the “Data Producer Model” (“Modelo Productor de Datos” or MPD) where functional business teams can serve as data creators in charge of generating data streams and publishing them as related information assets we call “data domains”. Using this process, the new data comes in via JSON format, which is streamed into BigQuery. We then use a 3-tiered transformation process to convert that JSON into a partitioned, columnar structure.
To make these new data sets available in Looker for exploration, we developed a Java utility app to accelerate the development of LookML and make it even more fun for developers to create pipelines.
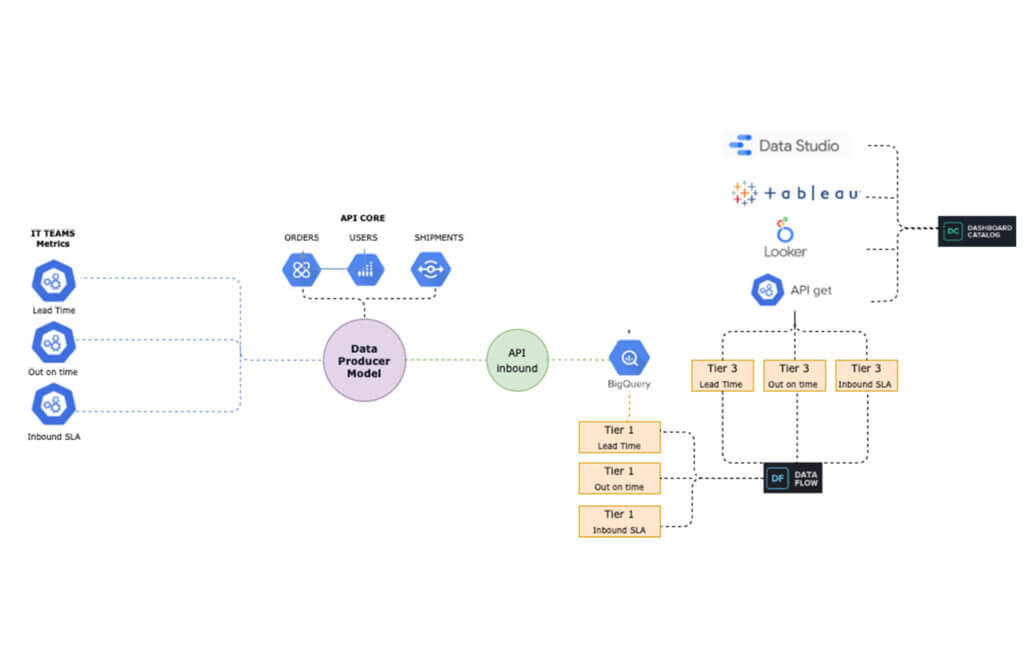
The complete “MPD” solution results in different entities being created in BigQuery with minimal manual intervention. Using this process, we have been able to automate the following:
- The creation of partitioned, columnar tables in BigQuery from JSON samples
- The creation of authorized views in a different GCP BigQuery project (for governance purposes)
- LookML code generation for Looker views
- Job orchestration in a chosen time window
By using this code-based incremental approach with LookML, we were able to incorporate techniques that are traditionally used in DevOps for software development, such as using Lams to validate LookML syntax as a part of the CI process and testing all our definitions and data with Spectacles before they hit production. Applying these principles to our data and business intelligence pipelines has strengthened our continuous intelligence ecosystem. Enabling exploration of that data through Looker and empowering users to easily build their own visualizations has helped us to better engage with stakeholders across the business.
The new data architecture and processes that we have implemented have enabled us to keep up with the growing and ever-changing data from our continuously expanding shipping operations. We have been able to empower a variety of teams to seamlessly develop solutions and manage third party technologies, ensuring that we always know what’s happening – and more critically – enabling us to react in a timely manner when needed.
Outcomes from improving shipping operations:
Today, data is being used to support decision-making in key processes, including:
- Carrier Capacity Optimization
- Outbound Monitoring
- Air Capacity Monitoring
This data-driven approach helps us to better serve you -and everyone- who expects to receive their packages on-time according to our delivery promise. We can proudly say that we have improved both our coverage and speed, delivering 79% of our shipments in less than 48 hours in the first quarter of 2022.
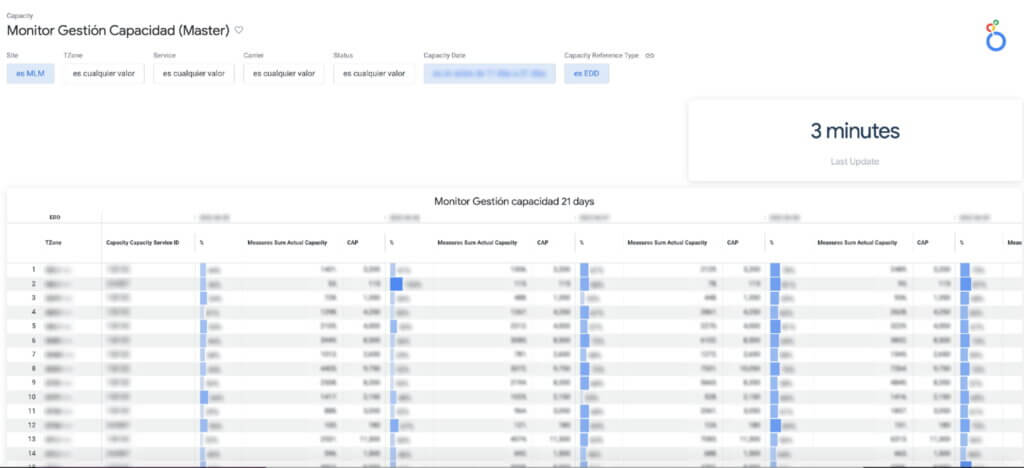
Here is a sneak peek into the data assets that we use to support our day-to-day decision making:
a. Carrier Capacity: Allows us to monitor the percentage of network capacity utilized across every delivery zone and identify where delivery targets are at risk in almost real time.
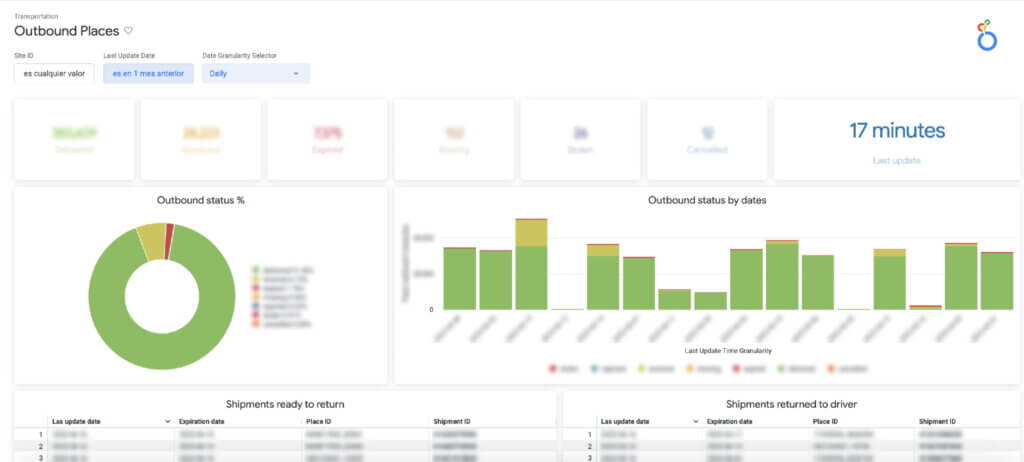
b. Outbound Places Monitoring: Consolidates the number of shipments that are destined for a place (the physical points where a seller picks up a package), enabling us to both identify places with lower delivery efficiency and drill into the status of individual shipments.
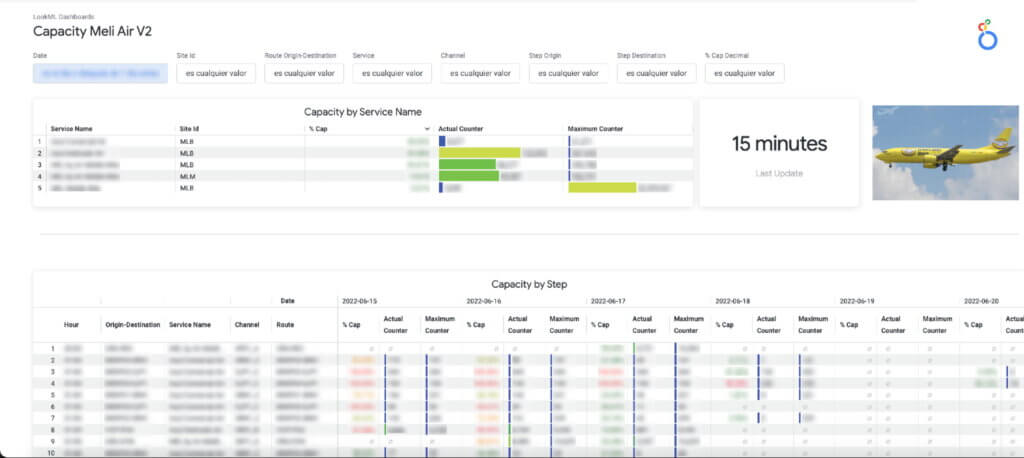
c. The Air Capacity Monitoring: Provides capacity usage monitoring for our aircrafts running each of our shipping routes.
Costs into the equation
The combination of BigQuery and Looker also showed us something we hadn’t seen before: overall cost and performance of the system. Traditionally, developers maintained focus on metrics like reliability and uptime without factoring in associated costs.
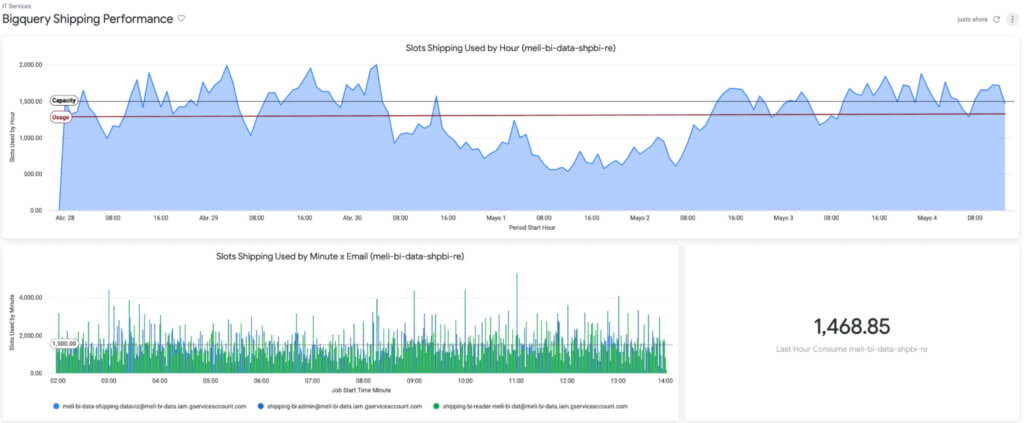
By using BigQuery’s information schema, Looker Blocks, and the export of BigQuery logs, we have been able to closely track data consumption, quickly detect underperforming SQL and errors, and make adjustments to optimize our usage and spend.
Based on that, we know the Looker Shipping Ops dashboards generate a concurrency of more than 150 queries, which we have been able to optimize by taking advantage of BigQuery and Looker caching policies.
The challenges ahead
Using BigQuery and Looker has enabled us to solve numerous data availability and data governance challenges: single point access to near real-time data and to historical information, self-service analytics & exploration for operations and stakeholders across different countries & time zones, horizontal scalability (with no maintenance), and guaranteed reliability and uptime (while accounting for costs), among other benefits.
However, in addition to having the right technology stack and processes in place, we also need to enable every user to make decisions using this governed, trusted data. To continue achieving our business goals, we need to democratize access not just to the data but also to the definitions that give the data meaning. This means incorporating our data definitions with our internal data catalog and serving our LookML definitions to other data visualizations tools like Data Studio, Tableau or even Google Sheets and Slides so that users can work with this data through whatever tools they feel most comfortable using.
If you would like a more indepth look at how we made new data streams available from a process we designed called the “Data Producer Model” (“Modelo Productor de Datos” or MPD) register to attend our webcast on August 31.
While learning and adopting new technologies can be a challenge, we are excited to tackle this next phase, and we expect our users will be too, thanks to a curious and entrepreneurial culture. Are our teams ready to face new changes? Are they able to roll out new processes and designs? We’ll go deep on this in our next post.
How TapClicks’ Google Cloud Migration Makes Life Easy for Marketers

8512
Of your peers have already read this article.
2:00 Minutes
The most insightful time you'll spend today!
Editor’s note: In this blog post we learn how TapClicks migrated to Google Cloud to offer their marketing customers a unified platform for data management, operations, insights, and analysis.
TapClicks is a smart marketing cloud, powered by data, that unifies our customer’s marketing. By choosing to migrate our core applications last year to Google Cloud, we cut costs, solved data-sharing concerns for our customers, and opened our stack up to a new ecosystem of possibilities.
The core problem that we’re solving for our customers is how to manage their marketing infrastructures data and operations. Life isn’t easy for marketers now. There are 7,000 different vendors servicing this space today – creating much complexity between digital agencies, media, and brands. Marketers face challenges in navigating all of these systems, logging in and out, understanding pacing goals, and managing the flow of marketing data so they can analyze and report internally as well as to their clients at scale.
We unify omnichannel campaign data (250 API connectors and 6000 Smart Connectors ™ ) from a plethora of marketing sources on an automated data warehousing solution, creating simplicity for organizations. Over 4,000 agencies, media companies, and brands use our Marketing Operations and Data Management Platform, which imports data at scale and creates an automatic data warehouse on Google Cloud. Teams can also leverage TapClicks, like our world class Facebook connector, to import data directly into Google Data Studios. Beyond importing and storing, we also provide data exporting to other Google solutions like Google Data Studio and Google Sheets. We also create interactive dashboards that let stakeholders and clients analyze their data, as well as automated, multi-channel reports that go out to clients at specified times. So channel comparisons, optimizations, attribution, and calculations are easily performed. Some of our customers are able to generate hundreds of thousands of individual reports and dashboards for their clients.
Although we may be best known for our reporting and analytics, we also empower teams managing the marketing operations workflow from customers and internal stakeholders, especially at scale. Our user-friendly, configurable system helps manage their orders and campaigns. Through automation of this process, we deliver tremendous amounts of efficiency, time saving, cost savings, and reduction of errors. The combination of these solutions makes up our unified platform, with additional capabilities like marketing intelligence that offers competitive and brand-level analysis. This is a disruptive solution in use by all leading media companies, agencies and many brands.
Partnering for possibilities
We faced a few challenges with our original tech stack, which included a mix of the leader in web services revenue, leaders in high performance data warehousing, as well as vendors on bare metal servers.
- One challenge was around costs, which were growing.
- Second, many of our customers work with multiple brands, and are very hesitant to share their data with the leader in web services, who’s often viewed as their competitor.
- Third, these vendors are more focused on their own revenue rather than a true long term partnership that would enable their customers to enjoy similar success as they have experienced.
When looking at other cloud providers, Google Cloud emerged for us as the front runner. They were competitive on costs, and their native Kubernetes support was superior— a big selling point for our DevOps team. There’s also a movement in the marketing and advertising industry away from AWS toward Google Cloud because of the data-sharing concern. Finally, most of our customers are already using Google Cloud tools, so there’s brand recognition and familiarity there, and easier integrations with their own systems.
Migrating to Google Cloud
Our migration, which took about five months, involved moving a significant chunk of our infrastructure, including our core applications, using Google Kubernetes Engine (GKE). In our legacy architecture, each of our clients was assigned to one of our virtual machines (VMs), and there was a lot of unused capacity because we had to provision for the max usage. We appreciated GKE’s cloud native capabilities, especially autoscaling, a huge benefit for our web application. We have varying usage patterns during the day, and though our application is mostly used during business hours, there are also days in the month of higher usage, and autoscaling saves us time and costs. GKE also makes deployments much easier, and we anticipate a lot of benefits there for our developer environments. We’ve moved some of our microservices into GKE and plan to move more in the future. All in all, we were able to migrate our core products and the bulk of our AWS spend successfully to Google Cloud.
We also moved from our other vendors Relational Database Service (RDS) to running MySQL on our own VMs on Google Cloud, which gives us more flexibility in terms of settings and fine tuning. We’re still trying to find the best mix as we’re modernizing our infrastructure, and we took this opportunity to migrate from MySQL 5.7 to 8.0.
Our next stage is exploring more of the capabilities and services of Google Cloud, including BigQuery, which we’re considering for our own data warehouse. The fact that we could also run Snowflake on Google Cloud, if needed, was another selling point for our migration.
We’re especially interested in BigQuery ML’s machine learning and natural language processing capabilities, which enabled better predictive insights. Our customers want insights from their campaigns— which are working, which are paying off, where should they invest next? Using our platform, they’re looking not only to generate reporting, but also identify opportunities to improve campaign performance. We plan to use AI and ML to improve those capabilities, so that our customers can seamlessly unlock insight and intelligence from their marketing data and campaigns.
Double-clicking on Google Cloud
For us, being able to deeply leverage and partner with Google Cloud to deliver those solutions on a single stack is critical, and we think our customers will love it. We see TapClicks and Google Cloud partnering at a level beyond what you typically see in a cloud provider relationship. Already, fifty percent of our company is working with various Google Cloud solutions, and we envision TapClicks and Google Cloud as extensions of each other, providing a single, powerful platform solution.
Google Cloud understands the partnership concept, and their team was able to shine a light on their services and what they could bring to the table. Compared to our previous experiences, dealing with the Google Cloud team has been a true pleasure. Now that we’ve migrated, we’re ready to take our next steps into the services available to us in the Google Cloud ecosystem, and the problems we’ll continue to solve for our customers. Learn more about TapClicks and BigQuery ML.
Google Cloud Helps Northwell Health to Boost Caregiver Productivity and Access to Right Care Using AI

7942
Of your peers have already read this article.
2:00 Minutes
The most insightful time you'll spend today!
Lung cancer is the leading cause of cancer death in the United States and like any cancer, early detection is crucial to survival. Screening at-risk populations is an important part of reducing mortality, and if concerning nodules are found on imaging, further testing may be required. Today, we’ll share how Northwell Health uses Google Cloud products such as Cloud Healthcare APIs and BigQuery to increase caregiver productivity and deliver better care for patients with findings that indicate potential development of lung cancer.
Northwell is New York’s largest healthcare provider
Northwell Health is New York’s largest healthcare provider with 23 hospitals and nearly 800 outpatient facilities. Northwell’s nearly 4,000 doctors care for millions of patients each year, and at this scale, there is an immense amount of healthcare data to manage. To better manage and leverage this data, Northwell Health partnered with Google Cloud starting in 2018.
Enabling caregivers to spend more time with patients
Nic Lorenzen, the lead developer of Northwell Emerging Technology and Innovation team, has a mission to put together data for caregivers in a way that makes sense. It is no secret that inefficient electronic health records systems have a negative impact on a physician’s ability to deliver quality care. Traditional EHRs have information distributed across many tabs, which forces caregivers to spend considerable time at the computer trying to find information. Moreover, speed of care matters. If care is delayed, patients may have to spend more time in the hospital and may suffer worse health outcomes.
To solve this problem, Nic’s team focused on giving caregivers the most relevant pieces of data at the right time by developing an intelligent clinician rounding app. The data needed to derive these insights can depend on the caregiver’s role–a nurse cares about different things than a cardiologist. This system aggregates multiple data sources, and provides patient-specific insights to caregivers.
This system would not have been possible before with traditional EHRs and data warehouses that have proprietary data models and rarely sync data in real time. Now with data easily accessible through Google Cloud’s Healthcare solutions, Nic’s team can deliver the right clinical information to the right people instantly. These days, Nic says, “instead of spending 75% of our time dealing with architecting the underlying platforms, we spend 75% of our time focused on higher value use cases for clinicians and patients. Google Cloud’s Healthcare solutions have greatly improved our developer productivity and time to value.”
Caregivers have found this new system to be a game changer.Before the implementation of this system, caregivers would spend, on average, seven to nine minutes finding the data needed to make medical decisions for one patient. Now, that aggregated information is delivered to a caregiver’s mobile device in less than a second.
Ensuring patients get the right care with the power of AI
There are a number of reasons why patients might not get the care that they need. For example, patients today can go to multiple hospitals and clinics settings, and coordinating care across multiple facilities is complex. Regional hospitals and clinics have their own siloed view of their data, so pertinent information gathered by one clinic might not be seen by another. These gaps in clinical data lead to gaps in patient care.
When a patient gets radiologic imaging, they may have findings unrelated to the reason they initially got the imaging. For example, a chest CT for a car accident might reveal an incidental lung nodule that could be cancerous. Unfortunately, research shows that a large portion of patients do not get follow up for these incidental findings because it isn’t the primary reason why the patient is seeing a doctor. Moreover, social determinants of health are a factor that affects which patients receive follow-up care. Identifying these patients and providing the necessary follow up care prevents adverse events related to delayed detection of cancer.

With Cloud Healthcare solutions, Northwell built an AI model to identify these patients so that oncologists can appropriately follow up with patients who have findings suspicious for lung cancer. The AI model detects incidental pulmonary nodules in radiology reports so that doctors can then contact the patients that need follow-up care. Nic says his team was able to build this system in a week: “Google Cloud did a lot of heavy-lifting for us and allowed us to get to the AI applications much faster. It allowed us to build a platform that just works.”
Healthcare systems can now rapidly generate healthcare insights with one end-to-end solution, Google Cloud Healthcare Data Engine. It builds on and extends the core capabilities of the Google Cloud Healthcare API to make healthcare data more immediately useful by enabling an interoperable, longitudinal record of patient data. Northwell Health uses Google Cloud as the core of their platform, enabling their developers to create solutions to the most pressing healthcare problems.
Special thanks to Kalyan Pamarthy, Product Management Lead on Cloud Healthcare and Natural Language APIs for contributing to this blog post.
How Moving Database to the Cloud Helped Recruit Technologies Gain Higher Availability and Lower Cost
5451
Of your peers have already read this article.
1:30 Minutes
The most insightful time you'll spend today!
There are just under 8 billion people on Earth, depending on the source. Here at Recruit, our work is to develop and maintain an email marketing system that sends personalized emails to tens of millions of customers of hundreds of web services, all with the goal of providing the best, most relevant customer experience.
When Recruit was founded in 1960, the company was focused on helping match graduates to jobs. Over the years, we’ve expanded to help providers that deal with almost every personal moment and event a person encounters in their life. From travel plans to real estate, restaurant choices to haircuts, we offer software and services to help providers deliver on virtually everything and connect to their end-customers.
Recruit depends on email as a key marketing vehicle to end-customers and to provide a communications channel to clients and advertisers across its services. To maximize the impact of these emails, we customize each email we send. To help power this business objective, we developed a proprietary system named “Soup” that we host on Google Cloud Platform (GCP). Making use of Google Cloud Spanner, Soup is the connective tissue that manages the complex customization data needed for this system.
Of course, getting from idea to functioning product is easier said than done. We have massive datasets so requirements like high availability and serving data in real-time are particularly tricky. Add in a complex existing on-premises environment, some of which we had to maintain in our journey to the cloud creating a hybrid environment, and the project became even more challenging.
A Soup Primer
First, why the name “Soup”? The name of the app is actually “dashi-wake” in Japanese, from “dashi,” a type of soup. In theory, Soup is a fairly simple application: its API returns recommendation results based on the data we compute about a user via the user’s user ID. Soup ingests pre-computed recommendations and then serves those recommendations to the email generation engine and tracks metrics. While Soup doesn’t actually send the customer emails, it manages the entire volume of personalization and customization data for tens of millions of users. It also manages the computed metrics associated with these email sends such as opens, clicks, and other metadata.
Soup leverages other GCP services such as App Engine Flex (Node.js), BigQuery, Data Studio, and Stackdriver in addition to Cloud Spanner.
Soup Requirements
High availability
If the system is unavailable when a user decides to open an email they see a white screen with no content at all. Not only is that lost revenue for that particular email, it makes customers less likely to open future emails from us.
Low latency
Given a user ID, the system needs to search all its prediction data and generate the appropriate content—an HTML file, an image, multiple images, or other content—and deliver it, all very quickly.
Real-time log ingestion and fast JOINs
In today’s marketing environment, tracking user activity and being able to make dynamic recommendations based on it is a must-have. We live in an increasingly real-time world. In the past, it might have been OK to take a week or longer to adapt content based on customer behavior. Now? A delay of even a day can make the difference between a conversion and a lost opportunity.
The Problem
Pushing out billions of personalized emails to tens of millions of customers comes with some unique challenges. Our previous on-premises system was based on Apache HBase, the open-source NoSQL database, and Hive data warehouse software. This setup presented three major obstacles:
Cluster sizing
Email marketing is a bursty workload. You typically send a large batch of emails, which requires a lot of compute, and then there’s a quiet period. For our email workloads, we pre-compute a large set of recommendations and then serve those recommendations dynamically upon email open. On-premises, there wasn’t much flexibility and we had to resize clusters manually. We were plagued by errors whenever loads of email opens and the resulting requests to the system outpaced the traffic we could handle, because the cluster size of our HBase/Hive system couldn’t keep up.
Performance
The next issue was optimizing the schema model for performance. Soup has a couple of main functions: services write customer tracking data to it, and downstream “customers” read that data from it to create the personalized emails. On the write side, after the data is written to Soup, the writes need to be aggregated. We initially did this on-premises, which was quite difficult and time consuming because Hbase’s doesn’t offer aggregation queries, and because it was hard to scale in response to traffic bursts.
Transfer delays
Finally, every time we needed to generate a recommendation model for a personalized email blast, we needed to transfer the necessary data from HBase to Hive to create the model, then back to HBase. These complex data transfers were taking two-to-three days. Needless to say, this didn’t allow for the type of agility that we need to provide the best service to our customers.
Cloud Spanner allows us to store all our data in one place, and simply join the data tables and do aggregates; there’s no need for a time-intensive data transfer. Using this model, we believe we can cut the recommendation generation time from days to under a minute, bringing real-time back into the equation.
Why Cloud Spanner?
Compared to the previous application running on-premises, Cloud Spanner offers lower cost, lower operations requirements and higher availability. Most critically, we wanted to calculate metrics (KPIs) in real time without data transfer. Cloud Spanner allows us to do this by pumping SQL queries into a custom dashboard that monitors KPIs in real time.
Soup now runs on GCP, although the recommendations themselves are still generated in an on-premise Hadoop cluster. The computed recommendations are stored in Cloud Spanner for the reasons mentioned above. After moving to GCP and architecting for the cloud, we see an error rate of .005% per second vs. a previous rate of 4% per second, an improvement of 1/800. This means that for an email blast sent to all users in Japan, one user won’t be able to see one image in one email. Since these emails often contain 10 images or more, this error rate is acceptable.
Cloud Spanner also solved our scaling problem. In the future, Soup will have to support one million concurrent users in different geographical areas. Likewise, Soup has to perform 5,000 queries per second (QPS) at peak times on the read side, and will expand this requirement to 20,000 to 30,000 QPS in the near future. Cloud Spanner can handle all the different, complex transactions Soup has to run, while scaling horizontally with ease.
Takeaways
In migrating our database to Cloud Spanner, we learned many things that are worth taking note of, whether you have 10 or 10 million users.
Be prepared to scale
We took scaling into account from Day One, sketching out specific requirements for speed, high availability, and other metrics. Only by having these requirements specifically laid out were we able to choose—and build—a solution that could meet them. We knew we needed elastic scale.
With Cloud Spanner, we didn’t have to make any of the common trade-offs between the relational database structure we wanted, and the scalability and availability needed to keep up with the business requirements. Likewise, with a growing company, you don’t want to place any artificial limits on growth, and Cloud Spanner’s ability to scale to “arbitrarily large” database sizes eliminates this cap, as well as the need to rewrite or migrate in the future as our data needs grow.
Be realistic about downtime
For us, any downtime can result in literally thousands of lost opportunities. That meant that we had to demand virtually zero downtime from any solution, to avoid serving up errors to our users. This was an important realization. Google Cloud provides an SLA guarantee for Cloud Spanner. This solution is more available and resistant to outages than anything we would build on our own.
Don’t waste time on management overhead
When you’re worrying about millions of users and billions of emails, the last thing you have time to do is all the maintenance and administrative tasks required to keep a database system healthy and running. Of course, this is true for the smallest installations, as well. Nobody has a lot of extra time to do things that should be taken care of automatically.
Don’t be afraid of hybrid
We found that a hybrid architecture that leverages the cloud for fast data access but still using our existing on-premises investments for batch processing to be effective. In the future, we may move the entire workload to the cloud but data has gravity, and we currently have lots of data stored on-premises.
Aim for real-time
At this time, we can only move data in and out of Cloud Spanner in small volumes. This prevents us from making real-time changes to recommendations. Once Cloud Spanner supports batch and streaming connections, we’ll be able to enable an implementation to provide more real-time recommendations to deliver even more relevant results and outcomes.
Overall, we’re extremely happy with Cloud Spanner and GCP. Google Cloud has been a great partner in our move to the cloud, and the unique services provided enable us to offer the best service to our customers and stay competitive.
DR for Cloud: Architecting Microsoft SQL Server with Google Cloud

3756
Of your peers have already read this article.
2:45 Minutes
The most insightful time you'll spend today!
Database disaster recovery (DR) planning is an important component of a bigger DR plan, and for enterprises using Microsoft SQL Server on Compute Engine, it often involves critical data.
When you’re architecting a disaster recovery solution with Microsoft SQL Server running on Google Cloud Platform (GCP), you have some decisions to make to build an effective, comprehensive plan.
Microsoft SQL Server includes a variety of disaster recovery strategies and features, such as Always On availability groups or Failover Cluster Instances.
And Google Cloud is designed from the start for resilience and availability. There are several types of data centers available within GCP where you can map SQL Server’s availability features based on your specific requirements: zones and regions. Zones are autonomous data centers co-located within a GCP region. These regions are available in different geographies such as North America or APAC.
However, there is no single disaster recovery strategy to map Microsoft SQL Server DR features to Google Cloud’s data center topology that satisfies every possible combination of disaster recovery requirements.
As a database architect, you have to design a custom disaster recovery strategy based on your specific use cases and requirements.
Our new Disaster Recovery for Microsoft SQL Server solution provides information on Microsoft’s SQL Server disaster recovery strategies, and shows how you can map them to zones and regions in GCP based on your business’s particular criteria and requirements. One example is deploying an availability group within a region across three zones (shown in the diagram below).
For successful DR planning, you should have a clear conceptual model and established terminology in place. In this solution, you’ll find a base set of concepts and terms in context of Google Cloud DR. This includes defining terms like primary database, secondary database, failover, switchover, and fallback.
You’ll also find details on recovery point objective, recovery time objective and single point of failure domain, since those are key drivers for developing a specific disaster recovery solution.
Building a DR solution with Microsoft SQL Server in GCP regions
To get started with implementing the availability features of Microsoft SQL Server in the context of Google Cloud, take a look at this diagram, which shows the implementation of an Always On availability group in a GCP region, using several zones:
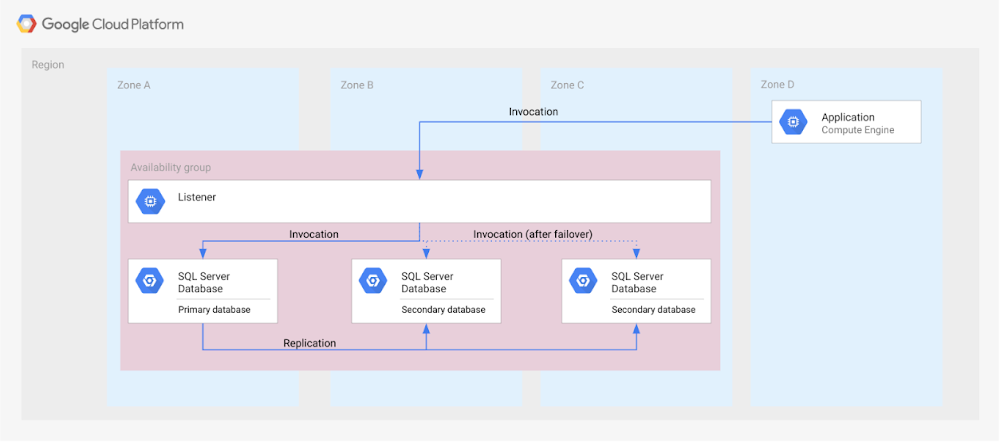
In the new solution, you’ll see other availability features, like log shipping, along with how they map to GCP. In addition, features in Microsoft SQL Server that are not deemed availability features—like server replication and backup file shipping—can actually be used for disaster recovery, so those are included as well.
Disaster recovery features of Microsoft SQL Server do not have to be used in isolation and can be combined for more complex and demanding use cases. For example, you can set up availability groups in two regions with log shipping as the transfer mechanism between the regions.
Disaster Recovery for Microsoft SQL Server also describes the disaster recovery process itself, how to test and verify a defined disaster recovery solution, and outlines a basic approach, step-by-step.
More Relevant Stories for Your Company

Speed Up Data-driven Innovation in Life Sciences with Google Cloud
The last few years have underscored the importance of speed in bringing new drugs and medical devices to market, while ensuring safety and efficacy. Over this time, healthcare and life sciences organizations have transformed the way they research, develop, and deliver patient care by embracing agility and innovation. Now, the

Demystifying Transactional Locking in Cloud Spanner
Cloud Spanner is a fully managed relational database with unlimited scale, strong consistency, and up to 99.999% availability. It is designed for highly concurrent applications that read and update data, for example, to process payments or for online game play. To ensure the consistency across multiple concurrent transactions, Cloud Spanner

Google Cloud Data Heroes Series: Honoring Data Practitioner’s Journey and Learning with GCP
Google Cloud Data Heroes is a series where we share stories of the everyday heroes who use our data analytics tools to do amazing things. Like any good superhero tale, we explore our Google Cloud Data Heroes’ origin stories, how they moved from data chaos to a data-driven environment, what




Pega Systems Migrates SAP Servers to Google Cloud in Just 9 Weeks!
Pega Systems' financial data on SAP environs were on a hosting platform that lacked agility. By moving nearly 30 SAP servers to Google Cloud in just 9 weeks, Pega Systems was able to unlock data and integrate BigQuery into SAP HANA to deliver personalization for clients and embark on an
