





Unlock Powerful Insights: Monitor Cloud Expenses with BigQuery’s Data Export

1310
Of your peers have already read this article.
1:30 Minutes
The most insightful time you'll spend today!
TL;DR – Regular file export for Google Cloud billing is going away on May 15th! Try out this interactive tutorial to set up exporting and explore your billing data with BigQuery
You may have seen an email from Google Cloud reminding you to set up billing data export to BigQuery, and letting you know that file export options are going away. More specifically:
Starting May 15, 2023, your daily usage and cost estimates won’t be automatically exported to a Cloud Storage bucket. Your existing Cloud Storage buckets will continue to exist, but no new files will be added on an ongoing basis.
In fact, I even received one of these notifications since I had an old billing account (or two) that still had file export enabled. Even though the file export is going away, exporting your billing data to BigQuery gives you more detail and more capabilities to analyze, so it’s a big upgrade.
Start from the start
While Google Cloud does offer a free trial and free tier of services, it shouldn’t come as a surprise that most cloud services cost money to use. With the unique properties of the cloud, it’s much easier to bill for exact usage of various services, like pay-per-second for virtual machines. However, this can also become an overwhelming amount of information when a large number of services are being used across multiple teams. In order to make sure you understand your billing data, Google Cloud offers that data through direct reporting in the Cloud console, file exports, and exporting to BigQuery.
Most importantly, the file export for Cloud Billing data is going away on May 15th (the file exports for specific reports, like the cost table, aren’t going away). This was an option for billing accounts to generate daily CSV or JSON files into a Cloud Storage bucket so you could download the files and analyze them as needed. While these exports were definitely helpful for looking at your billing data, over time they couldn’t keep up with the complexity and volume of data that comes out of a billing account.
The most important thing to note here is simple: this export option is being deprecated entirely, so if you’re currently using it (and even if you’re not), you should make sure exporting to BigQuery is enabled.
Large data, large queries
Exporting from your billing account into BigQuery has been an option for the past few years, and now more than ever it’s the central option for managing your billing data. Of course, BigQuery is a natural home for large datasets with the scale and granularity of your billing data. In addition to that, exporting to BigQuery also happens more frequently than a daily file export, so you can do cost anomaly detection much faster.
As teams and organizations become larger, it can be increasingly difficult to figure out which groups are responsible for different costs. If your organization is using a chargeback model (where one group pays for all resources and then breaks down cost details for individual teams/groups to be responsible for their usage), then using BigQuery is the best way for you to accurately collect and analyze costs. On top of being able to query directly against your data, BigQuery also makes it much easier to integrate with other tools, like Looker or Looker Studio for visualization.
The actual data being exported to BigQuery are hourly records of every service your billing account is responsible for, along with detailed information like the SKU, what type of unit is being measured, and how many of that unit you’re paying for.
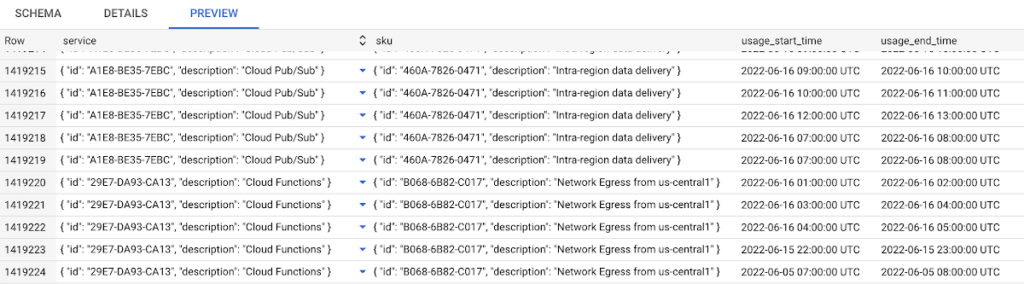
I suspect most folks using the file export (and probably most folks overall) will be fine with the standard export for BigQuery, and can use the detailed cost and pricing options if they need even more details. You can find some more details on all the exports in this blog post.
With the file export going away, it’s also important to mention: exporting your Cloud Billing data to BigQuery starts when you enable it, and doesn’t include older data. So make sure you set yourself up for future success by enabling billing export as soon as possible. Try using our built-in walkthrough to help you enable the export and to get started analyzing the data! You can also read more in the documentation.
Gartner Positions Google as the Leader for Cloud Database Management Systems!

3604
Of your peers have already read this article.
1:30 Minutes
The most insightful time you'll spend today!
We are thrilled that Gartner has positioned Google as a Leader for the second year in a row in the 2021 Gartner® Magic Quadrant™ for Cloud Database Management Systems (DBMS).
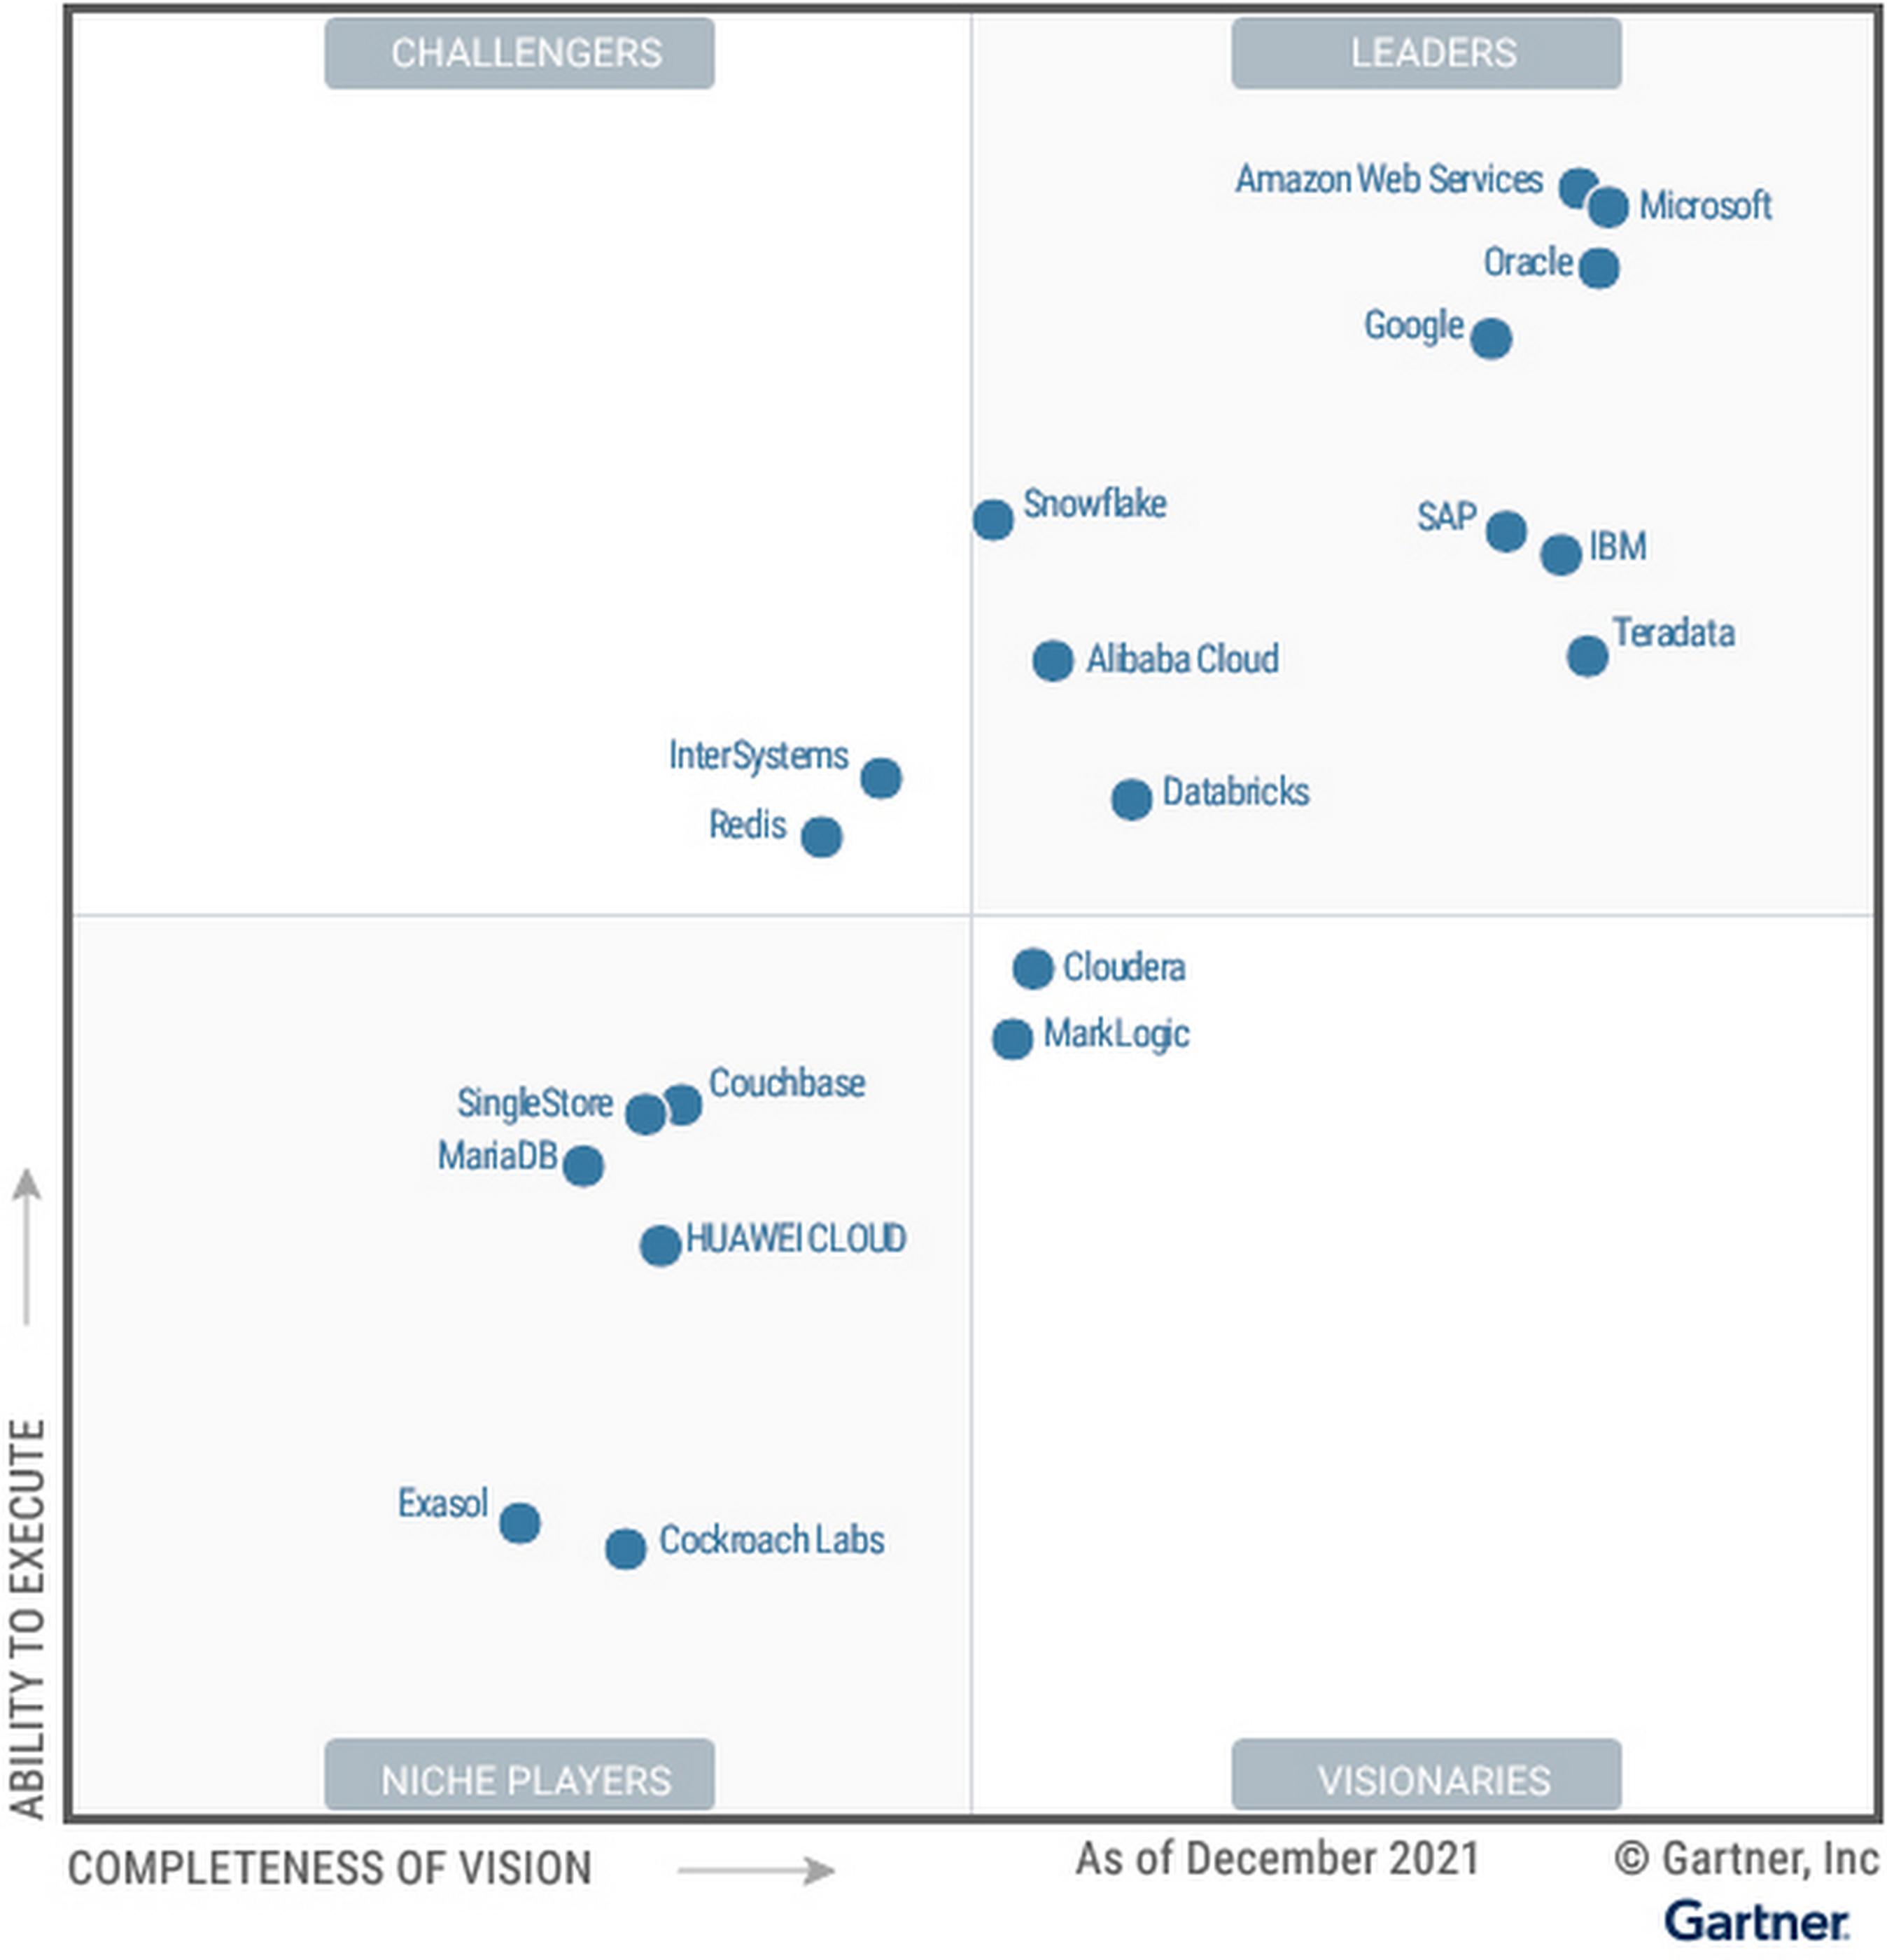
We believe the report evaluated Google’s unified capabilities across both transactional and analytical use cases, and showcases innovation progress in areas like data management consistency, high speed processing and ingestion, security, elasticity, advanced analytics, and more.
With the recent announcement of Dataplex, organizations can centrally manage, monitor, and govern their data across data lakes, data warehouses, and data marts with consistent controls. Solutions like BigQuery ML provide a “built-in” approach for advanced analytics capabilities and Analytics Hub offer the infrastructure customers need to share data analytics solutions securely and at scale in ways never before achieved. For example, over a seven-day period in April, more than 3,000 different organizations shared over 200 petabytes of data using BigQuery.
Research shows 90% of organizations have a multicloud strategy, which is why we have invested in a cross-cloud data analytics solution for Google Cloud, AWS, and Azure with BigQuery Omni. Additionally, our progress with Anthos and our Distributed Cloud this past year further advance our ability to support multi and hybrid cloud scenarios. To gain a competitive advantage using data, organizations need a data platform that transcends transactional and analytical workloads and can be run with the highest level of reliability, availability and security. Cloud Spanner, our globally distributed relational database has redefined the scale, global consistency, and availability of Online Transaction Processing (OLTP) systems. Spanner processes over 1 billion requests per second at peak, and has been battle-tested with some of the most-demanding applications, including Google services such as Search, YouTube, Gmail, Maps, and Payments. And what’s unique about our core services Spanner and BigQuery, is that they leverage common infrastructure such as our highly durable distributed file system (Colossus), our large-scale cluster management system (Borg), and Jupiter, our high-performance networking infrastructure, enabling features such as federation between Spanner and BigQuery.
We remain focused on the integration of Google Trends, Maps, Search, Ads, and have increased industry domain expertise in areas such as retail, financial services, healthcare, and gaming. We’re continuing to develop industry white papers such as this one – How to develop Global Multiplayer Games using Cloud Spanner – and we’re proud of the work the team has done to create and share industry and horizontal architecture patterns built from industry leaders to serve as solution accelerators for customer use cases.
Innovation momentum continues with a unified and open data cloud
We continue to innovate across our data cloud portfolio, especially with the innovations we announced at Google Cloud NEXT’21. BigQuery Omni is now available for AWS and Azure, supporting cross-cloud analytics for customers. We’ve added additional capabilities for enterprise data management and governance with Dataplex, which recently went GA. We’ve made migrations to Cloud SQL easier and faster with the Database Migration Service. More than 85% of all migrations are underway in under an hour, with the majority of customers migrating their databases from other clouds. We are embracing openness with Spanner by adding a PostgreSQL interface, allowing enterprises to take advantage of Spanner’s unmatched global scale, 99.999% availability, and strong consistency using skills and tools from the popular PostgreSQL ecosystem. We are also automating data processing with Spark on Google Cloud, which enables developers to spend less time on infrastructure management and more time on data science, modeling, and delivering business value. Finally, we announced Google Earth Engine on Google Cloud, allowing customers to integrate Earth Engine with BigQuery, Google Cloud’s ML technologies, and the Google Maps Platform.
With these innovations, enterprises like PayPal, Deutsche Bank, and Equifax use Google Cloud to solve for their end-to-end data lifecycle use cases. Organizations like Telefonica use Google Cloud to deliver new customer experiences. Telefónica has transformed every aspect of how they store, share, and analyze data while doubling processing power and lowering costs.
We continue to support an open ecosystem of data partners including Informatica, Tableau, MongoDB, Neo4j, C3.ai, and Databricks, giving customers the flexibility of choice to build their data clouds without being locked into a single approach.
We are honored to be a Leader in the 2021 Gartner Magic Quadrant for Cloud Database Management Systems (DBMS), and look forward to continuing to innovate and partner with you on your digital transformation journey.
Download the complimentary 2021 Gartner Magic Quadrant for Cloud Database Management Systems report.
Learn more about how organizations are building their data clouds with Google Cloud solutions.
Gartner, Magic Quadrant for Cloud Database Management Systems, Henry Cook, Merv Adrian, Rick Greenwald, Adam Ronthal, Philip Russom, 14 December 2021.
Gartner and Magic Quadrant are registered trademarks of Gartner, Inc. and/or its affiliates in the U.S. and internationally and are used herein with permission. All rights reserved.
Gartner does not endorse any vendor, product or service depicted in its research publications and does not advise technology users to select only those vendors with the highest ratings or other designation. Gartner research publications consist of the opinions of Gartner’s Research & Advisory organization and should not be construed as statements of fact. Gartner disclaims all warranties, expressed or implied, with respect to this research, including any warranties of merchantability or fitness for a particular purpose.
This graphic was published by Gartner, Inc. as part of a larger research document and should be evaluated in the context of the entire document. The Gartner document is available upon request from Google Cloud.
Two Ad Agencies Leverage BigQuery to Support Next-gen Ad Campaigns

4808
Of your peers have already read this article.
2:30 Minutes
The most insightful time you'll spend today!
Advertising agencies are faced with the challenge of providing the precision data that marketers require to make better decisions at a time when customers’ digital footprints are rapidly changing. They need to transform customer information and real-time data into actionable insights to inform clients what to execute to ensure the highest campaign performance.
In this post, we’ll explore how two of our advertising agency customers are turning to Google BigQuery to innovate, succeed, and meet the next generation of digital advertising head on.
Net Conversion eliminated legacy toil to reach new heights
Paid marketing and comprehensive analytics agency Net Conversion has made a name for itself with its relentless attitude and data-driven mindset. But like many agencies, Net Conversion felt limited by traditional data management and reporting practices.
A few years ago, Net Conversion was still using legacy data servers to mine and process data across the organization, and analysts relied heavily on Microsoft Excel spreadsheets to generate reports. The process was lengthy, fragmented, and slow—especially when spreadsheets exceeded the million-row limit.
To transform, Net Conversion built Conversionomics, a serverless platform that leverages BigQuery, Google Cloud’s enterprise data warehouse, to centralize all of its data and handle all of its data transformation and ETL processes. BigQuery was selected for its serverless architecture, high scalability, and integration with tools that analysts were already using daily, such as Google Ads, Google Analytics, and Data Hub. After moving to BigQuery, Net Conversion discovered surprising benefits that streamlined reporting processes beyond initial expectations. For instance, many analysts had started using Google Sheets for reports, and BigQuery’s native integration with Connected Sheets gave them the power to analyze billions of rows of data and generate visualizations right where they were already working.If you’re still sending Excel files that are larger than 1MB, you should explore Google Cloud.
Kenneth Eisinger
Manager of Paid Media Analytics at Net Conversion
Since modernizing their data analytics stack, Net Conversion has saved countless hours of time that can now be spent on taking insights to the next level. Plus, BigQuery’s advanced data analytics capabilities and robust integrations have opened up new roads to offer more dynamic insights that help clients better understand their audience.
For instance, Net Conversion recently helped a large grocery retailer launch a more targeted campaign that significantly increased downloads of their mobile application. The agency was able to better understand and predict their customers’ needs by analyzing buyer behavior across the website, mobile application, and their purchase history. Net Conversion analyzed website data in real-time with BigQuery, ran analytics on their mobile app data through the Firebase’s integration with BigQuery, and enriched these insights with sales information from the grocery retailer’s CRM to generate propensity behavior models that accurately predicted which customers would most likely install their mobile app.
WITHIN helped companies weather the COVID storm
WITHIN is a performance branding company, focused on helping brands maximize growth by fusing marketing and business goals together in a single funnel. During the COVID-19 health crisis, WITHIN became an innovator in the ad agency world by sharing real-time trends and insights with customers through its Marketing Pulse Dashboard. This dashboard was part of the company’s path to adopting BigQuery for data analytics transformation.
Prior to using BigQuery, WITHIN used a PostgreSQL database to house its data and manual reporting. Not only was the team responsible for managing and maintaining the server, which took focus away from the data analytics, but query latency issues often slowed them down.
BigQuery’s serverless architecture, blazing-fast compute, and rich ecosystem of integrations with other Google Cloud and partner solutions made it possible to rapidly query, automate reporting, and completely get rid of CSV files.
Using BigQuery, WITHIN is able to run Customer Lifetime Value (LTV) analytics and quickly share the insights with their clients in a collaborative Google Sheet. In order to improve the effectiveness of their campaigns across their marketing channels, WITHIN further segments the data into high and low LTV cohorts and shares the predictive insights with their clients for in-platform optimizations.
By distilling these types of LTV insights from BigQuery, WITHIN has been able to use those to empower their campaigns on Google Ads with a few notable success stories.
- WITHIN worked with a pet food company to analyze historical transactional data to model predicted LTV of new customers. They found significant differences between product category and autoship vs single order customers, and they implemented LTV-based optimization. As a result, they saw a 400% increase in average customer LTV.
- WITHIN helped a coffee brand increase their customer base by 560%, with the projected 12-month LTV of newly acquired customers jumping a staggering 1280%.
Through integration with Google AI Platform Notebooks, BigQuery also advanced WITHIN’s ability to use machine learning (ML) models. Today, the team can build and deploy models to predict dedicated campaign impact across channels without moving the data. The integration of clients’ LTV data through Google Ads has also impacted how WITHIN structures their clients’ accounts and how they make performance optimization decisions.
Now, WITHIN can capitalize on the entire data lifecycle: ingesting data from multiple sources into BigQuery, running data analytics, and empowering people with data by automatically visualizing data right in Google Data Studio or Google Sheets.A year ago, we delivered client reporting once a week. Now, it’s daily. Customers can view real-time campaign performance in Data Studio — all they have to do is refresh.
Evan Vaughan
Head of Data Science at WITHIN
Having a consistent nomenclature and being able to stitch together a unified code name has allowed WITHIN to scale their analytics. Today, WITHIN is able to create an internal Media Mix Modeling (MMM) tool with the help of Google Cloud that they’re trialing with their clients.
The overall unseen benefit of BigQuery was that it put WITHIN in a position to remain nimble and spot trends before other agencies when COVID-19 hit. This aggregated view of data allowed WITHIN to provide unique insights to serve their customers better and advise them on rapidly evolving conditions.
Ready to modernize your data analytics? Learn more about how Google BigQuery unlocks the insights hidden in your data.
Ahead of the Curve: 5 Data and AI Trends Set to Shape 2023

2252
Of your peers have already read this article.
4:00 Minutes
The most insightful time you'll spend today!
How will your organization manage this year’s data growth and business requirements? Your actions and strategies involving data and AI will improve or undermine your organization’s competitiveness in the months and years to come. Our teams at Google Cloud have an eye on the future as we evolve our strategies to protect technology choice, simplify data integration, increase AI adoption, deliver needed information on demand, and meet security requirements.
Google Cloud worked with* IDC on multiple studies involving global organizations across industries in order to explore how data leaders are successfully addressing key data and AI challenges. We compiled the results in our 2023 Data and AI Trends report. In it, you’ll find the metrics-rich research behind the top five data and AI trends, along with tips and customer examples for incorporating them into your plans.

1: Show data silos the door
Given the increasing volumes of data we’re all managing, it’s no surprise that siloed transactional databases and warehousing strategies can’t meet modern demands. Organizations want to improve how they store, manage, analyze, and govern all their data, while reducing costs. They also want to eliminate conflicting insights from replicated data and empower everyone with fresh data.
A unified data cloud enables the integration of data and insights into transformative digital experiences and better decision making.
Andi Gutmans, GM and VP of Engineering for Databases, Google Cloud
In the report, you can learn how to adopt a unified data cloud that supports every stage of the data lifecycle so that you can improve data usage, accessibility, and governance. Inform your strategy by drawing on organizations’ examples such as a data fabric that improves customer experiences by connecting more than 80 data silos, as well as other unified data clouds that save money and simplify growth.

2: Usher in the age of the open data ecosystem
Data is the key to unlocking AI, speeding up development cycles, and increasing ROI. To protect against data and technology lock-in, more organizations are adopting open source software and open APIs.
Tweet this quote
Understand how you can simplify data integration, facilitate multicloud analytics, and use the technologies you want with an open data ecosystem, as described in the report. Learn from metrics about global open source adoption and public dataset usage. And explore how global companies adopted open data ecosystems to improve patient outcomes, increase website traffic by 25%, and cut operating costs by 90%.

3: Embrace the AI tipping point
Pulling useful information out of data is easier with AI and ML. Not only can you identify patterns and answer questions faster but the technologies also make it easier to solve problems at scale.
We’ve reached the AI tipping point. Whether people realize it or not, we’re already using applications powered by AI—every day. Social media platforms, voice assistants, and driving services are easy examples.
June Yang, VP, Cloud AI and Industry Solutions, Google Cloud
Organizations share how they’re reaching their goals using AI and ML by empowering “citizen data scientists” and having them focus on small wins first. Gain tips from Yang and other experts for developing your AI strategy. And read how organizations achieve outcomes such as a reduction of 7,400 tons per year in carbon emissions and a more than 200% increase in ROI from ad spend by using pattern recognition and other AI capabilities.

4: Infuse insights everywhere
Yesterday’s BI solutions have led to outdated insights and user fatigue with the status quo, based on generic metrics and old information. Research shows that as new tools come online, expectations for BI are changing, with companies revising their strategies to improve decision making, speed up the development of new revenue streams, and increase customer acquisition and retention by providing individuals with needed information on demand.
Organizations are equipping business decision-makers with the tools they need to incorporate required insights into their everyday workflows.
Kate Wright, Senior Director, Product Management, Google Cloud
In the report, you’ll discover why and how data leaders are rethinking their BI analytics strategies and applications to improve users’ trust and use of data in automated workflows, customizable dashboards, and on-demand reports. Global companies also share how they improve decision making with self-service BI, customer experiences with IoT analysis, and threat mitigation with embedded analytics.

5: Get to know your unknown data
Increasing data volumes can make it harder to know where and what data they store, which may create risk. Case in point: If a customer unexpectedly shares personally identifiable information during a recorded customer support call or chat session, that data might require specialized governance, which the standardized storage process may not provide.
If you don’t know what data you have, you cannot know that it’s accurately secured. You also don’t know what security risks you are incurring, or what security measures you need to take.
Anton Chuvakin, Senior Staff Security Consultant, Google Cloud
Check out the report to learn about data security risks that are often overlooked and how to develop proactive governance strategies for your sensitive data. You can also read how global organizations have increased customer trust and productivity by improving how they discover, classify, and manage their structured and unstructured data.
Be ready for what’s next
What’s exciting about these trends is that they’re enabling organizations across industries to realize very different goals using their choice of technologies. And although all the trends depend on each other, research shows you can realize measurable benefits whether you adopt one or all five.
Review the report yourself and learn how you can refine your organization’s data and AI strategies by drawing on the collective insights, experiences, and successes of more than 800 global organizations.
6195
Of your peers have already watched this video.
13:00 Minutes
The most insightful time you'll spend today!
Google Cloud’s 2021 Data Analytics Launches
Google Cloud announced closed to 15 services and programs spanning database, analytics, business intelligence and AI to help businesses gain value out of their data. Here’s a rundown of announcements throughout 2021 on analytics solutions and services such as Dataplex, an intelligent data fabric solution, Datastream, a serverless change data capture and replication service and Google Cloud analytics hub. Watch the video to get started with Google Cloud’s Data Analytics offerings.
BigQuery Admin Reference Guide Series: How to Optimize Data in Your Native Storage
3727
Of your peers have already read this article.
4:00 Minutes
The most insightful time you'll spend today!
So far on the BigQuery Admin Reference Guide series, we’ve talked about the different logical resources available inside of BigQuery. Now, we’re going to begin talking about BigQuery’s architecture. In this post we’re diving into how BigQuery stores your data in native storage, and what levers you can pull to optimize how your data is stored.
Columnar storage format
BigQuery offers fully managed storage, meaning you don’t have to provision servers. Sizing is done automatically and you only pay for what you use. Because BigQuery was designed for large scale data analytics data is stored in columnar format.
Traditional relational databases, like Postgres and MySQL, store data row-by-row in record-oriented storage. This makes them great for transactional updates and OLTP (Online Transaction Processing) use cases because they only need to open up a single row to read or write data. However, if you want to perform an aggregation like a sum of an entire column, you would need to read the entire table into memory.
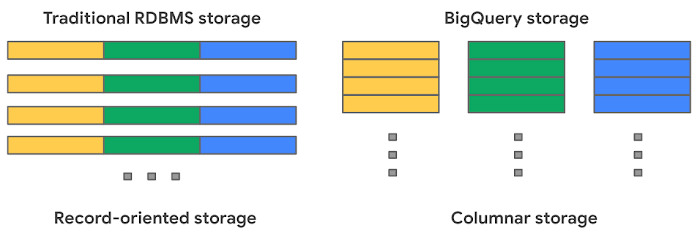
BigQuery uses columnar storage where each column is stored in a separate file block. This makes BigQuery an ideal solution for OLAP (Online Analytical Processing) use cases. When you want to perform aggregations you only need to read the column that you are aggregating over.
Optimized storage format
Internally, BigQuery stores data in a proprietary columnar format called Capacitor. We know Capacitor is a column-oriented format as discussed above. This means that the values of each field, or column, are stored separately so the overhead of reading the file is proportional to the number of fields you actually read. This doesn’t necessarily mean that each column is in its own file, it just means that each column is stored in a file block, which is actually compressed independently for increased optimization.
What’s really cool is that Capacitor builds an approximation model that takes in relevant factors like the type of data (e.g. a really long string vs. an integer) and usage of the data (e.g. some columns are more likely to be used as filters in WHERE clauses) in order to reshuffle rows and encode columns. While every column is being encoded, BigQuery also collects various statistics about the data — which are persisted and used later during query execution.
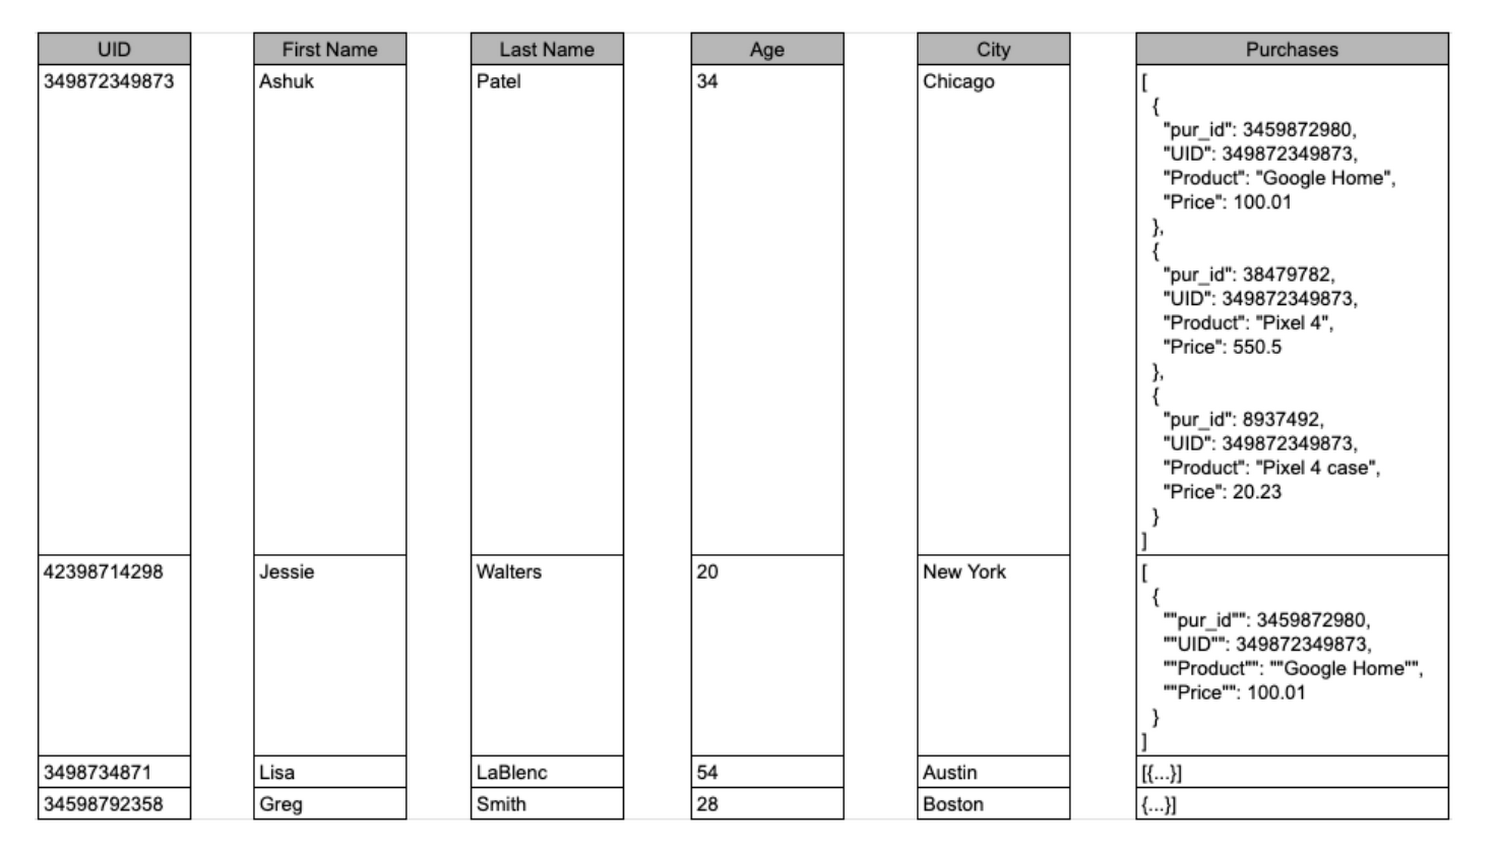
If you want to learn more about Capacitor, check out this blog post from Google’s own Chief BigQuery Officer.
Encryption and managed durability
Now that we understand how the data is saved in specific files, we can talk about where these files actually live. BigQuery’s persistence layer is provided by Google’s distributed file system, Colossus, where data is automatically compressed, encrypted, replicated, and distributed.
There are many levels of defense against unauthorized access in Google Cloud Platform, one of them being that 100% of data is encrypted at rest. Plus, if you want to control encryption yourself, you can use customer-managed encryption keys.
Colossus also ensures durability by using something called erasure encoding – which breaks data into fragments and saves redundant pieces across a set of different disks. However, to ensure the data is both durable and available, the data is also replicated to another availability zone within the same region that was designated when you created your dataset.
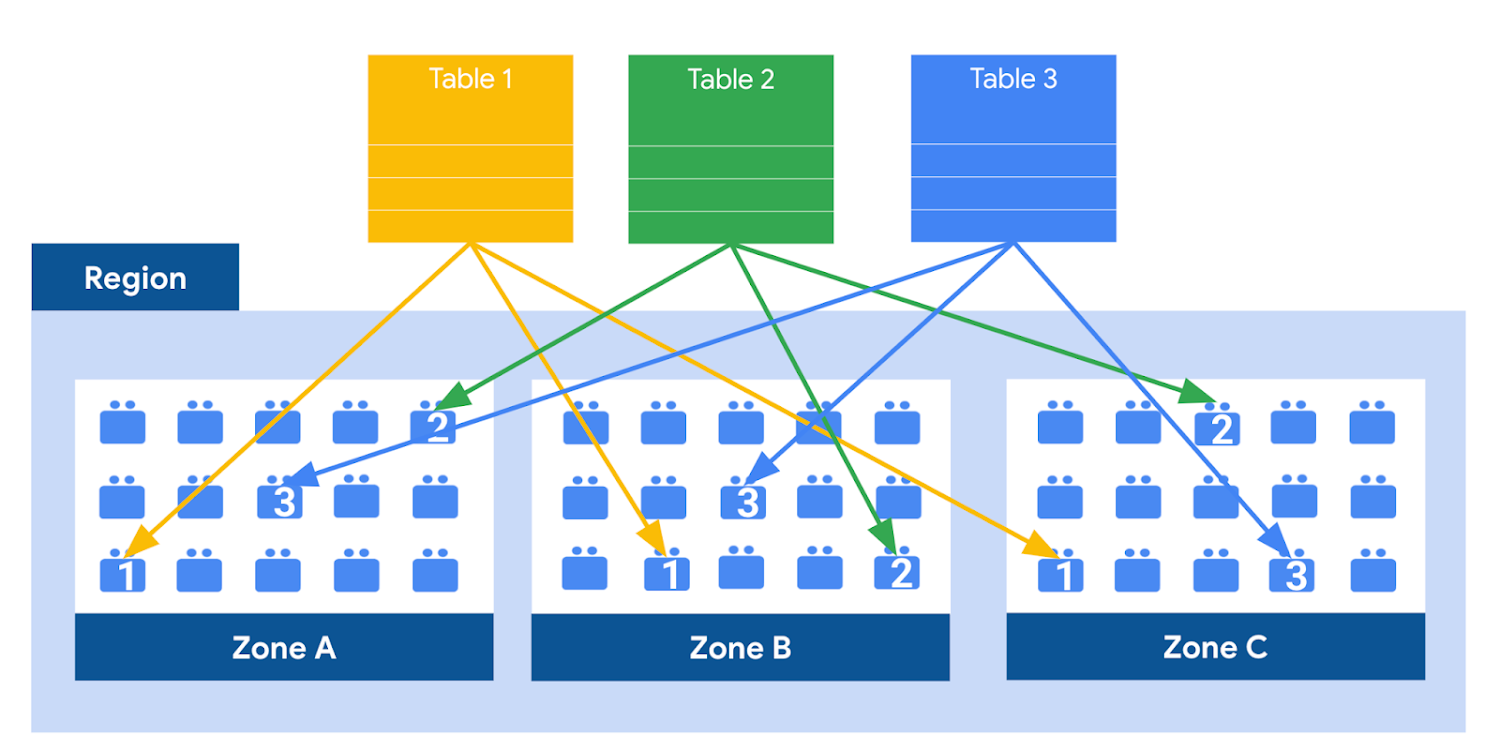
This means data is saved in a different building that has a different power system and network. The chances of multiple availability zones going offline at once is very small. But if you use “Multi-Region” locations – like the US or EU – BigQuery stores another copy of the data in an off-region replica. That way, the data is recoverable in the event of a major disaster.
This is all accomplished without impacting the compute resources available for your queries. Plus encoding, encryption and replication are included in the price of BigQuery storage – no hidden costs!
Optimizing storage for query performance
BigQuery has a built-in storage optimizer that helps arrange data into the optimal shape for querying, by periodically rewriting files. Files may be written first in a format that is fast to write but later BigQuery will format them in a way that is fast to query. Aside from the optimization happening behind the scenes, there are also a few things you can do to further enhance storage.
Partitioning
A partitioned table is a special table that is divided into segments, called partitions. BigQuery leverages partitioning to minimize the amount of data that workers read from disk. Queries that contain filters on the partitioning column can dramatically reduce the overall data scanned, which can yield improved performance and reduced query cost for on-demand queries. New data written to a partitioned table is automatically delivered to the appropriate partition.
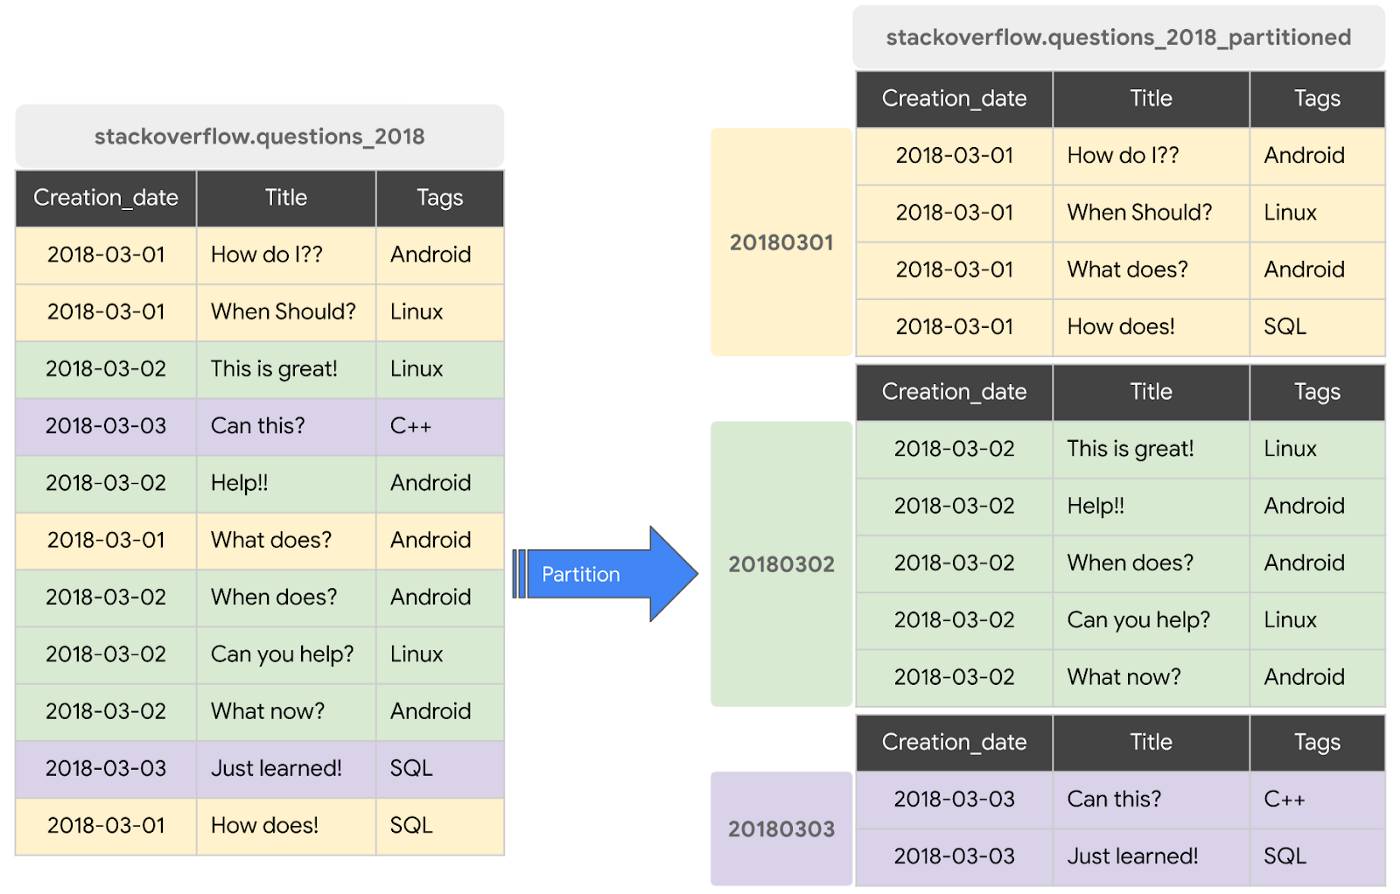
BigQuery supports the following ways to create partitioned tables:
- Ingestion time partitioned tables: daily partitions reflecting the time the data was ingested into BigQuery. This option is useful if you’ll be filtering data based on when new data was added. For example, the new Google Trends Dataset is refreshed each day, you might only be interested in the latest trends.
- Time-unit column partitioned tables: BigQuery routes data to the appropriate partition based on date value in the partitioning column. You can create partitions with granularity starting from hourly partitioning. This option is useful if you’ll be filtering data based on the date value in the table, for example looking at the most recent transactions by including a WHERE clause for transaction_created_date
- INTEGER range partitioned tables: Partitioned based on an integer column that can be bucketed. This option is useful if you’ll be filtering data based on an integer column in the table, for example focusing on specific customers using customer_id. You can bucket the integer values to create appropriately sized partitions, like having all customers with IDs from 0-100 in the same partition.
Partitioning is a great way to optimize query performance, especially for large tables that are often filtered down during analytics. When deciding on the appropriate partition key, make sure to consider how everyone in your organization is leveraging the table. For large tables that could cause some expensive queries, you might want to require partitions to be used.
Partitions are designed for places where there is a large amount of data and a low number of distinct values. A good rule of thumb is making sure partitions are greater than 1 GB. If you over partition your tables, you’ll create a lot of metadata – which means that reading in lots of partitions may actually slow down your query.
Clustering
When a table is clustered in BigQuery, the data is automatically sorted based on the contents of one or more columns (up to 4, that you specify). Usually high cardinality and non-temporal columns are preferred for clustering, as opposed to partitioning which is better for fields with lower cardinality. You’re not limited to choosing just one, you can have a single table that is both partitioned and clustered!
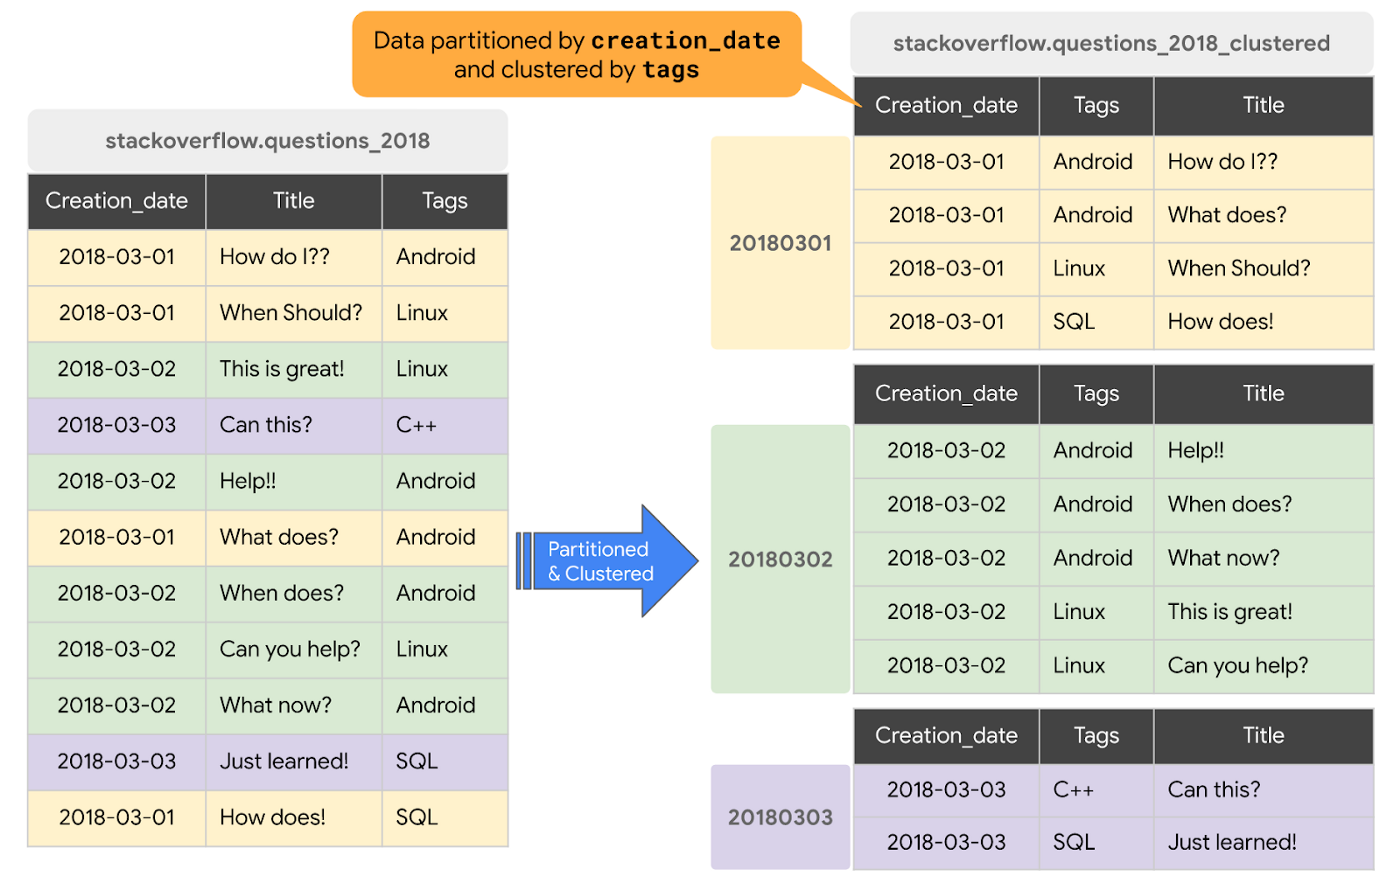
The order of clustered columns determines the sort order of the data. When new data is added to a table or a specific partition, BigQuery performs free, automatic re-clustering in the background. Specifically, clustering can improve the performance for queries:
- Containing where clauses with a clustered column: BigQuery uses the sorted blocks to eliminate scans of unnecessary data. The order of the filters in the where clause matters, so use filters that leverage clustering first
- That aggregate data based on values in a clustered column: performance is improved because the sorted blocks collocate rows with similar values
- With joins where the join key is used to cluster the table: less data is scanned, for some queries this offers a performance boost over partitioning!
Looking for some more information and example queries? Check out this blog post!
Denormalizing
If you come from a traditional database background, you’re probably used to creating normalized schemas – where you optimize your structure so that data is not repeated. This is important for OLTP workloads (as we discussed earlier) because you’re often making updates to the data. If your customer’s address is stored every place they have made a purchase, then it might be cumbersome to update their address if it changes.
However, when performing analytical operations on normalized schemas, usually multiple tables need to be joined together. If we instead denormalize our data, so that information (like the customer address) is repeated and stored in the same table, then we can eliminate the need to have a JOIN in our query. For BigQuery specifically, we can also take advantage of support for nested and repeated structures. Expressing records using STRUCTs and ARRAYs can not only provide a more natural representation of the underlying data, but in some cases it can also eliminate the need to use a GROUP BY statement. For example, using ARRAY_LENGTH instead of COUNT.
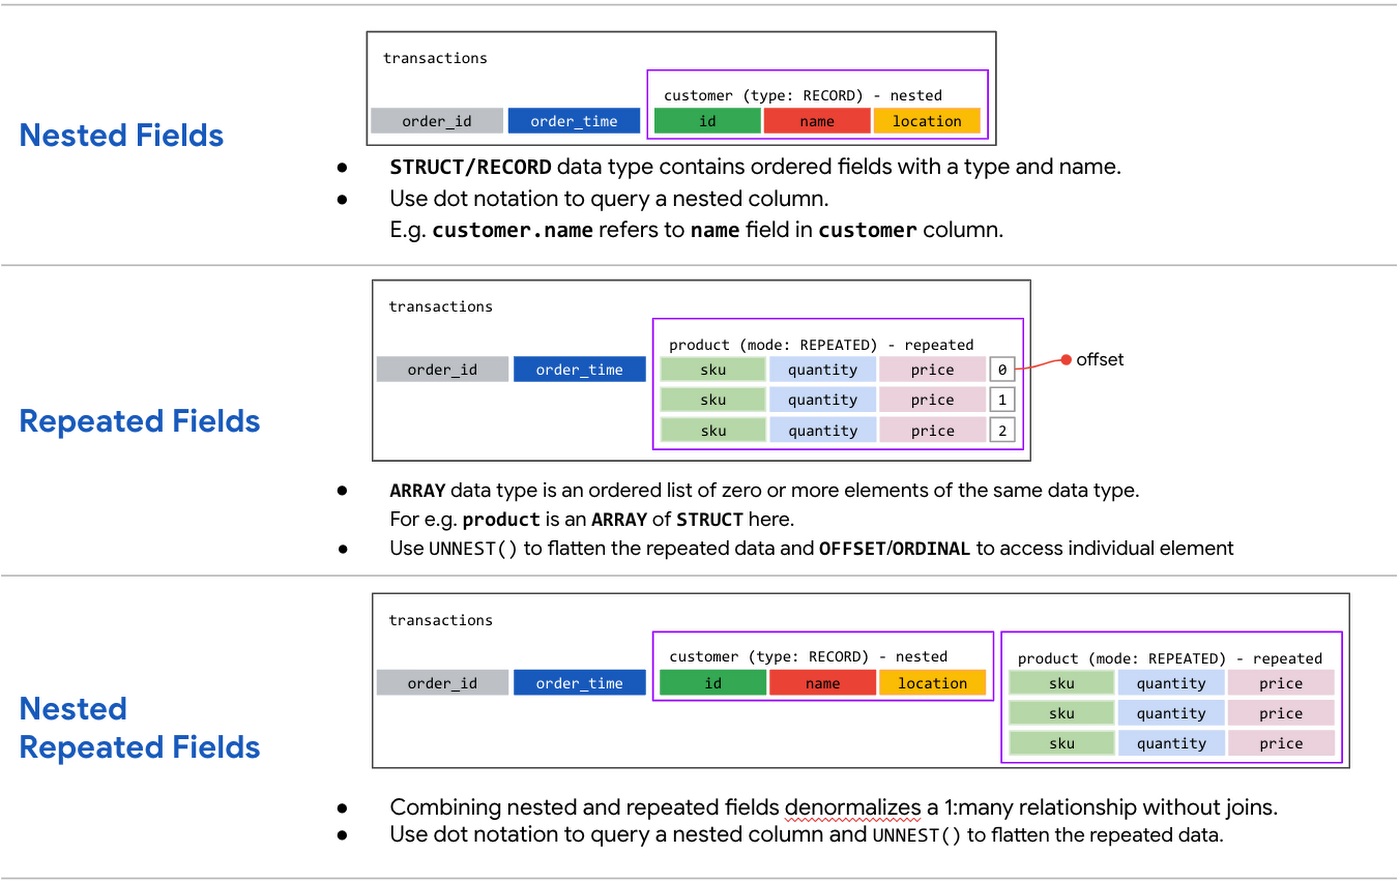
Keep in mind that denormalization has some disadvantages. First off, they aren’t storage-optimal. Although, many times the low cost of BigQuery storage addresses this concern. Second, maintaining data integrity can require increased machine time and sometimes human time for testing and verification. We recommend that you prioritize partitioning and clustering before denormalization, and then focus on data that rarely requires updates.
Optimizing for storage costs
When it comes to optimizing storage costs in BigQuery, you may want to focus on removing unneeded tables and partitions. You can configure the default table expiration for your datasets, configure the expiration time for your tables, and configure the partition expiration for partitioned tables. This can be especially useful if you’re creating materialized views or tables for ad-hoc workflows, or if you only need access to the most recent data.
Additionally, you can take advantage of BigQuery’s long term storage. If you have a table that is not used for 90 consecutive days, the price of storage for that table automatically drops by 50 percent to $0.01 per GB, per month. This is the same cost as Cloud Storage Nearline, so it might make sense to keep older, unused data in BigQuery as opposed to exporting it to Cloud Storage.Thanks for tuning in this week! Next week, we’re talking about query processing – a precursor to some query optimization techniques that will help you troubleshoot and cut costs. Be sure to stay up-to-date on this series by following me on LinkedIn and Twitter!
More Relevant Stories for Your Company

How Google Cloud & NGIS’ Partnership Powers Sustainability & Responsible Sourcing for Consumer Brands
In the competitive world of consumer goods, sustainability matters more than ever. In recent Google survey, 82% of consumers said sustainability is more top of mind now than it was before COVID-191 and 78% said that big businesses have a role to play in helping to fight climate change.2 As well as delivering on

5 Reasons Your Legacy Data Warehouse Won’t Cut It
As we engage with enterprises across the globe, one thing is becoming clear: Today’s businesses are solving complex business problems that are data-intensive. But often, their data platform infrastructure is holding them back. Data platform architectures that were designed in the 1990s are not ready to solve business problems for

A Recap on Google Cloud Databases and Storage Options- Part 2
Isaac Newton said, “If I have seen farther than others it is because I have stood on the shoulders of giants.” He meant that in order to explain the Law of Gravity, he used the work of major thinkers who came before him in order to make intellectual progress (as-in

Turning the Tide: How PrestaShop Regained Trust in Data
Since 2007, PrestaShop has helped companies unlock the power of e-commerce through its open-source platform. Over 300,000 merchants worldwide use the PrestaShop platform to grow their business and serve online shoppers. "Our open-source strategy to ecommerce enablement sets us apart," says Rémi Paulin, Ph.D., Data Architect at PrestaShop. "Customization is
