





3347
Of your peers have already watched this video.
28:03 Minutes
The most insightful time you'll spend today!
Crux Accelerates Data Operations with Google BigQuery
Being in the constantly evolving and changing data business, Crux Informatics has integrated with Google Cloud and BigQuery to achieve the benefits of a data cloud, including fully managed global scale, load management, high performance, and genuinely good support.
Watch this video to learn more about how this partnership will help Crux get success with BigQuery.
Make Meaningful Analysis with Geo Boundary Public Datasets on BigQuery

6338
Of your peers have already read this article.
4:00 Minutes
The most insightful time you'll spend today!
Geospatial data is a critical component for a comprehensive analytics strategy. Whether you are trying to visualize data using geospatial parameters or do deeper analysis or modeling on customer distribution or proximity, most organizations have some type of geospatial data they would like to use – whether it be customer zipcodes, store locations, or shipping addresses. However, converting geographic data into the correct format for analysis and aggregation at different levels can be difficult. In this post, we’ll walk through some examples of how you can leverage the Google Cloud platform alongside Google Cloud Public Datasets to perform robust analytics on geographic data. The full queries can be accessed from this notebook here.
Public US Geo Boundaries dataset
BigQuery hosts a slew of public datasets for you to access and integrate into your analytics. Google pays for the storage of these datasets and provides public access to the data via the bigquery-public-data project. You only pay for queries against the data. Plus, the first 1 TB per month is free! These public datasets are valuable on their own, but when joined against your own data they can unlock new analytics use cases and save the team a lot of time.
Within the Google Cloud Public Datasets Program there are several geographic datasets. Here, we’ll work with the geo_us_boundaries dataset, which contains a set of tables that have the boundaries of different geospatial areas as polygons and coordinates based on the center point (GEOGRAPHY column type in BigQuery), published by the US Census Bureau.

Mapping geospatial points to hierarchical areas
Many times you will find yourself in situations where you have a string representing an address. However, most tools require lat/long coordinates to actually plot points. Using the Google Maps Geocoding API we can convert an address into a lat/long and then store the results in the BigQuery table.
With a lat/long representation of our point, we can join our initial dataset back onto any of the tables here using the ST_WITHIN function. This allows us to check and see if a point is within the specified polygon.
ST_WITHIN(geography_1, geography_2)
This can be helpful for ensuring standard nomenclature; for example, metropolitan areas that might be named differently. The query below maps each customers’ address to a given metropolitan area name.
SELECTcust.id as customer_id,metro.name as metro_nameFROM `looker-private-demo.retail.customers` as cust,`bigquery-public-data.geo_us_boundaries.metropolitan_divisions` as metroWHERE ST_WITHIN(ST_GEOGPOINT(cust.longitude, cust.latitude),metro.metdiv_geom)
It can also be useful for converting to designated market area (DMA), which is often used in creating targeted digital marketing campaigns.
SELECTcust.id as customer_id,dma.dma_nameFROM `looker-private-demo.retail.customers` as cust,`bigquery-public-data.geo_us_boundaries.designated_market_area` as dmaWHERE ST_WITHIN(ST_GEOGPOINT(cust.longitude, cust.latitude),dma.dma_geom)
Or for filling in missing information; for example, some addresses may be missing zip code which results in incorrect calculations when aggregating up to the zipcode level. By joining onto the zip_codes table we can ensure all coordinates are mapped appropriately and aggregate up from there.
SELECTzip.zip_code,count(distinct cust.id) as unique_customersFROM `looker-private-demo.retail.customers` as cust,`bigquery-public-data.geo_us_boundaries.zip_codes` as zipWHERE ST_WITHIN(ST_GEOGPOINT(cust.longitude, cust.latitude),zip.zip_code_geom)GROUP BY 1
Note that the zip code table isn’t a comprehensive list of all US zip codes, they are zip code tabulation areas (ZCTAs). Details about the differences can be found here. Additionally, the zip code table gives us hierarchical information, which allows us to perform more meaningful analytics. One example is leveraging hierarchical drilling in Looker. I can aggregate my total sales up to the country level, and then drill down to state, city and zipcode to identify where sales are highest. You can also use the BigQuery GeoViz tool to visualize geospatial data!

Aside from simply checking if a point is within an area, we can also use ST_DISTANCE to do something like find the closest city using the centerpoint for the metropolitan area table.
SELECTcust.id as customer_id,ARRAY_AGG(metro.name order by ST_DISTANCE(ST_GEOGPOINT(cust.longitude, cust.latitude),metro.internal_point_geom) asc limit 1)[offset(0)] as metro_nameFROM`looker-private-demo.retail.customers` as cust,`bigquery-public-data.geo_us_boundaries.metropolitan_divisions` as metroGROUP BY cust.id
This concept doesn’t just hold true for points, we can also leverage other GIS functions to see if a geospatial area is contained within areas that are listed in the boundaries datasets. If your data comes into BigQuery as a GeoJSON string, we can convert it to a GEOGRAPHY type using the ST_GEOGFROMGEOJSON function. Once our data is in a GEOGRAPHY type we can do things like check to see what urban area the geo is within – using either ST_WITHIN or ST_INTERSECTS to account for partial coverage. Here, I am using the customer’s zip code to find all metropolitan divisions where the zip code polygon and the metropolitan polygon intersect. I am then selecting the metropolitan area that has the most overlap (or the intersection has the largest area) to be the customer’s metro that we use for reporting.
SELECTcust.id as customer_id,ARRAY_AGG(metro.name order by ST_AREA(ST_INTERSECTION(zip.zip_code_geom,metro.metdiv_geom)) desc limit 1)[offset(0)] as metro_nameFROM`looker-private-demo.retail.customers` as custJOIN `bigquery-public-data.geo_us_boundaries.zip_codes` as zip on cust.zip=zip.zip_code,`bigquery-public-data.geo_us_boundaries.metropolitan_divisions` as metroWHERE ST_INTERSECTS(zip.zip_code_geom,metro.metdiv_geom)GROUP BY cust.id
The same ideas can be applied to the other tables in the dataset including the county, urban areas and National Weather Service forecast regions (which can also be useful if you want to join your datasets onto weather data).
Correcting for data discrepancy
One problem that we may run into when working with geospatial data is that different data sources may have different representations of the same information. For example, you might have one system that records state as a two letter abbreviation and another using the full name. Here, we can use the state table to join the different datasets.
SELECTst.state_name,sum(ab.sales+fn.sales) as total_salesFROM `bigquery-public-data.geo_us_boundaries.states` as stLEFT JOIN abbreviated_table as ab on ab.state = st.stateLEFT JOIN fullname_table as fn on fn.state = st.state_nameWHERE COALESCE(ab.state, fn.state) IS NOT NULLGROUP BY 1
Another example might be using the tables as a source of truth for fuzzy matching. If the address is a manually entered field somewhere in your application, there is a good chance that things will be misspelled. Different representations of the same name may prevent tables from joining with each other or lead to duplicate entries when performing aggregations. Here, I use a simple Soundex algorithm to generate a code for each county name, using helper functions from this blog post. We can see that even though some are misspelled they have the same Soundex code.

Next, we can join back onto our counties table so we make sure to use the correct spelling of the county name. Then, we can simply aggregate our data for more accurate reporting.
SELECTc.county_name,sum(sales) as total_salesFROMtableJOIN `bigquery-public-data.geo_us_boundaries.counties` as con testing.dq_fm_Soundex(table.county) = testing.dq_fm_Soundex(c.county_name)WHERE c.state_fips_code = cast(36 as string)GROUP BY 1
Note that fuzzy matching definitely isn’t perfect and you might need to try different methods or apply certain filters for it to work best depending on the specifics of your data.
The US Geo Boundary datasets allow you to perform meaningful geographic analysis without needing to worry about extracting, transforming or loading additional datasets into BigQuery. These datasets, along with all the other Google Cloud Public Datasets, will be available in the Analytics Hub. Please sign up for the Analytics Hub preview, which is scheduled to be available in the third quarter of 2021, by going to g.co/cloud/analytics-hub.

Google Leads the Pack in Big Data NoSQL Market: Forrester Research
DOWNLOAD RESEARCH REPORTS4148
Of your peers have already downloaded this article
2:30 Minutes
The most insightful time you'll spend today!
NoSQL has become critical for all businesses to support modern business applications. It has gone from supporting simple schemaless apps to becoming a mission-critical data platform for large Fortune 1000 companies. It has already disrupted the database market, which was dominated for decades by relational database vendors.
Today, half of global data and analytics technology decision makers either have implemented or are implementing NoSQL platforms, taking advantage of the benefits of a flexible database that serves a broad range of use cases.
Analyst firm Forrester Research in its recent report has named Google Cloud a leader in the Big Data NoSQL market as it supports a broader set of use cases, automation, good scalability and performance, and security offerings.
Download this Forrester Research report to understand why enterprises are turning to NoSQL and why Google Cloud is a leader in this space.
Ahead of the Curve: 5 Data and AI Trends Set to Shape 2023

2255
Of your peers have already read this article.
4:00 Minutes
The most insightful time you'll spend today!
How will your organization manage this year’s data growth and business requirements? Your actions and strategies involving data and AI will improve or undermine your organization’s competitiveness in the months and years to come. Our teams at Google Cloud have an eye on the future as we evolve our strategies to protect technology choice, simplify data integration, increase AI adoption, deliver needed information on demand, and meet security requirements.
Google Cloud worked with* IDC on multiple studies involving global organizations across industries in order to explore how data leaders are successfully addressing key data and AI challenges. We compiled the results in our 2023 Data and AI Trends report. In it, you’ll find the metrics-rich research behind the top five data and AI trends, along with tips and customer examples for incorporating them into your plans.

1: Show data silos the door
Given the increasing volumes of data we’re all managing, it’s no surprise that siloed transactional databases and warehousing strategies can’t meet modern demands. Organizations want to improve how they store, manage, analyze, and govern all their data, while reducing costs. They also want to eliminate conflicting insights from replicated data and empower everyone with fresh data.
A unified data cloud enables the integration of data and insights into transformative digital experiences and better decision making.
Andi Gutmans, GM and VP of Engineering for Databases, Google Cloud
In the report, you can learn how to adopt a unified data cloud that supports every stage of the data lifecycle so that you can improve data usage, accessibility, and governance. Inform your strategy by drawing on organizations’ examples such as a data fabric that improves customer experiences by connecting more than 80 data silos, as well as other unified data clouds that save money and simplify growth.

2: Usher in the age of the open data ecosystem
Data is the key to unlocking AI, speeding up development cycles, and increasing ROI. To protect against data and technology lock-in, more organizations are adopting open source software and open APIs.
Tweet this quote
Understand how you can simplify data integration, facilitate multicloud analytics, and use the technologies you want with an open data ecosystem, as described in the report. Learn from metrics about global open source adoption and public dataset usage. And explore how global companies adopted open data ecosystems to improve patient outcomes, increase website traffic by 25%, and cut operating costs by 90%.
3: Embrace the AI tipping point
Pulling useful information out of data is easier with AI and ML. Not only can you identify patterns and answer questions faster but the technologies also make it easier to solve problems at scale.
We’ve reached the AI tipping point. Whether people realize it or not, we’re already using applications powered by AI—every day. Social media platforms, voice assistants, and driving services are easy examples.
June Yang, VP, Cloud AI and Industry Solutions, Google Cloud
Organizations share how they’re reaching their goals using AI and ML by empowering “citizen data scientists” and having them focus on small wins first. Gain tips from Yang and other experts for developing your AI strategy. And read how organizations achieve outcomes such as a reduction of 7,400 tons per year in carbon emissions and a more than 200% increase in ROI from ad spend by using pattern recognition and other AI capabilities.
4: Infuse insights everywhere
Yesterday’s BI solutions have led to outdated insights and user fatigue with the status quo, based on generic metrics and old information. Research shows that as new tools come online, expectations for BI are changing, with companies revising their strategies to improve decision making, speed up the development of new revenue streams, and increase customer acquisition and retention by providing individuals with needed information on demand.
Organizations are equipping business decision-makers with the tools they need to incorporate required insights into their everyday workflows.
Kate Wright, Senior Director, Product Management, Google Cloud
In the report, you’ll discover why and how data leaders are rethinking their BI analytics strategies and applications to improve users’ trust and use of data in automated workflows, customizable dashboards, and on-demand reports. Global companies also share how they improve decision making with self-service BI, customer experiences with IoT analysis, and threat mitigation with embedded analytics.
5: Get to know your unknown data
Increasing data volumes can make it harder to know where and what data they store, which may create risk. Case in point: If a customer unexpectedly shares personally identifiable information during a recorded customer support call or chat session, that data might require specialized governance, which the standardized storage process may not provide.
If you don’t know what data you have, you cannot know that it’s accurately secured. You also don’t know what security risks you are incurring, or what security measures you need to take.
Anton Chuvakin, Senior Staff Security Consultant, Google Cloud
Check out the report to learn about data security risks that are often overlooked and how to develop proactive governance strategies for your sensitive data. You can also read how global organizations have increased customer trust and productivity by improving how they discover, classify, and manage their structured and unstructured data.
Be ready for what’s next
What’s exciting about these trends is that they’re enabling organizations across industries to realize very different goals using their choice of technologies. And although all the trends depend on each other, research shows you can realize measurable benefits whether you adopt one or all five.
Review the report yourself and learn how you can refine your organization’s data and AI strategies by drawing on the collective insights, experiences, and successes of more than 800 global organizations.
6176
Of your peers have already watched this video.
18:00 Minutes
The most insightful time you'll spend today!
An Overview of Google’s Data Cloud
Data access, management and privacy has been at the center of priorities for enterprises that are aiming to be more agile, reliable and data-driven. Google Cloud’s technology innovations spanning products like BigQuery, Spanner, Looker and VertexAI help organizations navigate the complexities related to siloed data in large volumes sprawled across databases, data lakes, data warehouses, and data marts in multiple clouds and on-premises. Watch the video to learn how companies are building data on Google Cloud for better analysis, security and management to achieve bottomline!
Incorporating Custom Holidays into Your Time-Series Models with BigQuery ML

1120
Of your peers have already read this article.
4:30 Minutes
The most insightful time you'll spend today!
About three years ago, JCB, one of the biggest Japanese payment companies, launched a project to develop new high-value services with agility. We set up a policy of starting small from scratch without using the existing system, which we call the concept of “Dejima”, where we focused on improving various aspects such as team structure, risk management, and application and platform development process.
Until now, large Japanese enterprises have built decision-making systems focused on eliminating unnecessary business processes and efficiently increasing quarterly profits. As a result, we are seeing more organizational structures that make it difficult to take on new challenges or experiments with trial and error. We wanted to breathe a new life into this situation, and that is how the concept of Dejima came up. In the Edo period, Japan closed its national border to other countries under its national isolation policy. At the time, Dejima was the only area where special rules were applied and allowed people from different cultures to come and go, and trade. This special rule generated the culture of inclusion and led to Dejima’s prosperity. Like Dejima, we believe that creating an organization that is independent from other business practices can be effective in enabling digital transformation for the organization.
We have been able to make this transformation with the direct help of the Google Cloud and its products such as Google Kubernetes Engine (GKE), Cloud Spanner and Anthos Service Mesh, applying domain-driven design and microservice architecture. We named this the “JCB Digital Enablement Platform (JDEP),” which now hosts multiple business critical production services.
A key benefit of GKE is that the team can easily add resources and release them when they are finished, allowing them to be flexible to accommodate busy periods and off-seasons. Meanwhile, Anthos Service Mesh helps us manage complex environments easily. With containerization and managed services, we are prepared for the future for when more services go into production, as it would be easy to maintain and provide version upgrade support. At the same time, Cloud Spanner ensures that we maintain a 99.99% availability at all times.
Our initial motivation for introducing SRE practices was to break proverbial walls between business, development and operations, which was a success. Now we are focused on ensuring its reliability and maintaining customer satisfaction with our SRE practices.
To ensure the success of SRE practices that we implemented, there were a few categories we needed to address, from defining the organizational culture and practices to ensuring the policies attached to the new models created were practical enough to be implemented on the ground level. This is so that the Dejima concept remains sustainable for the long run.
Instilling a culture of measurement
Here, “appropriate” reliability is the key. According to the conventional way of thinking at JCB, “service failure must not occur” and “SLA should be maintained as high as possible.” We started by discussing what was the “appropriate reliability” that our customers really needed, but it was not as easy as we thought because the level of reliability for user satisfaction differed from application to application.
Eventually, the business, development and operations teams formulated specific SLIs and SLOs together, something we would never have been able to do if we discussed separately. This is because the business is required to compromise on lower service levels, since our reliability standard used to be too high. The collaboration of development and operations teams is necessary to understand how our system works upon our users’ interactions.
After Google Cloud helped us run a series of workshops where all teams participated, we saw change within the organization. The business team started evangelizing SRE to other members in the business department, and the development and operations teams started collaborating autonomously. We felt like we were working at Google speed, accomplishing so much in a short amount of time.
Understanding SRE as an entire company is necessary to progress. We are now working on creating internal training materials to spread the SRE concept throughout the company.
Eliminating ambiguity
With the cooperation of Google Cloud, we have created a Team Charter that defines the team’s mission, values and engagement models. We also created policy documents that include Incident Response Policy, Postmortem Policy, On-call Policy, Toil Policy and Error Budget Policy, to eliminate ambiguity in day-to-day operations.
For example, when an incident occurs, we can identify exactly the level of importance, the roles that are assigned to each person, and in what order they need to follow. When to do a postmortem, who owns it? What to do if the error budget is exhausted? How do other teams reach out to SRE when they have problems? The written policy documents will dramatically improve efficiency and motivate teams to adopt a culture of learning from failures.
The format for such policies are written in Google’s SRE book, but when we adopt it, it needs to take into account the circumstances specific to our company. Simply copying an existing policy won’t work, which is why it’s important to formulate a policy that fits the situation each team is in.
Reformalizing teams
Based on these policies, JCB’s SRE team has two sub-teams. One is called Sheriff which works as the platform SRE, and provides infrastructure services for the application team. The other is called the Diplomat which works as the embedded SRE, and participates in the application team to lead productionisation. There is also a team called Architecture that is separate from the SRE teams whose role is to consult SRE on system design and review architecture.
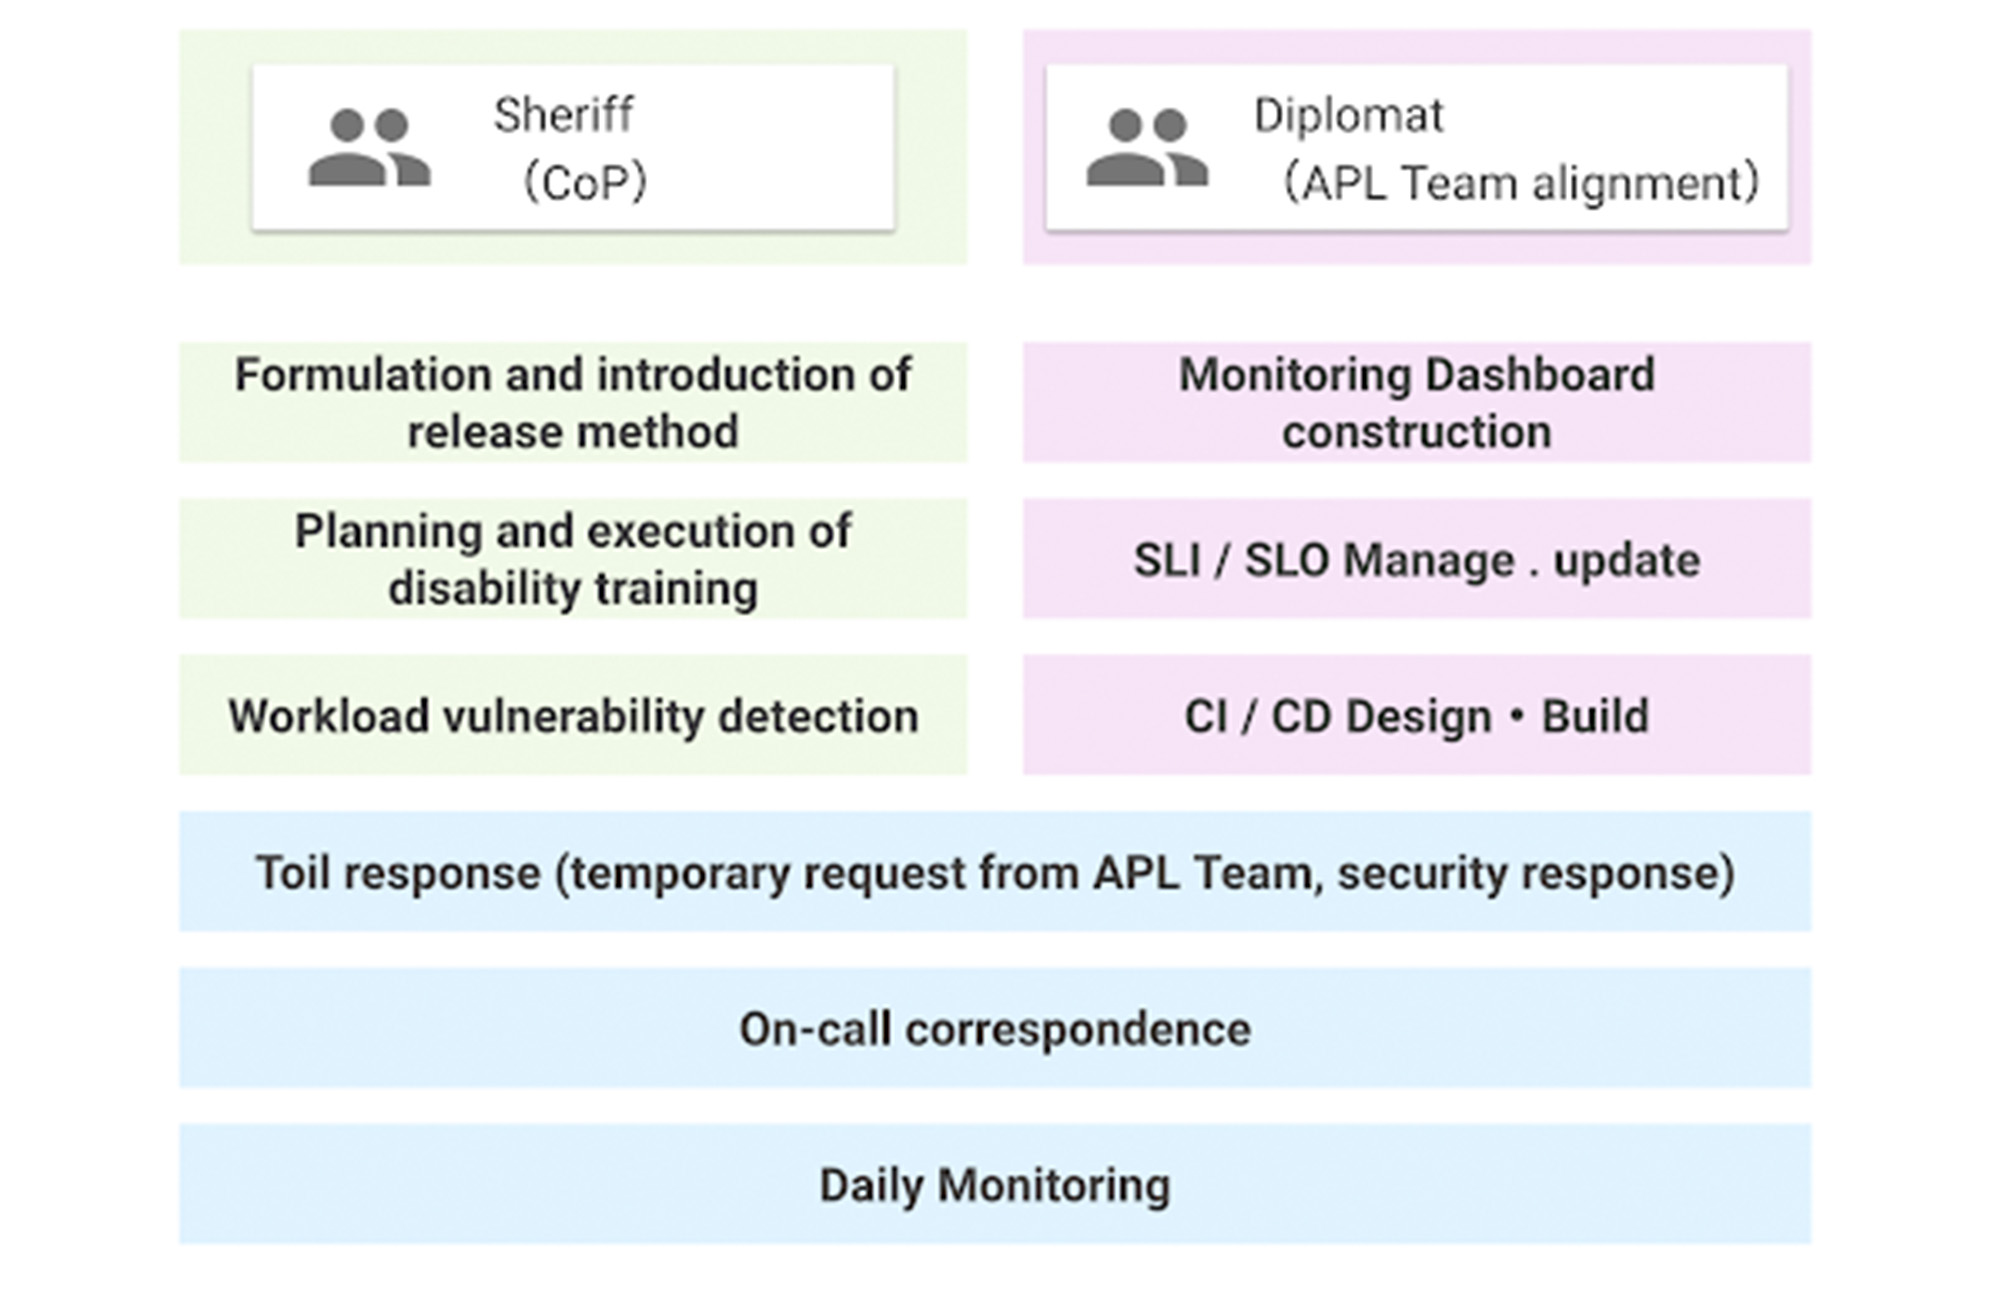
The SRE team was a single role when it was first launched, but now has two sub-teams. This is because as the number of application teams increases, the number of support tasks for the teams also increases, which can result in a shortage of resources to work on overall improvement. Securing people who are not interrupted from day-to-day support tasks and focusing on the main task improves efficiency.
Whereas both sub-teams share the on-call duty, some engineers are not allowed to do it by contract as they are not allowed to get paged. For those who cannot participate in on-call duties, we created what’s called a Toil Shift, which allows them to focus on resolving tickets in our backlogs instead.
This works well so far, but we will keep evolving as our business grows.
More Relevant Stories for Your Company




Pega Systems Migrates SAP Servers to Google Cloud in Just 9 Weeks!
Pega Systems' financial data on SAP environs were on a hosting platform that lacked agility. By moving nearly 30 SAP servers to Google Cloud in just 9 weeks, Pega Systems was able to unlock data and integrate BigQuery into SAP HANA to deliver personalization for clients and embark on an

Daffodil Software Saves Hundreds of Hours Managing Databases with Google Cloud SQL
Daffodil Software is an India-based information technology services company with 180 employees and satellite offices in the US, Singapore, and the United Arab Emirates. Its product: A suite of web-based applications, including a business customer relationship management (CRM) program and an enterprise resource planning (ERP) app for schools. Daffodil’s Challenge

Google Cloud Data Heroes Series: Honoring Data Practitioner’s Journey and Learning with GCP
Google Cloud Data Heroes is a series where we share stories of the everyday heroes who use our data analytics tools to do amazing things. Like any good superhero tale, we explore our Google Cloud Data Heroes’ origin stories, how they moved from data chaos to a data-driven environment, what

Harnessing the Power of Data and AI to Transform Life Science Supply Chains
Global life science supply chains are lengthy and complex with many moving parts. One small disruption can create serious delays and affect your ability to deliver therapeutics for patients. Supply chain disruptors Over the last few years, healthcare organizations have encountered a range of obstacles, from both internal and external
