






4195
Of your peers have already downloaded this article
10:47 Minutes
The most insightful time you'll spend today!
GKE Feature Guide: 5 Ways to Optimize Your Kubernetes Clusters

1577
Of your peers have already read this article.
7:00 Minutes
The most insightful time you'll spend today!
In this post, we’ll be discussing 5 features in GKE you can use to optimize your clusters today. To get started with testing these in GKE, check out our interactive tutorials for getting started with standard and autopilot clusters.
If you find value from running workloads on Kubernetes clusters in your organization, chances are your footprint will grow – be it through larger clusters or more clusters.
Whichever your approach, one thing is certain: you’ll have more resources that you pay for. And you know what they say – more resources, more problems. The more resources you have across clusters, the more critical it becomes to make sure you’re using them efficiently.
Google Kubernetes Engine has numerous features built-in that you as a cluster admin can use to navigate this continuous journey of optimizing your use of resources in GKE.
Let’s review five of them you can get started with today.
#1 – Cluster view cost optimization in the console
If you don’t know where to start with optimizing your clusters, the best place to start is looking for a big problem that stands out. That’s probably most visible by looking at a view that spans all of your clusters.
In GKE, we have a cluster-level cost optimization tab built into the console, rich with information that may be cumbersome to gather on your own otherwise.
You can find this as seen in the following image:
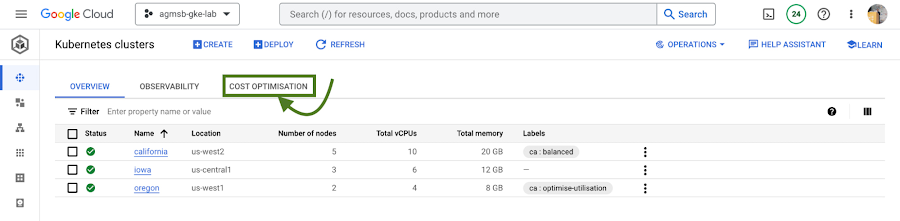
Fig. 1 – Navigating to the cost optimization tab in the cloud console
Once you navigate to this tab, you’re greeted with a time series visualization.
For GKE standard clusters, this visualization is a time series representation that shows three key dimensions for CPU and Memory across all of your clusters in a project:
Total CPU/Memory allocatable– # of CPU or GB of memory that can be allocated to user workloadsTotal CPU/Memory request– # of CPU or GB of memory that has been requested by user workloadsTotal CPU/Memory usage– actual usage by # of CPU or GB of memory by user workloads
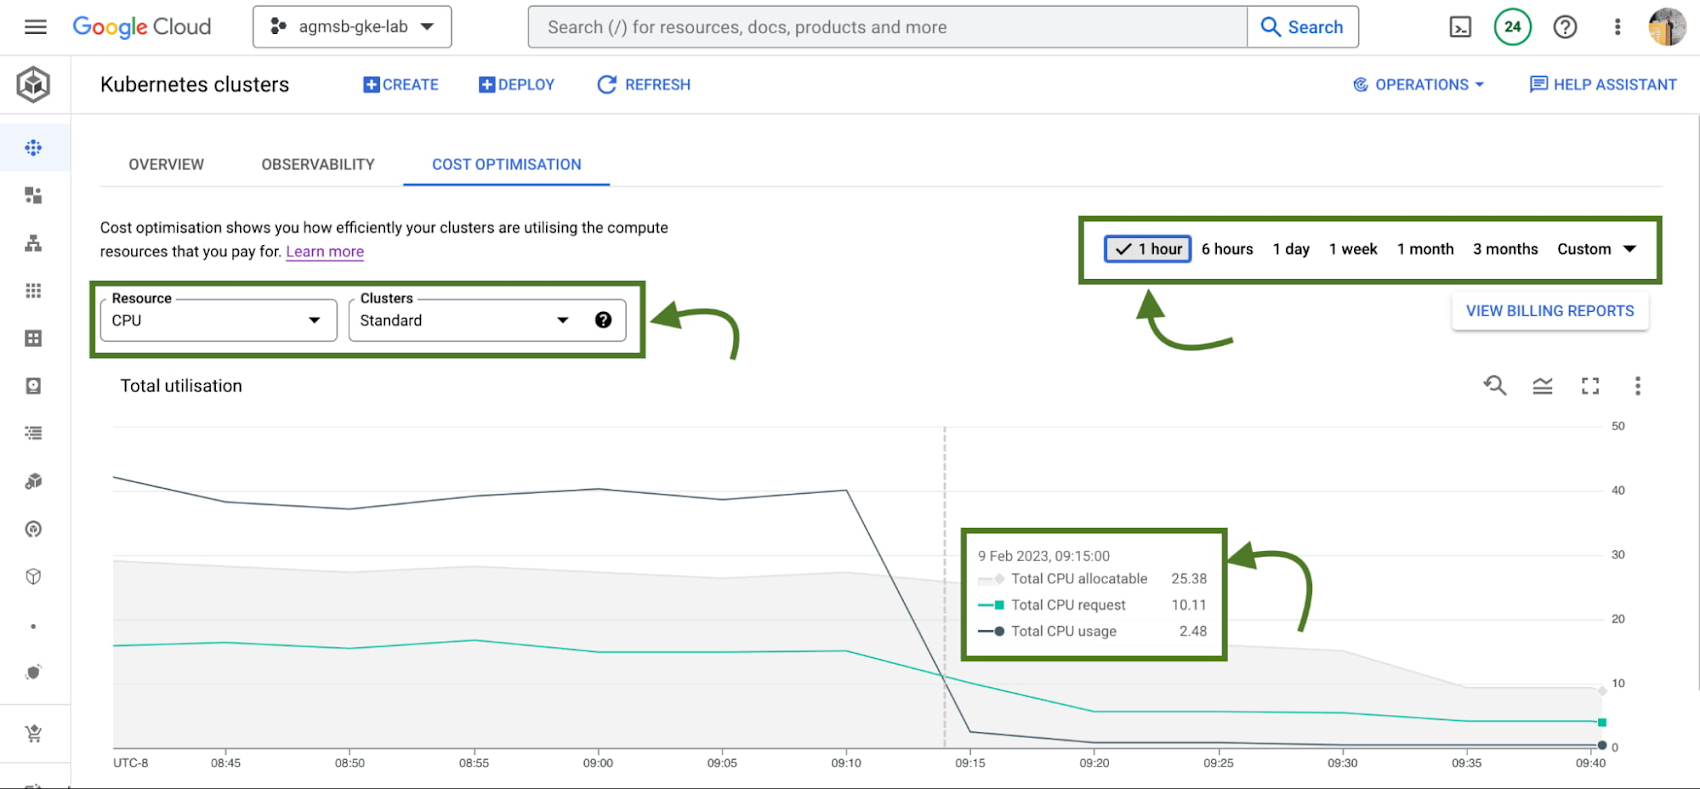
Fig. 2 – Allocatable, requested, and usage time series data across CPU or memory in all standard GKE clusters over a specified window
Analyzing these in relationship to one another can help identify answers to important optimization questions such as:
- Do we have too much allocatable CPU and memory idle across our GKE standard clusters? If so, can we do things like re-evaluate the machine types we use in node pools? This can help us bin pack the cluster, by having a higher percentage of allocatable resources allocated to Pod requests.
- Are workloads running in our GKE standard clusters requesting too much CPU and memory that goes unused? If so, can we do things like work with workload owners to adjust requests? This can help us workload right-size, by setting requests to more closely reflect expected usage.
If we’re using GKE Autopilot, this time series visualization will look slightly different, as seen in the following image:
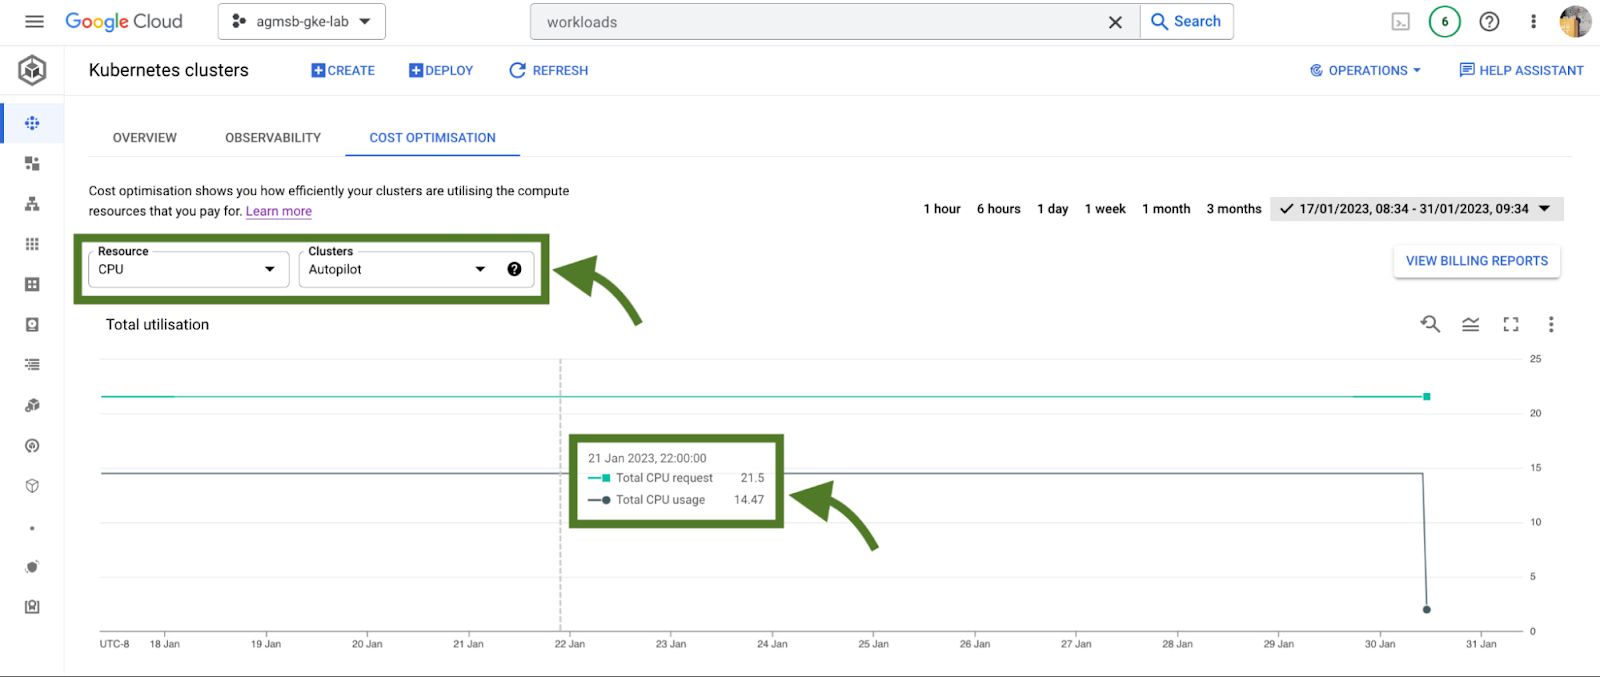
Fig. 3 – Requested and usage time series data across CPU or memory in all GKE Autopilot clusters
In the case of GKE Autopilot clusters, we’re only able to view the Total CPU/Memory request and the Total CPU/Memory usage data. But nothing here is actually missing!
In Autopilot clusters, you only pay per Pod based on its requests; Autopilot automatically handles provisioning the infrastructure that gives us our allocatable resources based on whatever you set Pod requests to. When we trade in that ownership of node provisioning, we also trade in the control to optimize at that layer.
For a cluster administrator, this information can be a spark to spur actions such as diving into individual clusters or meeting with workload teams to work through their requests and limits that they set for workloads. In our research, this is perhaps the most impactful area many teams optimize. We’ll dive into how GKE can enable this exercise a bit further in this blog.
When going down those paths, it helps to have financial data to quantify the impact of the optimization to the business. Gathering this info on your own can require a bit of work (for some, a lot of spreadsheets as well!), but luckily GKE has another native feature to help make this easily accessible to you.
#2 – GKE cost allocation
GKE cost allocation is a native GKE feature that integrates workload usage with Cloud Billing and its reports, allowing you to see and alert on billing not only on a per-cluster level, but on a per-Kubernetes namespace or per-Kubernetes label level.
It must be enabled on your cluster in order for it to function, so if you’re working with an existing GKE cluster and want to enable it, use the following gcloud command once you have set your appropriate zone or region:
$ gcloud beta container clusters create $CLUSTER_NAME \
    --enable-cost-allocation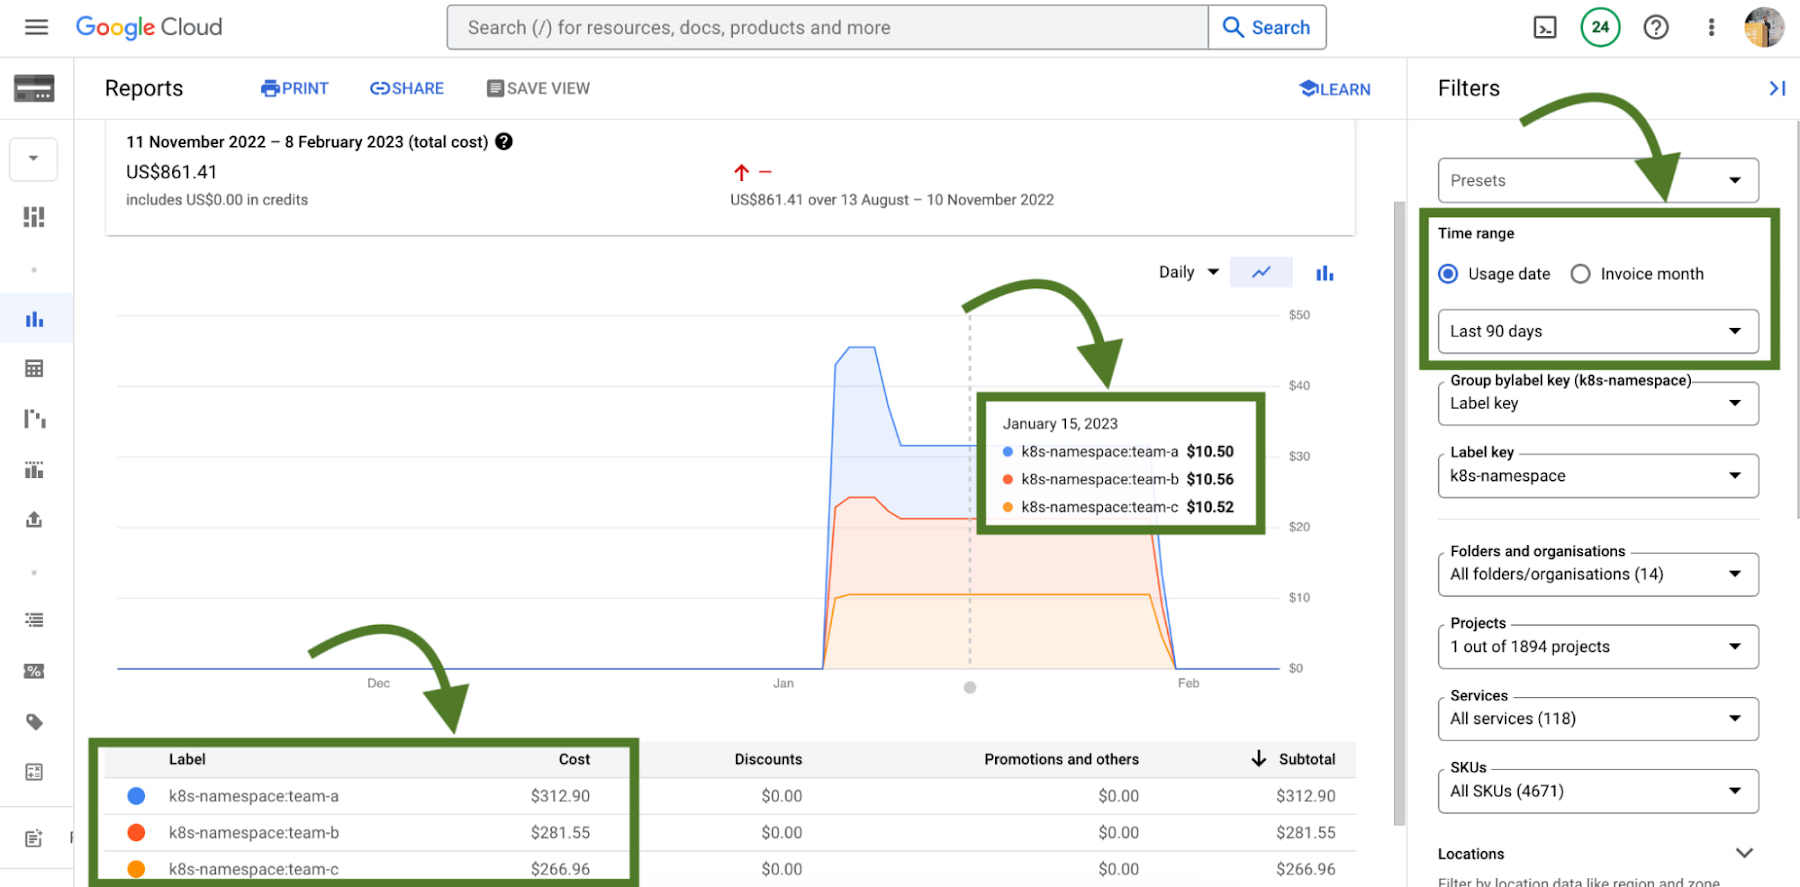
Without GKE cost allocation, the financial impact of a cluster and all of the different workloads it might run were a bit obfuscated. With the cluster as the deepest level of detail in billing, finding areas to optimize or even performing showback and chargeback was a challenge.
With Namespaces and Labels bubbling up into billing reports, you can now understand the cost of the CPU/Memory requests that workloads define in Kubernetes. A caveat – this works best when you are using Namespaces and Labels to logically define and organize teams and their workloads.
This integration also gives the bigger picture of optimization – in that GKE does not typically live on an island! In theory, workloads in a team’s namespace could be using external backing services like Cloud Memorystore that are also a key part of its usage.
Because Cloud Billing data has all GCP services, we can now filter and query across namespaces and their corresponding backing services.
# 3 – Workload view cost optimization in the console
Once you have teams identified that you may want to work with, GKE provides a cost optimization tab at the workload level, where you can then begin to drill down and identify specific workloads that could be optimized through an exercise called “workload right-sizing”. This is the act of making sure that Pod requests more closely reflect their expected usage.
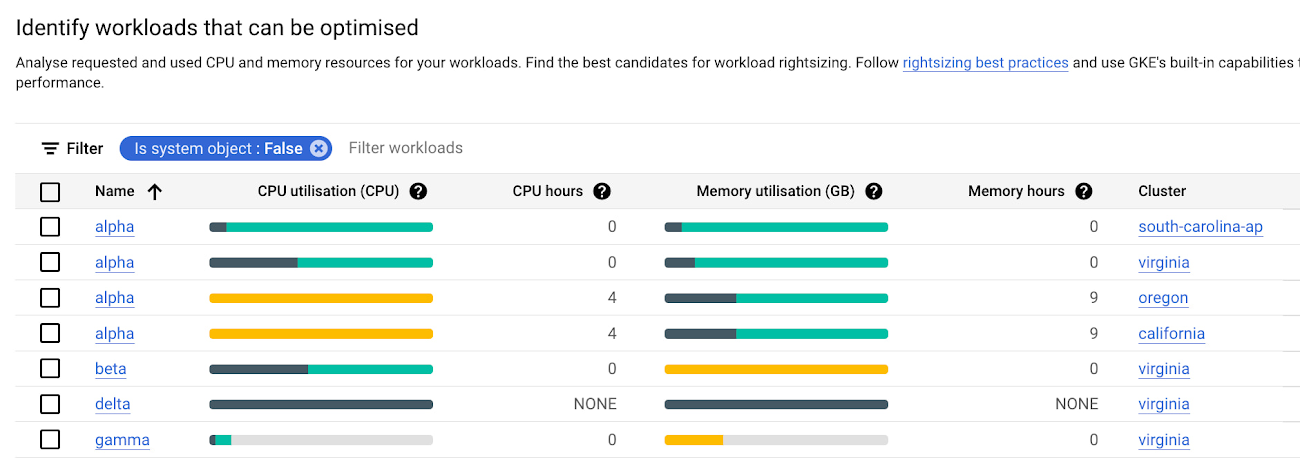
As you can see here, we’re given bar charts to represent the relationship of usage, requests, and limits to one another.
- Dark green: CPU/Memory usage
- Light green: CPU/Memory requests
- Grey: CPU/Memory Limits
- Yellow: Scenarios in which CPU/Memory usage exceeds requests
You can also hover over each individual workload bar chart to reveal a small on-screen report of this data. Similar to the cluster view cost optimization tab, you can filter down to a custom time window; we recommend viewing this data in a window greater than an hour (IE a day, week, month) to potentially uncover diurnal or weekly patterns that would otherwise be obfuscated.
In the preceding screenshot of these charts, we can call out a few patterns that might stand out to you:
- If we have too much light green stacked above dark green in a bar, we may have workloads that are over provisioned.
- If we have a yellow bar, we have a workload where requests are not set high enough, which can be a stability/reliability risk – consuming additional resources on its node and potentially being throttled or OOMKilled if it hits its limits.
- If we have a bar that is all dark green, this means that we don’t have requests set for a workload – which is not best practice! Set those requests.
With this information, it becomes easier to quickly identify workloads that need requests and limits tuned for either cost optimization or stability and reliability.
# 4 – Recommendations for adjusting workload requests
In scenarios where we need to increase or reduce CPU/Memory requests, it is easier to know that it needs to be done than to know how it needs to be done. What should we set the requests to?
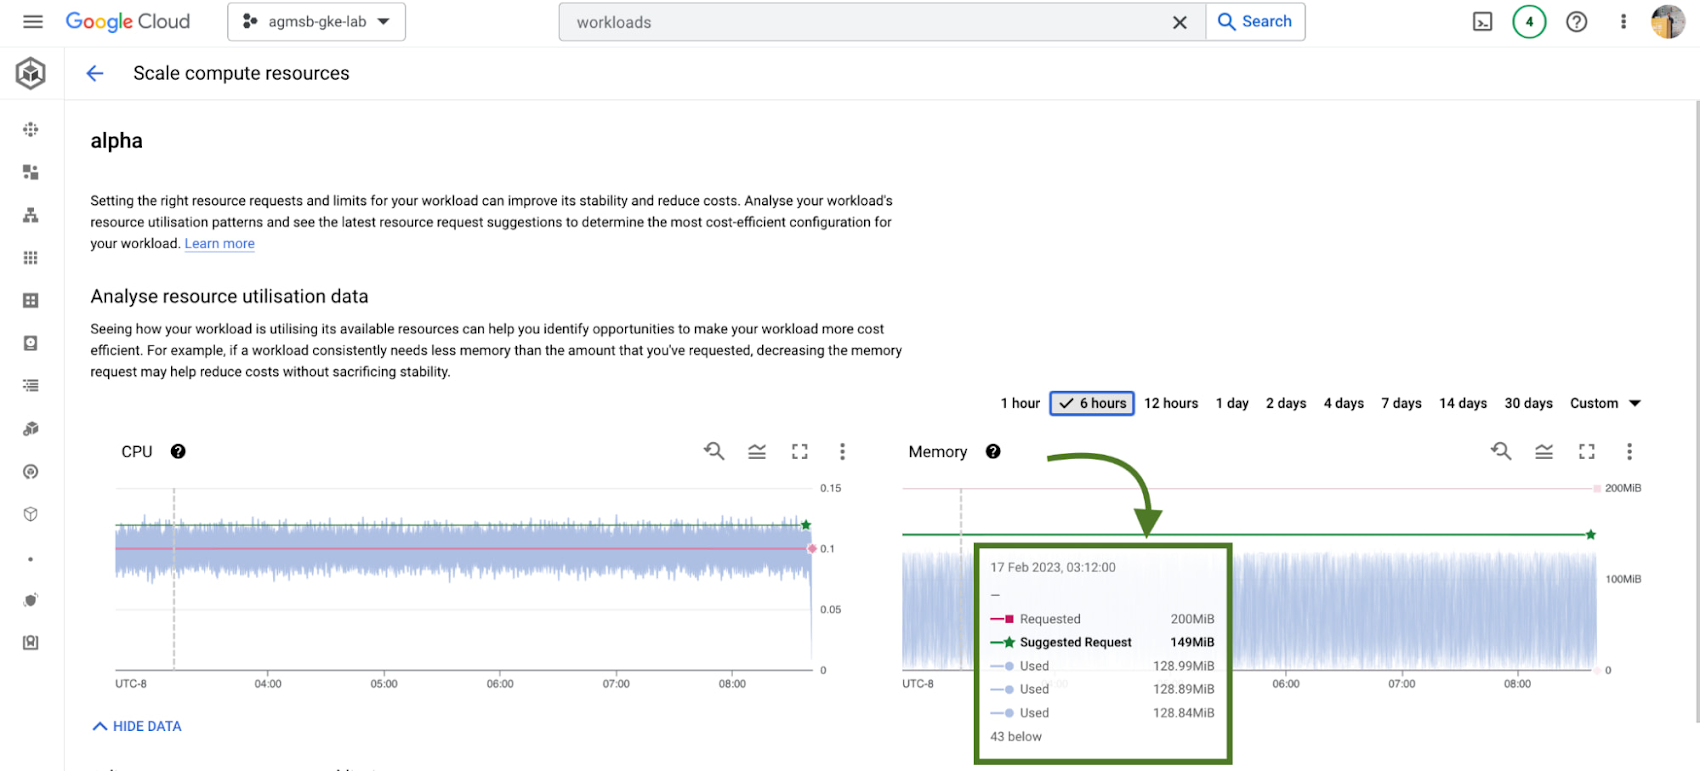
GKE integrates recommendations from the Kubernetes Vertical Pod Autoscaler (VPA) directly into its workload console, currently for all deployments in your clusters. You can find this by navigating to the Actions > Scale > Scale compute resources menu when viewing the page for a specific workload.
It’s important to remember that these recommendations are just that – recommendations. They’re based on historical usage data, so when viewing these values, it’s important to work with workload owners to see if these suggestions make sense to incorporate into their respective Kubernetes manifests.
# 5 – Cost estimation and cluster creation setup guides
Finally, if you’re just getting started with GKE and you want to get started on the right, optimized foot, we have tooling incorporated into the GKE cluster creation page.
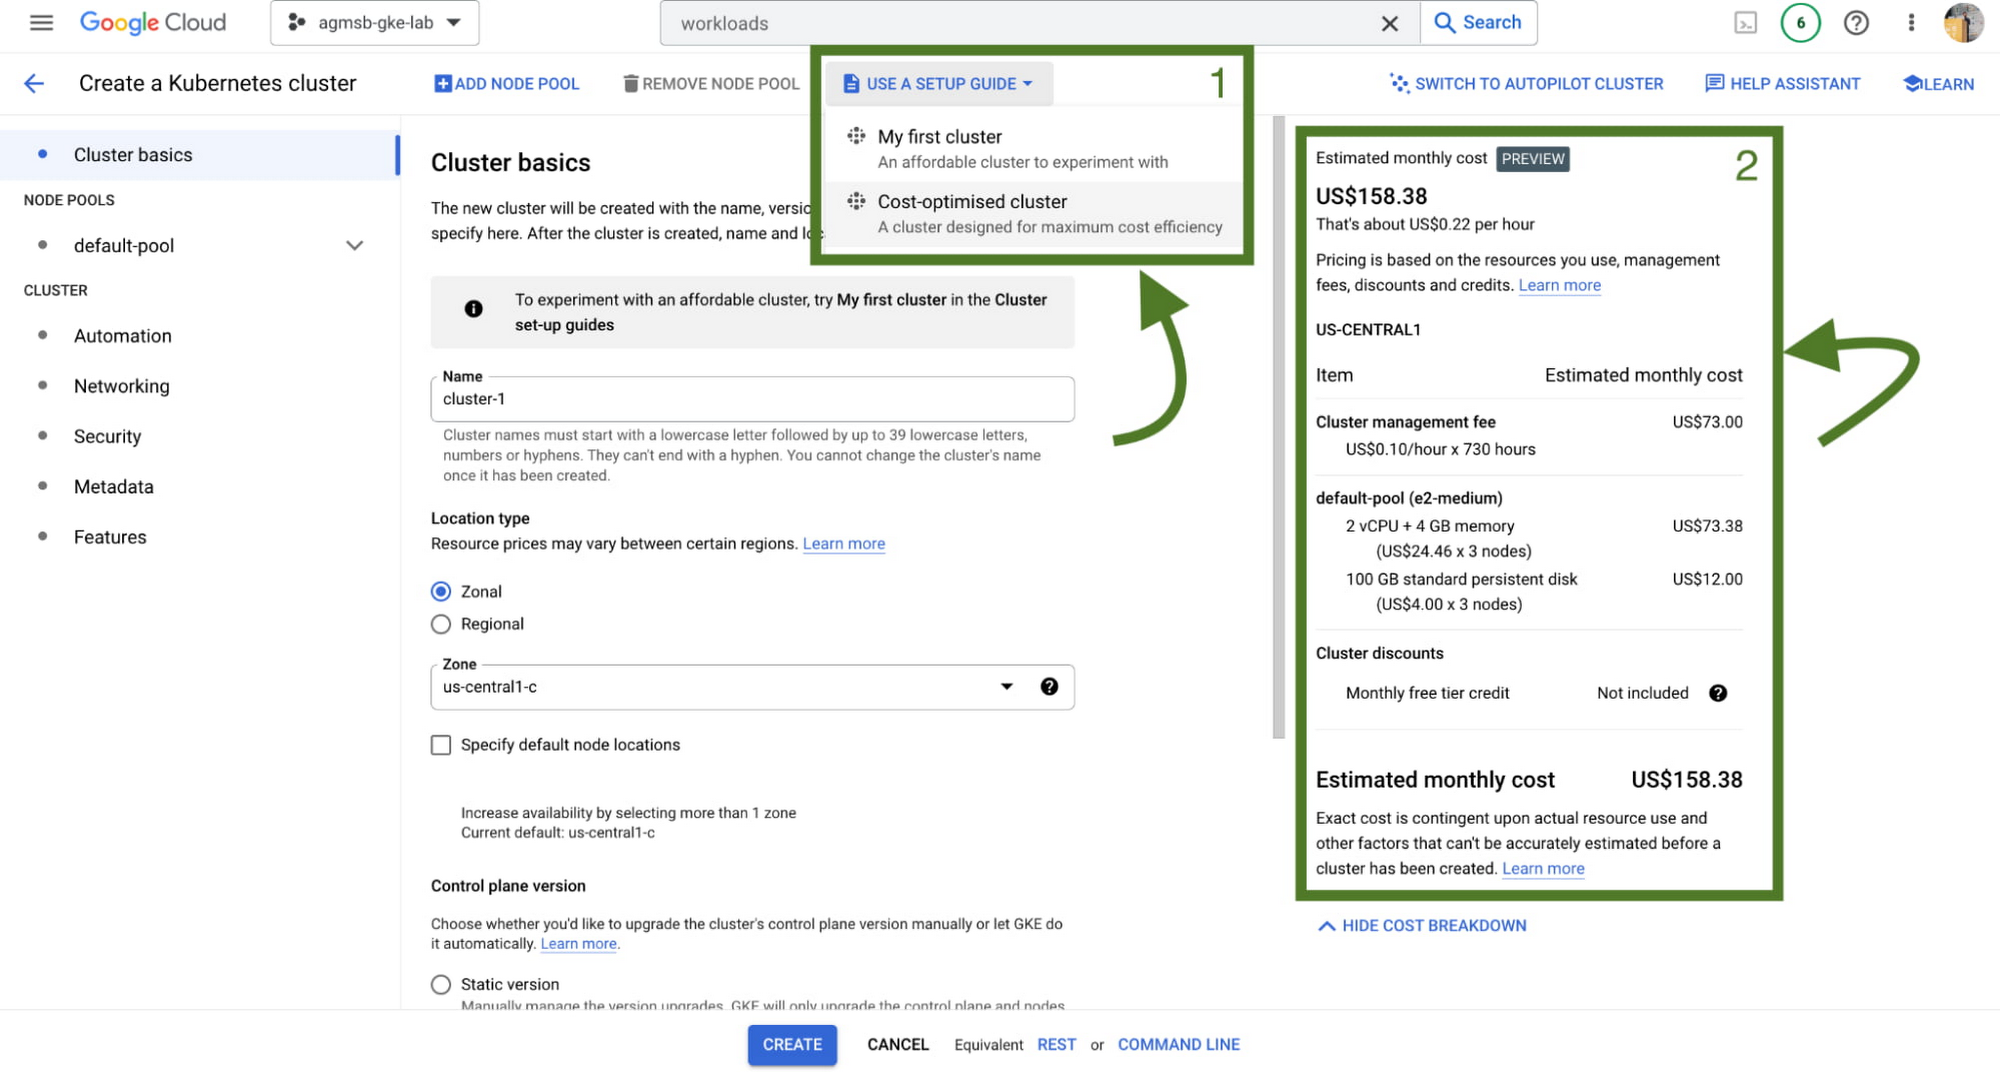
First, we have a setup guide that will help you create an opinionated GKE standard cluster with some things we discussed here already enabled, such as GKE cost allocation and Vertical Pod Autoscaler.
Second, we also have a cost estimation panel that, depending on the configuration of your GKE standard cluster, will show you an estimated monthly cost. This even helps you get a range of potential costs if you expect your cluster to scale up and down!
Now what?
Optimization across a set of GKE clusters can include a handful of areas to think about – and isn’t a one time task! Instead, it’s a continuous journey that cluster administrators, workload owners, and even billing managers all take part in. GKE provides the tooling to make this journey and process easier, with the right data and insights at your fingertips.
To familiarize yourself with these features in GKE, check out our interactive tutorials for getting started with standard and autopilot clusters.
You can also watch a demo showing most of these features in the following video:
A special thanks to Laurie White, Fernando Rubbo, and Bobby Allen for their review on this blog post.
Container Platforms on Google Cloud Maximize Developer Efficiency, Speed-up Time to Market and Eliminate IT Overhead!

3380
Of your peers have already read this article.
2:30 Minutes
The most insightful time you'll spend today!
Every tech company and growing startup faces pressure to make efficient use of technical talent. Increasingly, this means determining if and how the cloud can help this talent focus on things like product development instead of IT overhead. These challenges are the starting place for our new whitepaper “The future of infrastructure will be containerized,” which is informed by our work with tech companies and startups who’ve chosen Google Cloud across a range of industries, from healthcare and manufacturing to software, fintech and e-commerce.
For example, if your tech company or startup is in the cloud but spends lots of resources on custom tooling and maintenance, you’re almost certainly under-leveraging what the cloud can do. You might also be locking yourself into an architecture that won’t let you easily adapt or change things as your needs evolve.
The whitepaper examines these challenges to growth and explains how tech companies and startups can use managed container platforms in the cloud to maximize developer efficiency, accelerate time to market, and eliminate IT management that doesn’t help differentiate the business. In this blog post, we’ll explore one element of this discussion: infrastructure management. Be sure to check out the full whitepaper for all the details.
The case for containers and Kubernetes
Compared to previous virtualization technologies, containers are more lightweight, faster, more portable, and easier to manage—and a managed container platform like Kubernetes can extend these advantages even further. That’s why we’re seeing a massive shift to containers and Kubernetes.
Simply put, infrastructure and technical debt can slow down tech companies and startups. Traditional virtual machines (VMs) are neither simple to manage nor likely to maximize your workloads. Maximizing the cloud isn’t just about renting cheap resources—it’s about embracing modern, more efficient ways of operating that let businesses spend more time serving customers.
VMs virtualize at the hardware level and thus require higher degrees of management, less portability, and less consistent and efficient scaling. Containers, in contrast, virtualize further up the stack, at the OS level, meaning they contain the libraries and dependencies needed to run apps and services but are significantly more lightweight, easier to manage, and can accommodate modern operating models. VMs aren’t built for the speed at which today’s tech companies and startups need to move, but with a robust container orchestration like Kubernetes, startups can leverage proven patterns for running reliable, secure infrastructure at scale.
Kubernetes is open source and platform-agnostic, offering all the common tooling out of the box to secure and speed up each stage of the build-and-deploy life cycle. Everything is automated, with the complexity abstracted away—the vast majority of infrastructure-as-code is eliminated as the platform shifts to infrastructure-as-data, with users able to tell Kubernetes what they want rather than writing code to tell it what to do. In terms of both time saved in the present and flexibility preserved for the future, Kubernetes can be vastly more valuable than proprietary tech stacks or even a management-heavy implementation of VMs running in the cloud.
Kuberetes also lets tech companies and startups reduce management overhead according to their needs, with many different approaches available for different workloads:
- Kubernetes gives traditional workloads the benefits of a modern platform by letting organizations separate apps from VMs and put them in containers.
- Managed computing platforms turn cloud services into platforms-as-a-service, giving tech companies and startups the power and flexibility of containers and the convenience of serverless. There’s no server, no cluster configuration, and no maintenance, which means organizations can dramatically reduce overhead labor without compromising control.
- For workloads that don’t require much control over cluster configuration, tech companies and startups can use Google Kubernetes Engine (GKE) in Autopilot mode to provision clusters, while paying for only the workload, not the cluster. In this way, they can eliminate cluster administration while optimizing security and saving potentially substantial amounts of money.
- For more cloud-native applications, serverless options like Cloud Run, eliminate underlying infrastructure and serve as the end-to-end host for applications, data, and even analysis. A serverless platform lets organizations start running containers with minimal complexity in a fully-managed environment with security, performance, scalability, and best practices baked in.
Accelerating time to market while preserving future freedom
Tech company and startup leaders should also consider the value of the Kubernetes community and its surrounding ecosystem, as its stable innovation defines today’s industry standards and best practices. The technology benefits in terms of speed, complexity, and labor are clear when it comes to containers, but as an open-source platform with many active contributors, it is also an onramp to future architecture innovations. Being cutting-edge and developer-oriented, Kubernetes can also help organizations to attract top technical talent, in addition to letting them empower developers they already employ. And not to be neglected, because Kubernetes is open source, it offers transparency in proprietary solutions, limiting the risks of lockin. Top to bottom, it provides a framework for tech companies and startups to bring innovations to their customers, faster. To learn more, read the full whitepaper or visit the Google Cloud for startups and tech companies page.
Wunderkind Leverages Google Cloud to Address the Growing Needs of its Customer Base

5354
Of your peers have already read this article.
1:30 Minutes
The most insightful time you'll spend today!
Editor’s note: We’re hearing here how martech provider Wunderkind easily met the scaling demands of their growing customer base on multiple use cases with Cloud Bigtable and other Google Cloud data solutions.
Wunderkind is a performance marketing channel and we mostly have two kinds of customers: online retailers, and publishers like Gizmodo Media Group, Reader’s Digest, The New York Post and more. We help retailers boost their e-commerce revenue through real-time messaging solutions designed for email, SMS, onsite, and advertising. Brands want to provide a one-to-one experience to more of their customers, and we use our extensive history with best practices in email marketing and technology to help brands reach more customers through targeted messaging and personalized shopping experiences. With publishers, it’s a different value proposition, we use the same platform to provide a non disruptive and personalized ad experience for their website. For example, if you are on their site and then you left, we might show an ad tailored to you when you come back later – depending on the campaign.
After running into limitations with our legacy database system, we turned to Cloud Bigtable and Google Cloud, which helped us be more flexible and easily scale for high traffic demand – which can be a stable 40,000 requests per second, and meet the needs of our growing number of data use cases.
Three different databases power our core product
In our core offering, companies send us user events from their websites. We store these events and later decide (using our secret sauce) if and how to reach out to those users on behalf of our customers. Because many of our customers are retailers, Black Friday and Cyber Monday are big traffic days for us as. On such days, we can get 31 billion events, sometimes as many as 200K events per second. We show 1.6 billion impressions that have seen close to 1 billion pageviews. And at the end of all this, we securely send about 100 million emails. We noticed the same thing for election time; traffic reached the same high volume. We need scalable solutions to support this level of traffic as well as the elasticity to let us pay only for what we use, and that’s where Google Cloud comes in.
So how does this work? Our externally facing APIs, which are running on Google Kubernetes Engine, receive those user events—up to hundreds of thousand per second. All the components in our architecture need to be able to handle this demand. So from our APIs, those events go to Pub/Sub, Dataflow and from there they are written to Bigtable and BigQuery, Google Cloud’s serverless, and highly scalable data warehouse. This business user activity data underpins almost all our products. Events can be things like product views or additions to shopping carts. When we store this data in Bigtable, we use a combination of email address and the customer ID as the Bigtable key and we record the event details in that record.
What do we do with this information next? It’s important to mention that we also mark the last time we received an event about a user in Memorystore for Redis, Google Cloud’s fully managed Redis service. This is important because we have another service that is periodically checking Memorystore for users that have not been active for a campaign-specific period of time (it can be 30 minutes, for example), then deciding whether to reach out to them.
How we decide when we reach out is an intelligent part of our product offering, based on the channel, message, product, etc. When we do reach out, we use Memorystore for Redis as a rate limiter or token bucket. In order not to overwhelm the email or texting providers we send API requests to, we throttle those requests using Memorystore. (We prefer to preemptively throttle the outgoing API requests as opposed to handling errors later.)
When we do reach out, often we will need details for a specific product—let’s say if the website belongs to a retailer. We usually get that information from the retailer through various channels and we store product information in Cloud SQL for MySQL. We pull that information when we need to send an email with product information, and we use Memorystore for Redis to cache that information, since many of the products are repeatedly called. Our Cloud SQL instance has 16 vCPUs, 60GBs of memory and 0.5TB of disk space and when we perform those product information updates, we have about a thousand write transactions per second. We are also in the process of migrating some tables from a self managed MySQL instance, and we keep those tables synchronized with Cloud SQL using Datastream.
Our user history database was originally stored in AWS DynamoDB, but we were running into problems with how they structured the data, and we’d often get hot shards but with no way to determine how or why. That led to our decision to migrate to Bigtable. We set up the migration first by writing the data to two locations from Pub/Sub, performed some backfill of data until that was up and running, and then started working on the reading. We performed this over a few short months, then switched everything to Bigtable.
So, as mentioned, we are using Bigtable for multiple databases. The instance that stores our user events has about 30 TB with about 50 nodes.
Profile management
A second use case for Bigtable is for user profile management, where we track, for example, user attributes based on subscription activity, whether they’ve opted in or out of various lists, and where we apply list-specific rules that determine which targeted emails we send out to users.
Our very own URL shortener
Our third use case for Bigtable is our URL shortener. When our customers build out campaigns and choose a URL, we append tracking information to the query string of the URLs and they become long. Many times, we are sending them via SMS texts, so the URLs need to be short. We originally used an external solution, but made the determination that they couldn’t support our future demands. Our calls tend to be very bursty in nature, and we needed to plan for a future state of supporting higher throughput. We use a separate table in Bigtable for this shortened URL. We generate the short slug that is 62 bit-encoded and use it as the rowkey. We use the long slug as a Protobuf-encoded data structure in one of the row cells and we also have a cell for counting how many times it was used. We use Bigtable’s atomic increment to increase that counter to track how many times the short slug was used.
When the user receives a text message on their phone, they click the short URL, which goes through to us, and we expand it to the long slug (from Bigtable) and redirect them to the appropriate site location. Obviously, for the URL shortener use case, we need to make the conversion very quickly. Bigtable’s low latency helps us meet that demand and we can scale it up to meet higher throughput demands.
Meeting the future with Google Cloud
Our business has grown considerably, and as we keep signing up new clients, we need to scale up accordingly, and Bigtable has met our scaling demands easily. With Bigtable and other Google Cloud products powering our data architecture, we’ve met the demand of incredibly high traffic days in the last year, including Black Friday and Cyber Monday. Traffic for these events went much higher than expected, and Bigtable was there, helping us easily scale on demand.
We are working on leveraging a more cloud native approach and using Google Cloud managed services like GKE, Dataflow, pub/sub, Cloud SQL , Memorystore, BigQuery and more. Google has those 1st party products and we don’t see the value in rolling out or self managing such solutions ourselves..
Thanks to Google Cloud, we now have reliable and flexible data solutions that will help us meet the needs of our growing customer base, and delight their users with fast, responsive, personalized shopping messaging and experiences.
Learn more about Wunderkind and Cloud Bigtable. Or check out our recent blog exploring the differences between Bigtable and BigQuery.
How to Choose the Right ML Model for Your Applications
4892
Of your peers have already read this article.
2:00 Minutes
The most insightful time you'll spend today!
Many of our customers want to know how to choose a technology stack for solving problems with machine learning (ML). There are many choices for these solutions available, some that you can build and some that you can buy. We’ll be focusing on the build side here, exploring the various options and the problems they solve, along with our recommendations.
The best ML applications are trained with the largest amount of data
But first, keep in mind an important concept: the quality of your ML model improves with the size of your data. Dramatic ML performance and accuracy are driven by improvements in data size, as shown in the graph below. This is a text model, but the same principles hold for all kinds of ML models.
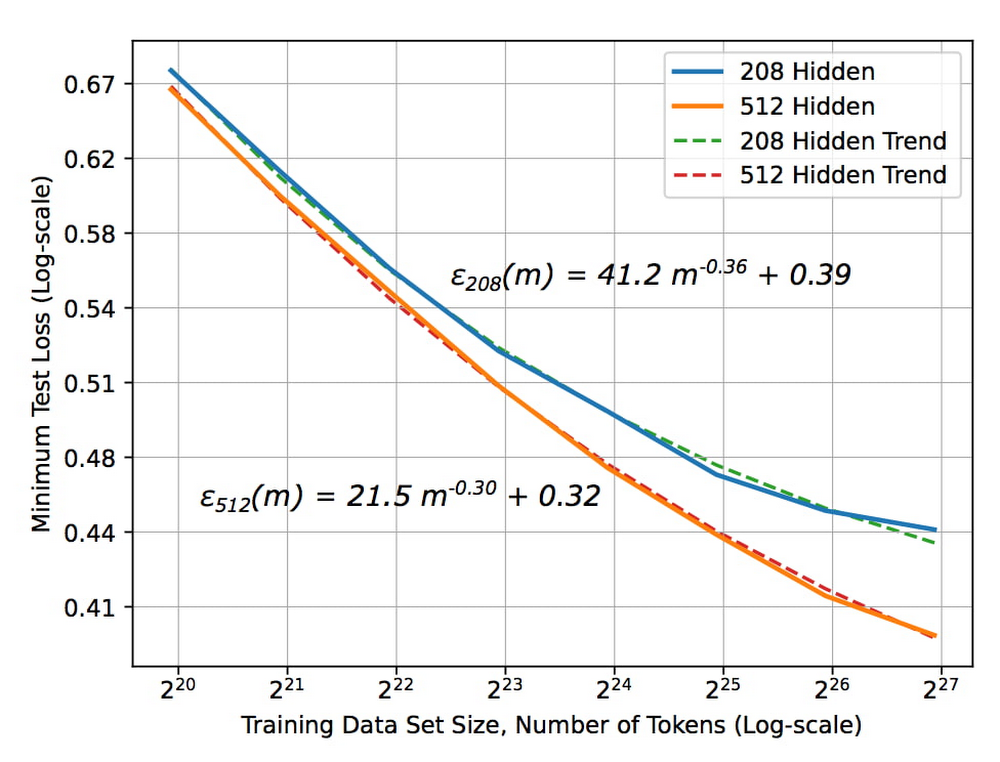
The X axis represents the size of the data set and the Y axis is the error rate. As the size of the data set increases, the error rate drops. But notice something critical about the size of the data set — the x-axis is2^20, 2^21, 2^ 22, etc. In other words, each new tic here is a doubling of the data set size. To get a linear decrease in your error rate you need to exponentially increase the size of your data set.
The blue curve in the graph represents a slightly more sophisticated ML model than the orange curve. Suppose you are deciding between two choices: create a better model or double the data set size. Assuming that these two choices cost the same, it’s better to keep gathering more data. It’s only when improvements due to data size increases start to plateau that it becomes necessary to build a better model.
Secondly, ML systems need to be retrained for new situations. For example, if you have a recommendation system in YouTube and you want to provide recommendations in Google Now, you can’t use the same recommendations model. You have to train it in the second instance on the recommendations you want to make in Google Now. So even though the model, the code, and the principles are the same, you have to retrain the model with new data for new situations.
Now, let’s combine these two concepts: you get a better ML model when you have more data, and an ML model typically needs to be retrained for a new situation. You have a choice of either spending your time building an ML model or buying a vendor’s off-the-shelf model.
To answer the question of whether to buy or whether to build, first determine if the buyable model is solving the same problem that you want to solve. Has it been trained on the same input and on similar labels? Let’s say you’re trying to do a product search, and the model has been trained on catalog images as inputs. But you want to do a product search based on users’ mobile phone photographs of the products. The model that was trained on catalog images won’t work on your mobile phone photographs, and you’d have to build a new model.
But let’s say you’re considering a vendor’s translation model that’s been trained on speeches in the European Parliament. If you want to translate similar speeches, the model works well as it uses the same kind of data.
The next question to ask: does the vendor have more data than you do? If the vendor has trained their model on speeches in the European Parliament but you have access to more speech data than they have, you should build. If they have more data, then we recommend buying their model.
Bottom line: buy the vendor’s solution if it’s trained on the same problem and has access to more data than you do.
Technology stack for common ML use cases
If you need to build, what is the technology stack you need? What are the skills your people need to develop? This depends on the type of problem you are solving. There are four broad categories of ML applications: predictive analytics, unstructured data, automation, and personalization. The recommended technology stack for each is slightly different.
Predictive analytics
Predictive analytics includes detecting fraud, predicting click-through rates, and forecasting demand.
Step one: build an enterprise data warehouse
Here, your data set is primarily structured data, so our recommended first step is to store your data in an enterprise data warehouse (EDW). Your EDW is a source of training examples and product histories tracked over time, and can break down silos and gather data from throughout your organization.
Step two: get good at data analytics
Next, you’d build a data culture, get skilled at data analytics, start to build dashboards, and enable data-driven decisions. At this point, you have all of the data and you know which pieces are trustworthy.
Step three: build ML
From your EDW, you can build your models using SQL pipelines. We recommend using BigQuery ML when doing ML with the data in your EDW. If you want to build a more sophisticated model, you can train TensorFlow/Keras models on BigQuery data. A third option is AutoML tables for state-of-the-art accuracy and for building online microservices.
Unstructured data
Examples of how our customers use ML to gain insights from unstructured data include annotating videos, identifying eye diseases, and triaging emails. Unstructured data can include videos, images, natural language, and text. Deep learning has revolutionized the way we do ML on unstructured data, whether you’re looking at language understanding, image classification, or speech-to-text.
For unstructured data, the models you use will employ deep learning. Here, the ROI heavily favors using AutoML. The amount of time that you’d spend trying to create a new ML model from scratch is almost never worth it. You can spend your money more effectively collecting more data than trying to get a slightly better model. Regardless of the type of unstructured data, our recommendation is to use AutoML for small and medium size data sizes.
But AutoML has a limit to scale. At some point, the size of your data set is going to be so large that architecture search is going to get really expensive. At that point, you may want to go to a best-of-breed model with custom retraining from TensorFlow Hub, for example. If you have data sets that are in the millions of examples, you can build your own custom neural network (NN) architectures. But determine if your data set size has started to plateau, by plotting a graph similar to the one at the top of this post. Build a custom NN architecture only after you’ve plateaued, where increasing amounts of data won’t give you a better model.
Automation
Some examples of how customers are using ML for automation include scheduling maintenance, counting retail footfall, and scanning medical forms. The key thing to keep in mind as you pick a technology stack for these problems is that you’re not building just one ML model. If you want to schedule maintenance orwant to reject transactions, for example, you’ll need to train multiple linked models.
Instead of individual models, think in terms of ML pipelines, which you can orchestrate using all of the technologies already mentioned. Then you have three choices for operationalizing, with three levels of sophistication.
- Vertex AI has turnkey serverless training and batch/online predictions. This is what is recommended for a team of data scientists. .
- Deep Learning VM Image, Cloud Run, Cloud Functions or Dataflow feature customized training and batch/online predictions. This is what is recommended if the team consists of data engineers and scientists.
- Vertex AI Pipelines are fully customizable and recommended for organizations with separate ML engineering and data science teams.
When doing automation, the individual models that you chain together into a pipeline will be a mix – some will be prebuilt, some will be customized, and others will be built from scratch. Vertex AI, by providing a unified interface for all these model types, simplifies the operationalization of these models.
Personalization
ML application examples of personalization include customer segmentation, customer targeting, and product recommendations. For personalization, we again recommend using an EDW, because customer segmentation uses structured marketing data. For product recommendations, you will similarly have prior purchases and web logs in your EDW., You can power clustering applications, or recommendation systems like matrix factorization, and create embeddings directly from your EDW for sophisticated recommendation systems.
For specific use cases, choose the technology stack based on your data size and scope. Start with BigQuery ML for its quick, easy matrix factorization approach. Once your application proves viable and you want a slightly better accuracy, then try AutoML recommendations. But once your data set grows beyond the capabilities of AutoML recommendations, consider training your own custom TensorFlow and Keras models.
To summarize, successful ML starts with the question, “Do I build or do I buy?” If an off-the-shelf solution exists that was trained with similar data and with access to more data than you have, then buy it. Otherwise build it, using the technology stack recommended above for the four categories of ML applications.
Learn more about our artificial intelligence (AI) and ML solutions and check out sessions from our Applied ML Summit on-demand.

3954
Of your peers have already downloaded this article
6.00 Minutes
The most insightful time you'll spend today!
Choosing ROI criteria that drive smart decisions about digital investments is necessary to win in the app economy. But according to an Apigee Institute survey of IT and Marketing executives, there is a wide gap between what corporate leaders believe are the best ROI metrics and what are actually used in most enterprises today. Those who move first to bridge the gap will be able to move further and faster towards digital transformation and market leadership.
This special report drills down on patterns and practices for digital ROI that drive more confident decision making and stronger results based on empirical analysis of 200 large companies. Read the report to understand how you can drive decisions about digital investments to the next level of actionability and strengthen digital capabilities by building stronger organizational alignment. The report explores how top performing digital businesses evaluate and make decisions about digital investments using data analytics, by deploying apps, and operating APIs.
More Relevant Stories for Your Company

Scaling with Breaking News: BBC’s Serverless Infrastructure on Google Cloud
Editors note: Today's post is from Neil Craig at the British Broadcasting Corporation (BBC), the national broadcaster of the United Kingdom. Neil is part of the BBC’s Digital Distribution team which is responsible for building the services such as the public-facing www bbc.co.uk and .com websites and ensuring they are




A Headless Ecommerce on Google Cloud
Headless commerce helps marketing teams gain flexibility to alter frontend elements to run marketing campaigns and promotions and create the most superior customer experience on frontend devices. Watch the video to learn the basics of building a headless commerce application on Google Cloud. Meaning you will learn to have the



Why Apigee: Customers Explain How this API Platform Boosts their Business
Apigee customers Expedia, Equinix, Morningstar, Swisscom, Vantiv, Telstra, Fox Broadcasting company, Laterooms.com and partners, SAP and Accenture share why they joined forces with the intelligent API management platform company. Apigee is helping customers execute businesses commerce with other partners, securely expose assets to external developer communities, secure APIs throughout the

Google’s Default Messaging Apps for AT&T Android Users Ensure Richer Conversations
Today, we’re announcing that we’re working with AT&T to establish Messages by Google as the default messaging application for all AT&T customers in the United States using Android phones. The collaboration aims to help accelerate the industry toward global Rich Communication Services (RCS) coverage and interoperability to offer a consistent, secure, and
