





Wunderkind Leverages Google Cloud to Address the Growing Needs of its Customer Base

5352
Of your peers have already read this article.
1:30 Minutes
The most insightful time you'll spend today!
Editor’s note: We’re hearing here how martech provider Wunderkind easily met the scaling demands of their growing customer base on multiple use cases with Cloud Bigtable and other Google Cloud data solutions.
Wunderkind is a performance marketing channel and we mostly have two kinds of customers: online retailers, and publishers like Gizmodo Media Group, Reader’s Digest, The New York Post and more. We help retailers boost their e-commerce revenue through real-time messaging solutions designed for email, SMS, onsite, and advertising. Brands want to provide a one-to-one experience to more of their customers, and we use our extensive history with best practices in email marketing and technology to help brands reach more customers through targeted messaging and personalized shopping experiences. With publishers, it’s a different value proposition, we use the same platform to provide a non disruptive and personalized ad experience for their website. For example, if you are on their site and then you left, we might show an ad tailored to you when you come back later – depending on the campaign.
After running into limitations with our legacy database system, we turned to Cloud Bigtable and Google Cloud, which helped us be more flexible and easily scale for high traffic demand – which can be a stable 40,000 requests per second, and meet the needs of our growing number of data use cases.
Three different databases power our core product
In our core offering, companies send us user events from their websites. We store these events and later decide (using our secret sauce) if and how to reach out to those users on behalf of our customers. Because many of our customers are retailers, Black Friday and Cyber Monday are big traffic days for us as. On such days, we can get 31 billion events, sometimes as many as 200K events per second. We show 1.6 billion impressions that have seen close to 1 billion pageviews. And at the end of all this, we securely send about 100 million emails. We noticed the same thing for election time; traffic reached the same high volume. We need scalable solutions to support this level of traffic as well as the elasticity to let us pay only for what we use, and that’s where Google Cloud comes in.
So how does this work? Our externally facing APIs, which are running on Google Kubernetes Engine, receive those user events—up to hundreds of thousand per second. All the components in our architecture need to be able to handle this demand. So from our APIs, those events go to Pub/Sub, Dataflow and from there they are written to Bigtable and BigQuery, Google Cloud’s serverless, and highly scalable data warehouse. This business user activity data underpins almost all our products. Events can be things like product views or additions to shopping carts. When we store this data in Bigtable, we use a combination of email address and the customer ID as the Bigtable key and we record the event details in that record.
What do we do with this information next? It’s important to mention that we also mark the last time we received an event about a user in Memorystore for Redis, Google Cloud’s fully managed Redis service. This is important because we have another service that is periodically checking Memorystore for users that have not been active for a campaign-specific period of time (it can be 30 minutes, for example), then deciding whether to reach out to them.
How we decide when we reach out is an intelligent part of our product offering, based on the channel, message, product, etc. When we do reach out, we use Memorystore for Redis as a rate limiter or token bucket. In order not to overwhelm the email or texting providers we send API requests to, we throttle those requests using Memorystore. (We prefer to preemptively throttle the outgoing API requests as opposed to handling errors later.)
When we do reach out, often we will need details for a specific product—let’s say if the website belongs to a retailer. We usually get that information from the retailer through various channels and we store product information in Cloud SQL for MySQL. We pull that information when we need to send an email with product information, and we use Memorystore for Redis to cache that information, since many of the products are repeatedly called. Our Cloud SQL instance has 16 vCPUs, 60GBs of memory and 0.5TB of disk space and when we perform those product information updates, we have about a thousand write transactions per second. We are also in the process of migrating some tables from a self managed MySQL instance, and we keep those tables synchronized with Cloud SQL using Datastream.
Our user history database was originally stored in AWS DynamoDB, but we were running into problems with how they structured the data, and we’d often get hot shards but with no way to determine how or why. That led to our decision to migrate to Bigtable. We set up the migration first by writing the data to two locations from Pub/Sub, performed some backfill of data until that was up and running, and then started working on the reading. We performed this over a few short months, then switched everything to Bigtable.
So, as mentioned, we are using Bigtable for multiple databases. The instance that stores our user events has about 30 TB with about 50 nodes.
Profile management
A second use case for Bigtable is for user profile management, where we track, for example, user attributes based on subscription activity, whether they’ve opted in or out of various lists, and where we apply list-specific rules that determine which targeted emails we send out to users.
Our very own URL shortener
Our third use case for Bigtable is our URL shortener. When our customers build out campaigns and choose a URL, we append tracking information to the query string of the URLs and they become long. Many times, we are sending them via SMS texts, so the URLs need to be short. We originally used an external solution, but made the determination that they couldn’t support our future demands. Our calls tend to be very bursty in nature, and we needed to plan for a future state of supporting higher throughput. We use a separate table in Bigtable for this shortened URL. We generate the short slug that is 62 bit-encoded and use it as the rowkey. We use the long slug as a Protobuf-encoded data structure in one of the row cells and we also have a cell for counting how many times it was used. We use Bigtable’s atomic increment to increase that counter to track how many times the short slug was used.
When the user receives a text message on their phone, they click the short URL, which goes through to us, and we expand it to the long slug (from Bigtable) and redirect them to the appropriate site location. Obviously, for the URL shortener use case, we need to make the conversion very quickly. Bigtable’s low latency helps us meet that demand and we can scale it up to meet higher throughput demands.
Meeting the future with Google Cloud
Our business has grown considerably, and as we keep signing up new clients, we need to scale up accordingly, and Bigtable has met our scaling demands easily. With Bigtable and other Google Cloud products powering our data architecture, we’ve met the demand of incredibly high traffic days in the last year, including Black Friday and Cyber Monday. Traffic for these events went much higher than expected, and Bigtable was there, helping us easily scale on demand.
We are working on leveraging a more cloud native approach and using Google Cloud managed services like GKE, Dataflow, pub/sub, Cloud SQL , Memorystore, BigQuery and more. Google has those 1st party products and we don’t see the value in rolling out or self managing such solutions ourselves..
Thanks to Google Cloud, we now have reliable and flexible data solutions that will help us meet the needs of our growing customer base, and delight their users with fast, responsive, personalized shopping messaging and experiences.
Learn more about Wunderkind and Cloud Bigtable. Or check out our recent blog exploring the differences between Bigtable and BigQuery.
Real-time analytics for on-time delivery: Mercado Libre

3054
Of your peers have already read this article.
1:30 Minutes
The most insightful time you'll spend today!
Iteration and innovation fuel the data-driven culture at Mercado Libre. In our first post, we presented our continuous intelligence approach, which leverages BigQuery and Looker to create a data ecosystem on which people can build their own models and processes.
Using this framework, the Shipping Operations team was able to build a new solution that provided near real-time data monitoring and analytics for our transportation network and enabled data analysts to create, embed, and deliver valuable insights.
The challenge
Shipping operations are critical to success in e-commerce, and Mercado Libre’s process is very complex since our organization spans multiple countries, time zones, and warehouses, and includes both internal and external carriers. In addition, the onset of the pandemic drove exponential order growth, which increased pressure on our shipping team to deliver more while still meeting the 48-hour delivery timelines that customers have come to expect.
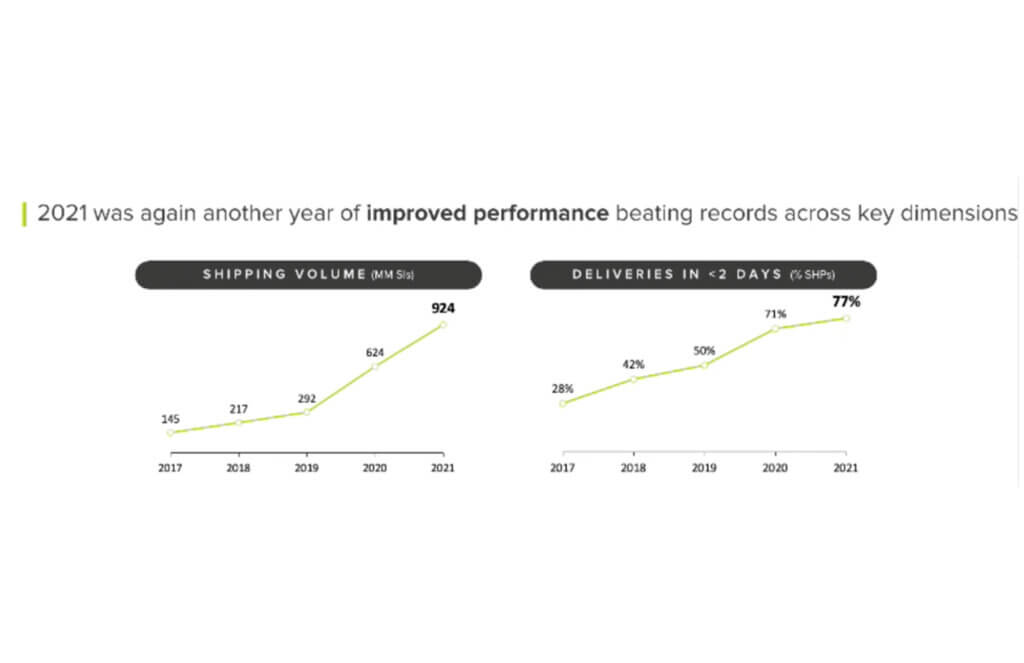
This increased demand led to the expansion of fulfillment centers and cross-docking centers, doubling and tripling the nodes of our network (a.k.a. meli-net) in the leading countries where we operate. We also now have the largest electric vehicle fleet in Latin America and operate domestic flights in Brazil and Mexico.
We previously worked with data coming in from multiple sources, and we used APIs to bring it into different platforms based on the use case. For real-time data consumption and monitoring, we had Kibana, while historical data for business analysis was piped into Teradata. Consequently, the real-time Kibana data and the historical data in Teradata were growing in parallel, without working together. On one hand, we had the operations team using real-time streams of data for monitoring, while on the other, business analysts were building visualizations based on the historical data in our data warehouse.
This approach resulted in a number of problems:
- The operations team lacked visibility and required support to build their visualizations. Specialized BI teams became bottlenecks.
- Maintenance was needed, which led to system downtime.
- Parallel solutions were ungoverned (the ops team used an Elastic database to store and work with attributes and metrics) with unfriendly backups and data bounded for a period of time.
- We couldn’t relate data entities as we do with SQL.
Striking a balance: real-time vs. historical data
We needed to be able to seamlessly navigate between real-time and historical data. To address this need, we decided to migrate the data to BigQuery, knowing we would leverage many use cases at once with Google Cloud.
Once we had our real-time and historical data consolidated within BigQuery, we had the power to make choices about which datasets needed to be made available in near real-time and which didn’t. We evaluated the use of analytics with different time windows tables from the data streams instead of the real-time logs visualization approach. This enabled us to serve near real-time and historical data utilizing the same origin.
We then modeled the data using LookML, Looker’s reusable modeling language based on SQL, and consumed the data through Looker dashboards and Explores. Because Looker queries the database directly, our reporting mirrored the near real-time data stored in BigQuery. Finally, in order to balance near real-time availability with overall consumption costs, we analyzed key use cases on a case-by-case basis to optimize our resource usage.
This solution prevented us from having to maintain two different tools and featured a more scalable architecture. Thanks to the services of GCP and the use of BigQuery, we were able to design a robust data architecture that ensures the availability of data in near real-time.
Streaming data with our own Data Producer Model: from APIs to BigQuery
To make new data streams available, we designed a process which we call the “Data Producer Model” (“Modelo Productor de Datos” or MPD) where functional business teams can serve as data creators in charge of generating data streams and publishing them as related information assets we call “data domains”. Using this process, the new data comes in via JSON format, which is streamed into BigQuery. We then use a 3-tiered transformation process to convert that JSON into a partitioned, columnar structure.
To make these new data sets available in Looker for exploration, we developed a Java utility app to accelerate the development of LookML and make it even more fun for developers to create pipelines.
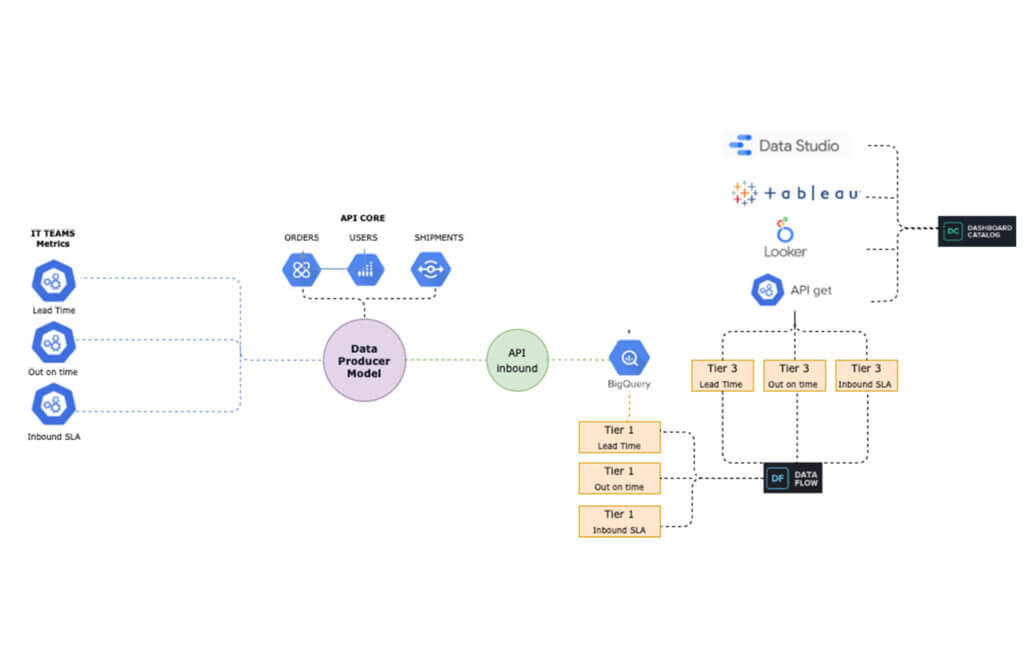
The complete “MPD” solution results in different entities being created in BigQuery with minimal manual intervention. Using this process, we have been able to automate the following:
- The creation of partitioned, columnar tables in BigQuery from JSON samples
- The creation of authorized views in a different GCP BigQuery project (for governance purposes)
- LookML code generation for Looker views
- Job orchestration in a chosen time window
By using this code-based incremental approach with LookML, we were able to incorporate techniques that are traditionally used in DevOps for software development, such as using Lams to validate LookML syntax as a part of the CI process and testing all our definitions and data with Spectacles before they hit production. Applying these principles to our data and business intelligence pipelines has strengthened our continuous intelligence ecosystem. Enabling exploration of that data through Looker and empowering users to easily build their own visualizations has helped us to better engage with stakeholders across the business.
The new data architecture and processes that we have implemented have enabled us to keep up with the growing and ever-changing data from our continuously expanding shipping operations. We have been able to empower a variety of teams to seamlessly develop solutions and manage third party technologies, ensuring that we always know what’s happening – and more critically – enabling us to react in a timely manner when needed.
Outcomes from improving shipping operations:
Today, data is being used to support decision-making in key processes, including:
- Carrier Capacity Optimization
- Outbound Monitoring
- Air Capacity Monitoring
This data-driven approach helps us to better serve you -and everyone- who expects to receive their packages on-time according to our delivery promise. We can proudly say that we have improved both our coverage and speed, delivering 79% of our shipments in less than 48 hours in the first quarter of 2022.
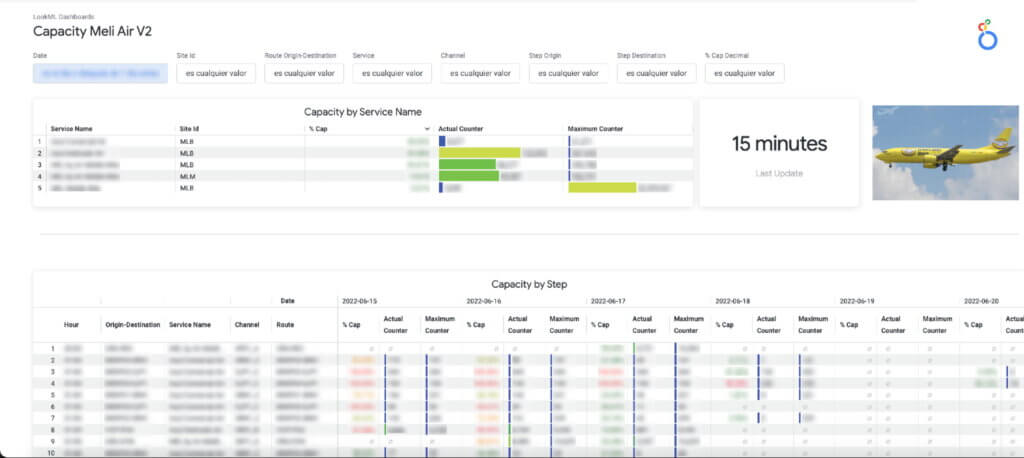
Here is a sneak peek into the data assets that we use to support our day-to-day decision making:
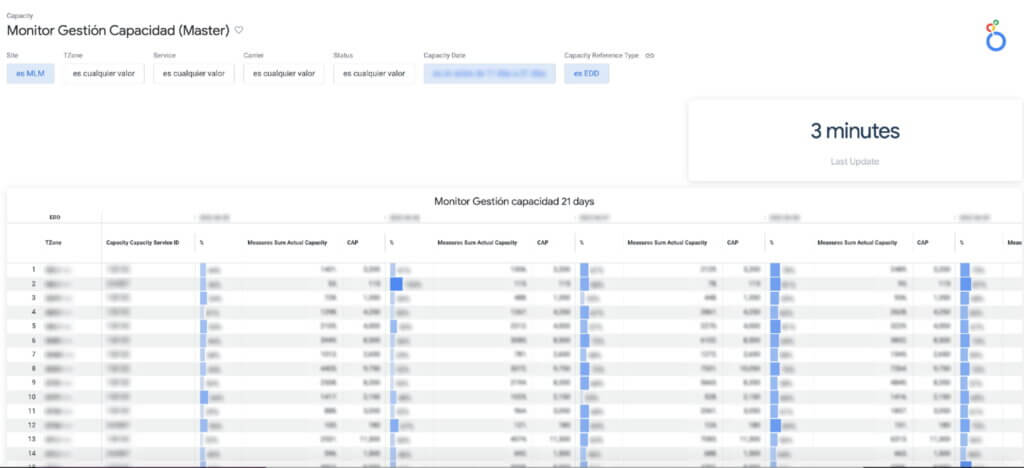
a. Carrier Capacity: Allows us to monitor the percentage of network capacity utilized across every delivery zone and identify where delivery targets are at risk in almost real time.
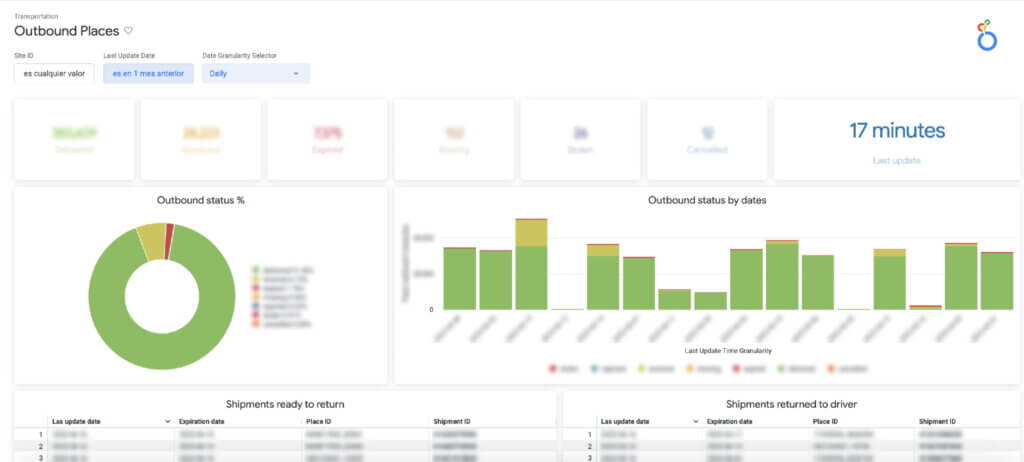
b. Outbound Places Monitoring: Consolidates the number of shipments that are destined for a place (the physical points where a seller picks up a package), enabling us to both identify places with lower delivery efficiency and drill into the status of individual shipments.
c. The Air Capacity Monitoring: Provides capacity usage monitoring for our aircrafts running each of our shipping routes.
Costs into the equation
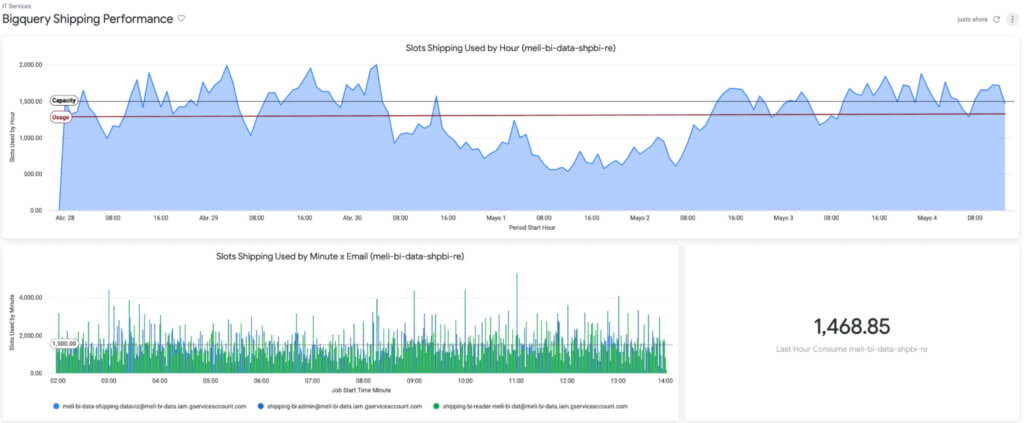
The combination of BigQuery and Looker also showed us something we hadn’t seen before: overall cost and performance of the system. Traditionally, developers maintained focus on metrics like reliability and uptime without factoring in associated costs.
By using BigQuery’s information schema, Looker Blocks, and the export of BigQuery logs, we have been able to closely track data consumption, quickly detect underperforming SQL and errors, and make adjustments to optimize our usage and spend.
Based on that, we know the Looker Shipping Ops dashboards generate a concurrency of more than 150 queries, which we have been able to optimize by taking advantage of BigQuery and Looker caching policies.
The challenges ahead
Using BigQuery and Looker has enabled us to solve numerous data availability and data governance challenges: single point access to near real-time data and to historical information, self-service analytics & exploration for operations and stakeholders across different countries & time zones, horizontal scalability (with no maintenance), and guaranteed reliability and uptime (while accounting for costs), among other benefits.
However, in addition to having the right technology stack and processes in place, we also need to enable every user to make decisions using this governed, trusted data. To continue achieving our business goals, we need to democratize access not just to the data but also to the definitions that give the data meaning. This means incorporating our data definitions with our internal data catalog and serving our LookML definitions to other data visualizations tools like Data Studio, Tableau or even Google Sheets and Slides so that users can work with this data through whatever tools they feel most comfortable using.
If you would like a more indepth look at how we made new data streams available from a process we designed called the “Data Producer Model” (“Modelo Productor de Datos” or MPD) register to attend our webcast on August 31.
While learning and adopting new technologies can be a challenge, we are excited to tackle this next phase, and we expect our users will be too, thanks to a curious and entrepreneurial culture. Are our teams ready to face new changes? Are they able to roll out new processes and designs? We’ll go deep on this in our next post.
AgroStar: Small farms in India getting big help from the cloud

13267
Of your peers have already read this article.
3:30 Minutes
The most insightful time you'll spend today!
AgroStar has launched a cloud-based mobile app that is helping to boost crop yields and encourage best practices for small farmers in India. Launched as an on-premises ecommerce platform selling farm tools in 2008, the firm turned to Google Cloud Platform (GCP) to expand its offering. It now uses cloud-based analytics and is deploying ML models to provide timely advice in five languages on everything from seed optimization, crop rotation, and soil nutrition to pest control.
A 2018 survey underscored the demand for agricultural planning for Indian farmers. While farming remains a dominant sector in India, employing half of its labor force, 70 percent of small farmers – those cultivating fewer than three acres – said their crops are damaged by unforeseen weather and pests. An even higher number – 74 percent – say they lack access to farming-related information.
Widening that gap is the relative lack of access to new, higher yield seeds and improved soil analyses for small farmers, who must otherwise rely on traditional methods. “It could take a few years for innovative information to trickle down from universities to small, grassroots farmers,” says Pritesh Gudge, AgroStar Software Engineer. “Today, just by clicking through our Android application, farmers learn about new, effective farming practices and receive advice customized to their crop and soil.”
Connecting a million farmers in the cloud
Operating in the Indian states of Gujarat, Maharashtra, Rajasthan, Orissa, Bihar, and Karnataka, AgroStar is closing the knowledge gap with a full-service, cloud-based SaaS solution – the only one of its kind in India. It combines agronomy, data science, and analytics to help farmers by providing a variety of resources.
AgroStar has reached over a million farmers through its Android app, the AgroStar Agri-Doctor. The mobile client is available as a web-based or full-featured native app. Both provide access to the firm’s knowledge base hosted on GCP, a Q&A forum that connects farmers to each other to help understand and better solve problems and to learn about innovative practices and products. Farmers can also click through to follow local and national market trends that help forecast crop prices.
In addition to the self-service knowledge base, AgroStar provides access to agronomy experts who use cloud-based analytics tools and historical data to provide season-and locale-specific advice to each farmer. “We are now tracking thousands of calls in 5 languages each day,” says Pritesh.
The AgroStar app also provides links to purchase and then track the delivery of farm tools and supplies such as cultivators and fertilizers. An in-house platform manages fulfillment centers and a doorstep delivery network simplifies the supply chain while giving farmers what they need, when they need it. By procuring directly from the manufacturers and primary distributors of farm supplies, Agrostar is achieving cost savings, which it passes on to farmers.
Build fast, pivot faster
From the start, the human and environmental variables of farming in India, not to mention the volume of AgroStar’s few hundred thousand monthly active users, made a highly scalable cloud-based solution inevitable. Farmers rely on the firm’s Agri-Doctor app to provide advice in multiple languages on topics that range widely throughout three growing seasons, each with distinct crop nutrition and rotation cycles and farm implementation requirements.
“For farmers, the focus keeps changing every month, and every season,” says Pritesh. “To serve our growing community, we needed a platform that could process images at high volume, fulfill tools and seed orders across thousands of miles, and respond to multilingual queries. We quickly moved away from spreadsheets and server-based solutions – we needed to build fast and pivot faster.”
Ending late-night deployments
The firm’s first cloud experience was with an AWS solution. At the time, AWS was the only cloud provider in India, but AgroStar wanted to find a solution that was easier to use and offered better integration with Android devices. “Deployment and processing costs were very high, and the developer tools and documentation were not as intuitive as we needed,” says Pritesh.
When GCP service arrived in India in October 2017, AgroStar embarked on a platform re-implementation that made possible dramatic changes in the way it developed and deployed its solution. Using Google Kubernetes Engine (GKE) for crop advice management and Compute Engine for its production application services, the firm built the backend for the Agri-Doctor discussion forum in only three weeks. The platform’s microservice architecture is implemented in Python and Golang and deployed on GCP.
AgroStar began to realize significant efficiencies in its build, deploy, and test cycles. “We previously needed to work overnight to deploy to production,” says Pritesh. “Now using Google for Kubernetes containers and a rolling update strategy, we can deploy during the day without any problems or interruptions to service.”
The move to GCP streamlined AgroStar’s stack. “We were running 12 independent instances on AWS,” says Pritesh. “With Google Kubernetes Engine, we are deployed on a single cluster at a cost savings of $1,300 per month and growing.”
Improving customer response times by 85 percent
With a managed deployment capability, AgroStar can devote more time and resources to executing on its platform and Agri-Doctor app development plan. A strategic goal was managing customer response times as the firm grew its base. GCP has helped the firm meet that goal, achieving an 85 percent improvement in customer response times even as traffic grew significantly.
“With our on-premises solution, we could handle around 100 customers daily, which took 30 to 50 minutes for each customer,” says Pritesh. “We now handle thousands of customers daily, taking only 4 to 5 minutes for each one.”
AgroStar used Firebase to implement its Agri-Doctor app. A real-time cloud database, Firebase provides an API that enables the Agri-Doctor advice forum to be synchronized across all its far-flung mobile clients, effectively sharing knowledge base updates with one million users in near real time.
Using cloud tools to manage and monitor
Cloud Pub/Sub, Kafka, and Cloud Dataflow manage data ingestion and queueing of event and transaction data to the analytics layer. BigQuery fetches and persists data to Cloud Storage. Cloud SQL and dashboards powered by Tableau deliver farmer crop and soil profiles within minutes.
Cloud IAM helps AgroStar control access to all its cloud resources. And Stackdriver, the integrated logging aggregation capability for GCP, helps monitor and speed debugging on every tier of the AgroStar solution.
Machine learning to enhance yields
AgroStar is developing a variety of ML components to improve responsiveness and extend its platform offerings.
To speed up the diagnosis of and treatment for crop blight, AgroStar is building a deep learning pipeline using TensorFlow. The pipeline relies on GoogLeNet models that use multi-layered convolutional visual pattern recognition. It will assess uploaded images to support a disease-detection capability on the mobile app. Based on the commercially successful AI algorithms that automated postal code processing, GoogLeNet offers improved performance and computational efficiencies by using a creative layering technique that distinguishes them from older, sequential recognition engines.
To improve its customer search experience, AgroStar is developing an ML pipeline that shrinks fetch times by suggesting tags mapped to stored data. Processed using TPUs, Cloud Natural Language and Video AI, the tags provide a metadata layer that supports queries in any of the ten natural languages that AgroStar farmers can use.
The AgroStar search pipeline consists of Long Short-Term Memory (LSTM) models of Recurrent Neural Networks. Recurrent networks exhibit “memory” through iterative processing and are distinguished from feedforward networks by a feedback loop connected to their past decisions, ingesting their own outputs moment after moment as input.
Implementing a recommendation engine
The firm is also adapting the Random Forests TensorFlow AI model to develop a crop and product recommendation engine. The model is trained by consuming numerical (rainfall, humidity, water availability per acre) and categorical (soil type, water sources) parameters to suggest appropriate products by season, region, and locale.
To simplify the product suggestion experience, AgroStar developers are testing Cloud Dialogflow, the Google Cloud conversational interface, to build a chatbot capability into its mobile app. The bot will track a farmer’s crop schedules and answer simple questions by linking to the recommendation engine.
AgroStar is also extending its analytics platform with AI-powered sales planning and forecasting. Using linear regression models implemented in TensorFlow and powered by Cloud ML Engine, the capability will enhance supply chain logistics as the company scales its operations across India.
To provide a credit on-demand offering for a range of seed-to-harvest cycle products, AgroStar is attempting to use Vision API to create an AI model that will convert uploaded photos of customer application records into standard data formats. The firm’s credit policy features a grace period in which farmers begin paying back loans after harvested crops go to market.
A versatile and friendly development ecosystem
AgroStar credits the convivial tools and documentation that GCP offers and its incremental, pay-as-you-go pricing model for both the firm’s success and its ability to manage growth.
“What Google Cloud offers is extremely good documentation and extremely simple-to-use tools and interfaces across all services,” says Pritesh. “It helped us initially deploy our platform and at every scale that we have required since then, and its cost effectiveness enabled us to staff up to meet new feature milestones.”
BigQuery Helps Insurance Firms Leverage Previous Storm Data for Better Pricing Insights

8572
Of your peers have already read this article.
2:00 Minutes
The most insightful time you'll spend today!
It may be surprising to know that U.S. natural catastrophe economic losses totaled $119 billion in 2020, and 75% (or $89.4B) of those economic losses were caused by severe storms and cyclones. In the insurance industry, data is everything. Insurers use data to influence underwriting, rating, pricing, forms, marketing, and even claims handling. When fueled by good data, risk assessments become more accurate and produce better business results. To make this possible, the industry is increasingly turning to predictive analytics, which uses data, statistical algorithms, and machine learning (ML) techniques to predict future outcomes based on historical data. Insurance firms also integrate external data sources with their own existing data to generate more insight into claimants and damages. Google Cloud Public Datasets offers more than 100 high-demand public datasets through BigQuery that helps insurers in these sorts of data “mashups.”
One particular dataset that insurers find very useful is Severe Storm Event Details from the U.S. National Oceanic and Atmospheric Administration (NOAA). As part of the Google Cloud Public Datasets program and NOAA’s Public Data Program, this severe storm data contains various types of storm reports by state, county, and event type—from 1950 to the present—with regular updates. Similar NOAA datasets within the Google Cloud Public Datasets program include the Significant Earthquake Database, Global Hurricane Tracks, and the Global Historical Tsunami Database.
In this post, we’ll explore how to apply storm event data for insurance pricing purposes using a few common data science tools—Python Notebook and BigQuery—to drive better insights for insurers.
Predicting outcomes with severe storm datasets
For property insurers, common determinants of insurance pricing include home condition, assessor and neighborhood data, and cost-to-replace. But macro forces such as natural disasters—like regional hurricanes, flash floods, and thunderstorms—can also significantly contribute to the risk profile of the insured. Insurance companies can leverage severe weather data for dynamic pricing of premiums by analyzing the severity of those events in terms of past damage done to property and crops, for example.
It’s important to set the premium correctly, however, considering the risks involved. Insurance companies now run sophisticated statistical models, taking into account various factors—many of which can change over time. After all, without accurate data, poor predictions can lead to business losses, particularly at scale.
The Severe Storm Event Details database includes information about a storm event’s location, azimuth (an angle measurement used in celestial coordination), distance, impact, and severity, including the cost of damages to property and crops. It documents:
- The occurrence of storms and other significant weather events of sufficient intensity to cause loss of life, injuries, significant property damage, and/or disruption to commerce.
- Rare, unusual weather events that generate media attention, such as snow flurries in South Florida or the San Diego coastal area.
- Other significant weather events, such as record maximum or minimum temperatures or precipitation that occur in connection with another event.
Data about a specific event is added to the dataset within 120 days to allow time for damage assessments and other analysis.
Driving business insights with BigQuery and notebooks
Google Cloud’s BigQuery provides easy access to this data in multiple ways. For example, you can query directly within BigQuery and perform analysis using SQL.
Another popular option in the data science and analyst community is to access BigQuery from within the Notebook environment to intersperse Python code and SQL text, and then perform ad hoc experimentation. This uses the powerful BigQuery compute to query and process huge amounts of data without having to perform the complex transformations within the memory in Pandas, for example.
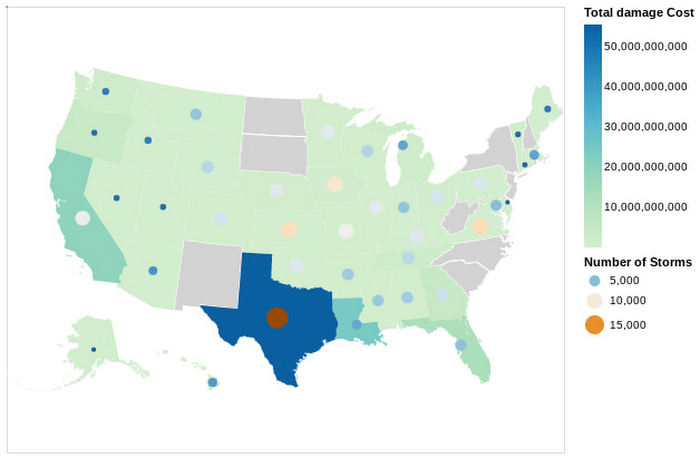
In this Python notebook, we have shown how the severe storm data can be used to generate risk profiles of various zip codes based on the severity of those events as measured by the damage incurred. The severe storm dataset is queried to retrieve a smaller dataset into the notebook, which is then explored and visualized using Python. Here’s a look at the risk profiles of the zip codes:
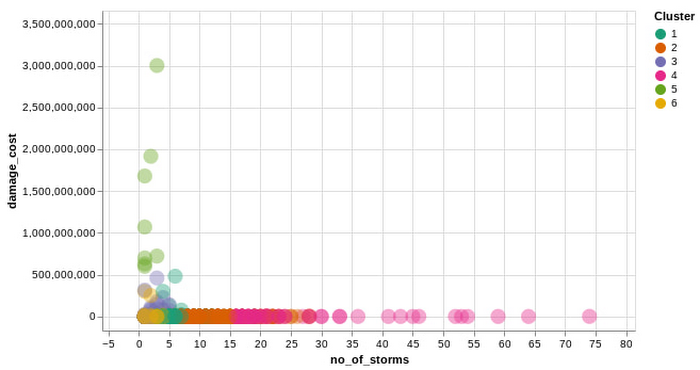
Another Google Cloud resource for insurers is BigQuery ML, which allows them to create and execute machine learning models on their data using standard SQL queries. In this notebook, with a K-Means Clustering algorithm, we have used BigQuery ML to generate different clusters of zip codes in the top five states impacted by severe storms. These clusters show different levels of impact by the storms, indicating different risk groups.
The example notebook is a reference guide to enable analysts to easily incorporate and leverage public datasets to augment their analysis and streamline the journey to business insights. Instead of having to figure out how to access and use this data yourself, the public datasets, coupled with BigQuery and other solutions, provide a well-lit path to insights, leaving you more time to focus on your own business solutions.
Making an impact with big data
Google Cloud’s Public Datasets is just one resource within the broader Google Cloud ecosystem that provides data science teams within the financial services with flexible tools to gather deeper insights for growth. The severe storm dataset is a part of our environmental, social, and governance (ESG) efforts to organize information about our planet and make it actionable through technology, helping people make a positive impact together.
To learn more about this public dataset collaboration between Google Cloud and NOAA, attend the Dynamic Pricing in Insurance: Leveraging Datasets To Predict Risk and Price session at the Google Cloud Financial Services Summit on May 27. You can also check out our recent blog and explore more about BigQuery and BigQuery ML.
6522
Of your peers have already watched this video.
46:30 Minutes
The most insightful time you'll spend today!
The Inside Story of How Home Depot Migrated to Google BigQuery From an On-prem DW Solution
In the media, you will often hear story of how born-in-the-cloud companies manage with massive infrastructure.
But it is one thing is to be a startup, and build infrastructure with bespoke requirements. And quite another to have a complex, multinational organization with online, with mobile, with brick-and-mortar presence, and hundreds of thousands of SKUs and professional services, and many, many years of technology, innovation, and really smart engineers.
This is the second story. The story of how The Home Depot, the number-one home improvement retailer in the US pulled of that feat.
The Home Depot has over 2,200 stores, over 4 lakh associates, and 2017 revenues of over a $100 billion.
In this video, Rick Ramaker, technology director, data analytics at The Home Depot, and Kevin Scholz, distinguished engineer, The Home Depot, talk about how the company transformed and modernised its data warehousing, the challenges they faced and the benefits they accrued from the project.
It’s a fascinating watch!
Two Ways to Deploy SAP HANA System on Google Cloud

7906
Of your peers have already read this article.
4:00 Minutes
The most insightful time you'll spend today!
Many of the world’s leading companies run on SAP—and deploying it on Google Cloud extends the benefits of SAP even further. Migrating your current SAP S/4HANA deployment to Google Cloud—whether it resides on your company’s on-premises servers or another cloud service—provides your organization with a flexible virtualized architecture that lets you scale your environment to match your workloads, so you pay only for the compute and storage capacity you need at any given moment. Google Cloud includes built-in features, such as Compute Engine live migration and automatic restart, that minimize downtime for infrastructure maintenance. And it allows you to integrate your SAP data with multiple data sources and process it using Google Cloud technology such as BigQuery to drive data analytics.
SAP server-side architecture consists of two layers: the SAP HANA database, and the Netweaver application layer. In this blog post, we’ll look at the options and steps for moving the database layer to Google Cloud as a lift and shift or rehost, a straightforward approach that entails moving your current SAP environment unchanged onto Google Cloud.
Deploying an SAP HANA system on Google Cloud
Google Cloud offers SAP-certified virtual machines (VMs) optimized for SAP products, including SAP HANA and SAP HANA Enterprise Cloud, as well as dedicated servers for SAP HANA for environments greater than 12TB. (For a complete list of VM and hardware options, visit the Certified and Supported SAP HANA Hardware Directory.)
Before proceeding with a rehost migration to Google Cloud, your current (source) environment and Google Cloud (target) environments should meet these specifications:
Prerequisites:
- The configuration of the Google Cloud environment (i.e., VM resources, SSD storage capacity) should be identical to that of the source environment. If the underlying hardware is different, however, you must use Option 2 for your migration, detailed below.
- Both environments should be running the same operating system (SUSE or RHEL Linux).
- The HANA version, instance number, and system ID (SID) should be identical.
- Schema names must remain the same.
- Establishing the network connection between the on-premises environment and Google Cloud will be required in this phase to support rehost of the SAP application.you can use Cloud VPN or Dedicated Interconnect. Learn more about Dedicated Interconnect and Cloud VPN.
Note: Depending on your internet connection and bandwidth requirements, we recommend using a Dedicated Interconnect over Cloud VPN for production environments.
We offer a number of automated processes to accelerate your cloud journey. To deploy the SAP HANA system on Google Cloud, you can use the Google Cloud Deployment manager or Terraform and Ansible scripts available on GitHub with configuration file templates to define your installation. For more details, see the Google Cloud SAP HANA Planning Guide.
Note: To deploy SAP HANA on Google Cloud machine types that are certified by SAP for production, please review the Certification for SAP HANA on Google Cloud page.
Moving an SAP HANA Database to Google Cloud
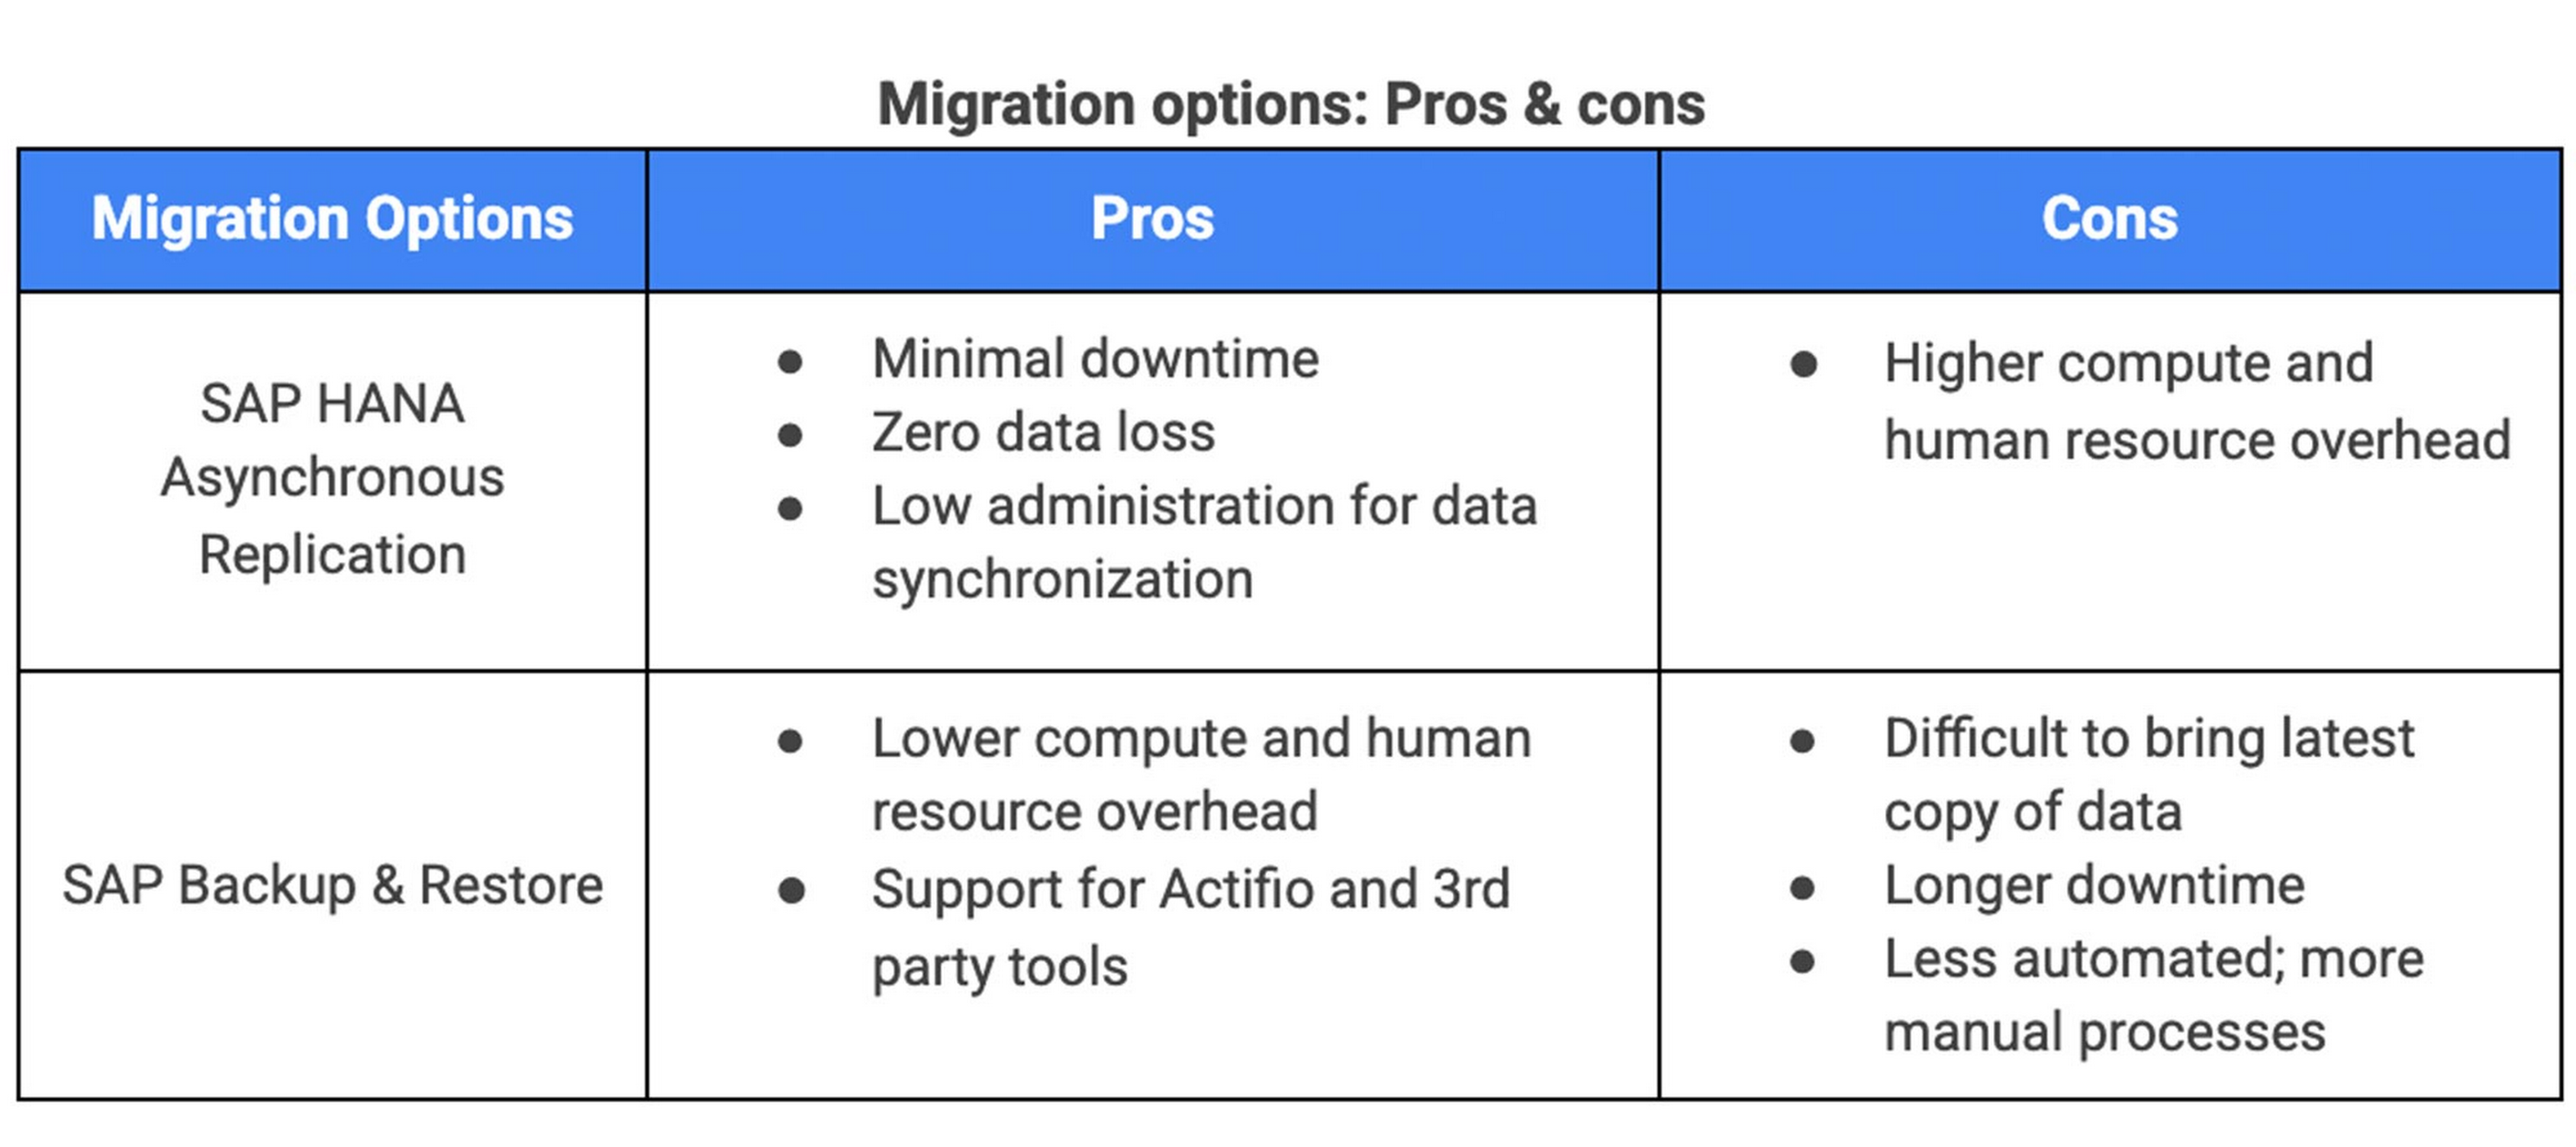
There are two different options you can use to rehost your SAP HANA database to Google Cloud, and each has pros and cons that you should consider when deciding on your approach.
Option 1: Asynchronous replication uses SAP’s built-in replication tool to provide continuous data replication from the source system (also known as the primary system) to the destination or secondary system—in this case residing on Google Cloud. It’s best for mission-critical applications for which minimum downtime is a high priority, and for large databases. In addition, the high level of automation means that the process requires less manual intervention. Here’s where you can learn more on HANA Asynchronous Replication.
Option 2: Backup and restore relies on SAP’s backup utility to create an image of the database that is then transferred to Google Cloud, where it is restored in the new environment. Downtime for this method varies by database size, so large databases may require more downtime via this method vs. asynchronous replication. It also involves more manual tasks. However, it requires fewer resources to perform, making it an attractive option for less urgent use cases. Here’s where you can learn more on SAP HANA database Backup and restore.
How to migrate the SAP HANA database to Google Cloud using Asynchronous Replication
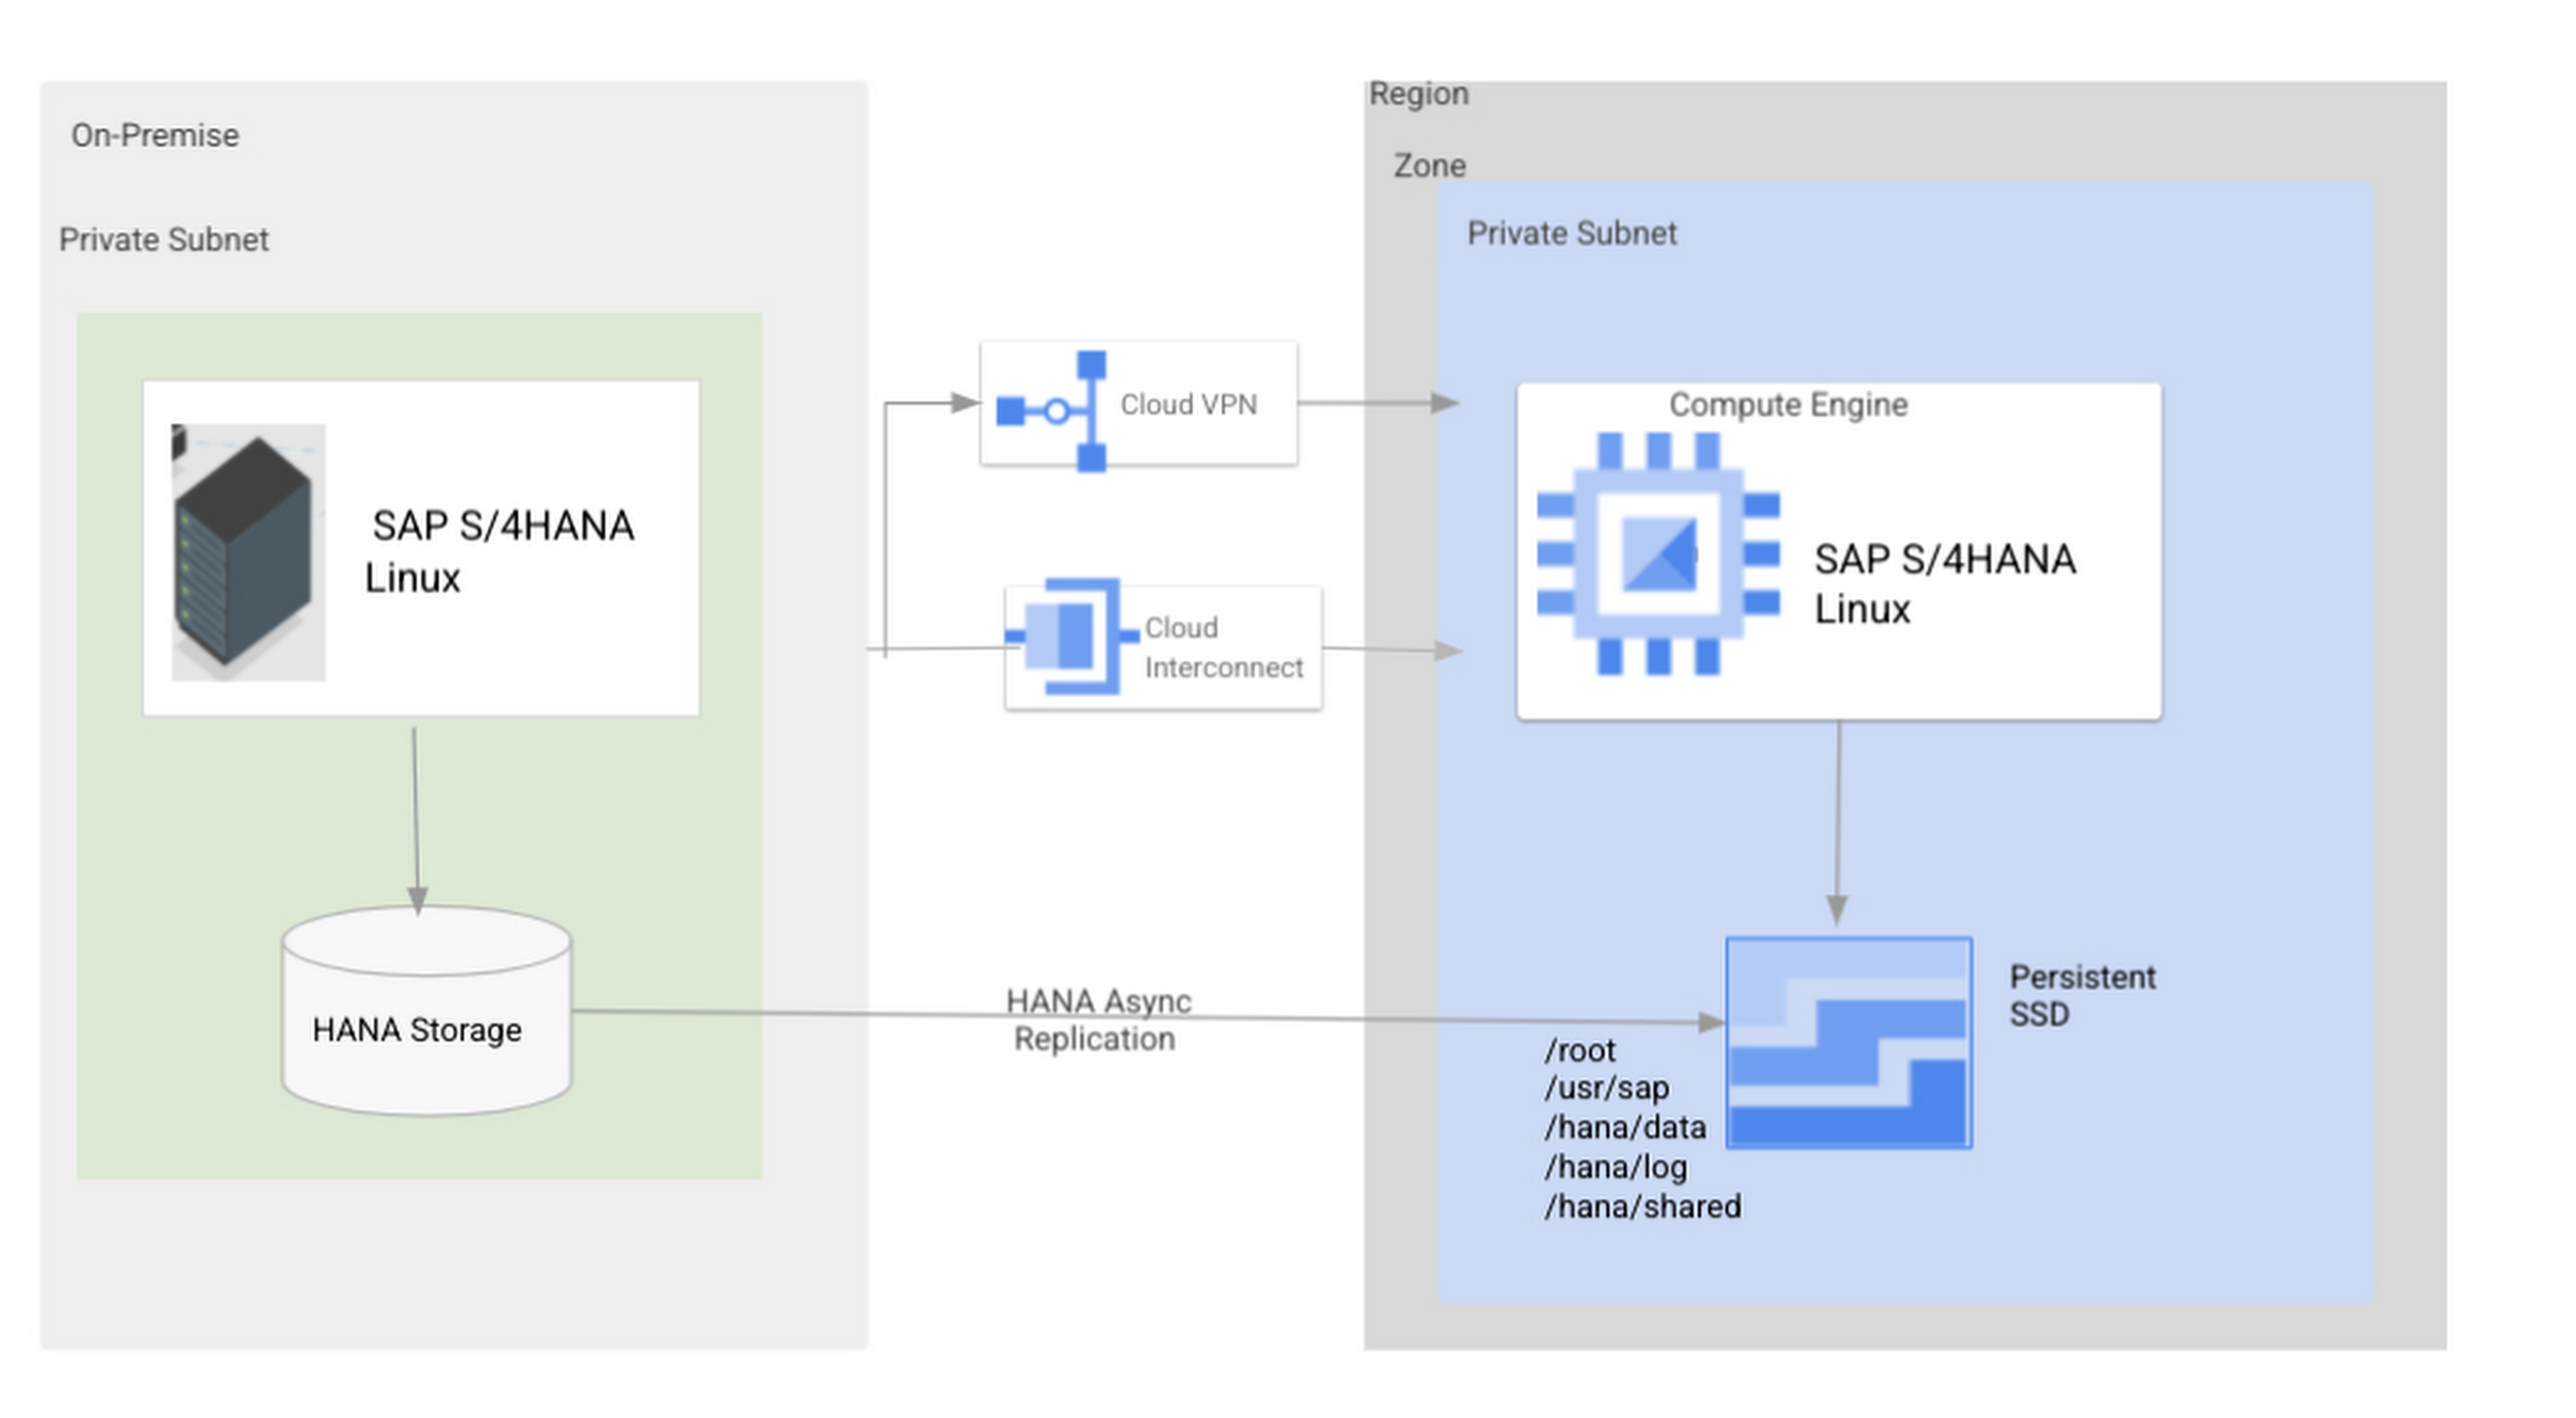
- Create and configure Dedicated Interconnect or Cloud VPN between the current environment and Google Cloud.
- Set up SAP HANA asynchronous replication. You can configure system replication using SAP HANA Cockpit, SAP HANA Studio, or hdbnsutil. See Setting Up SAP HANA System Replication in the SAP HANA Administration Guide.
- Be sure to use the same instance number and HANA SID in the template as the primary instance.
- Configure the Google Cloud instance as the secondary node for using HANA Asynchronous replication.
- Perform data validation once full data replication is completed to the SAP HANA database in Google Cloud. To learn more: HANA System Replication overview.
- Perform an SAP HANA takeover on your standby database. This switches your active system from the current primary system onto the secondary system on Google Cloud. Once the takeover command runs, the system on Google Cloud becomes the new primary system.To learn more: HANA Takeover.
How to migrate the SAP HANA database to Google Cloud using Backup and Restore
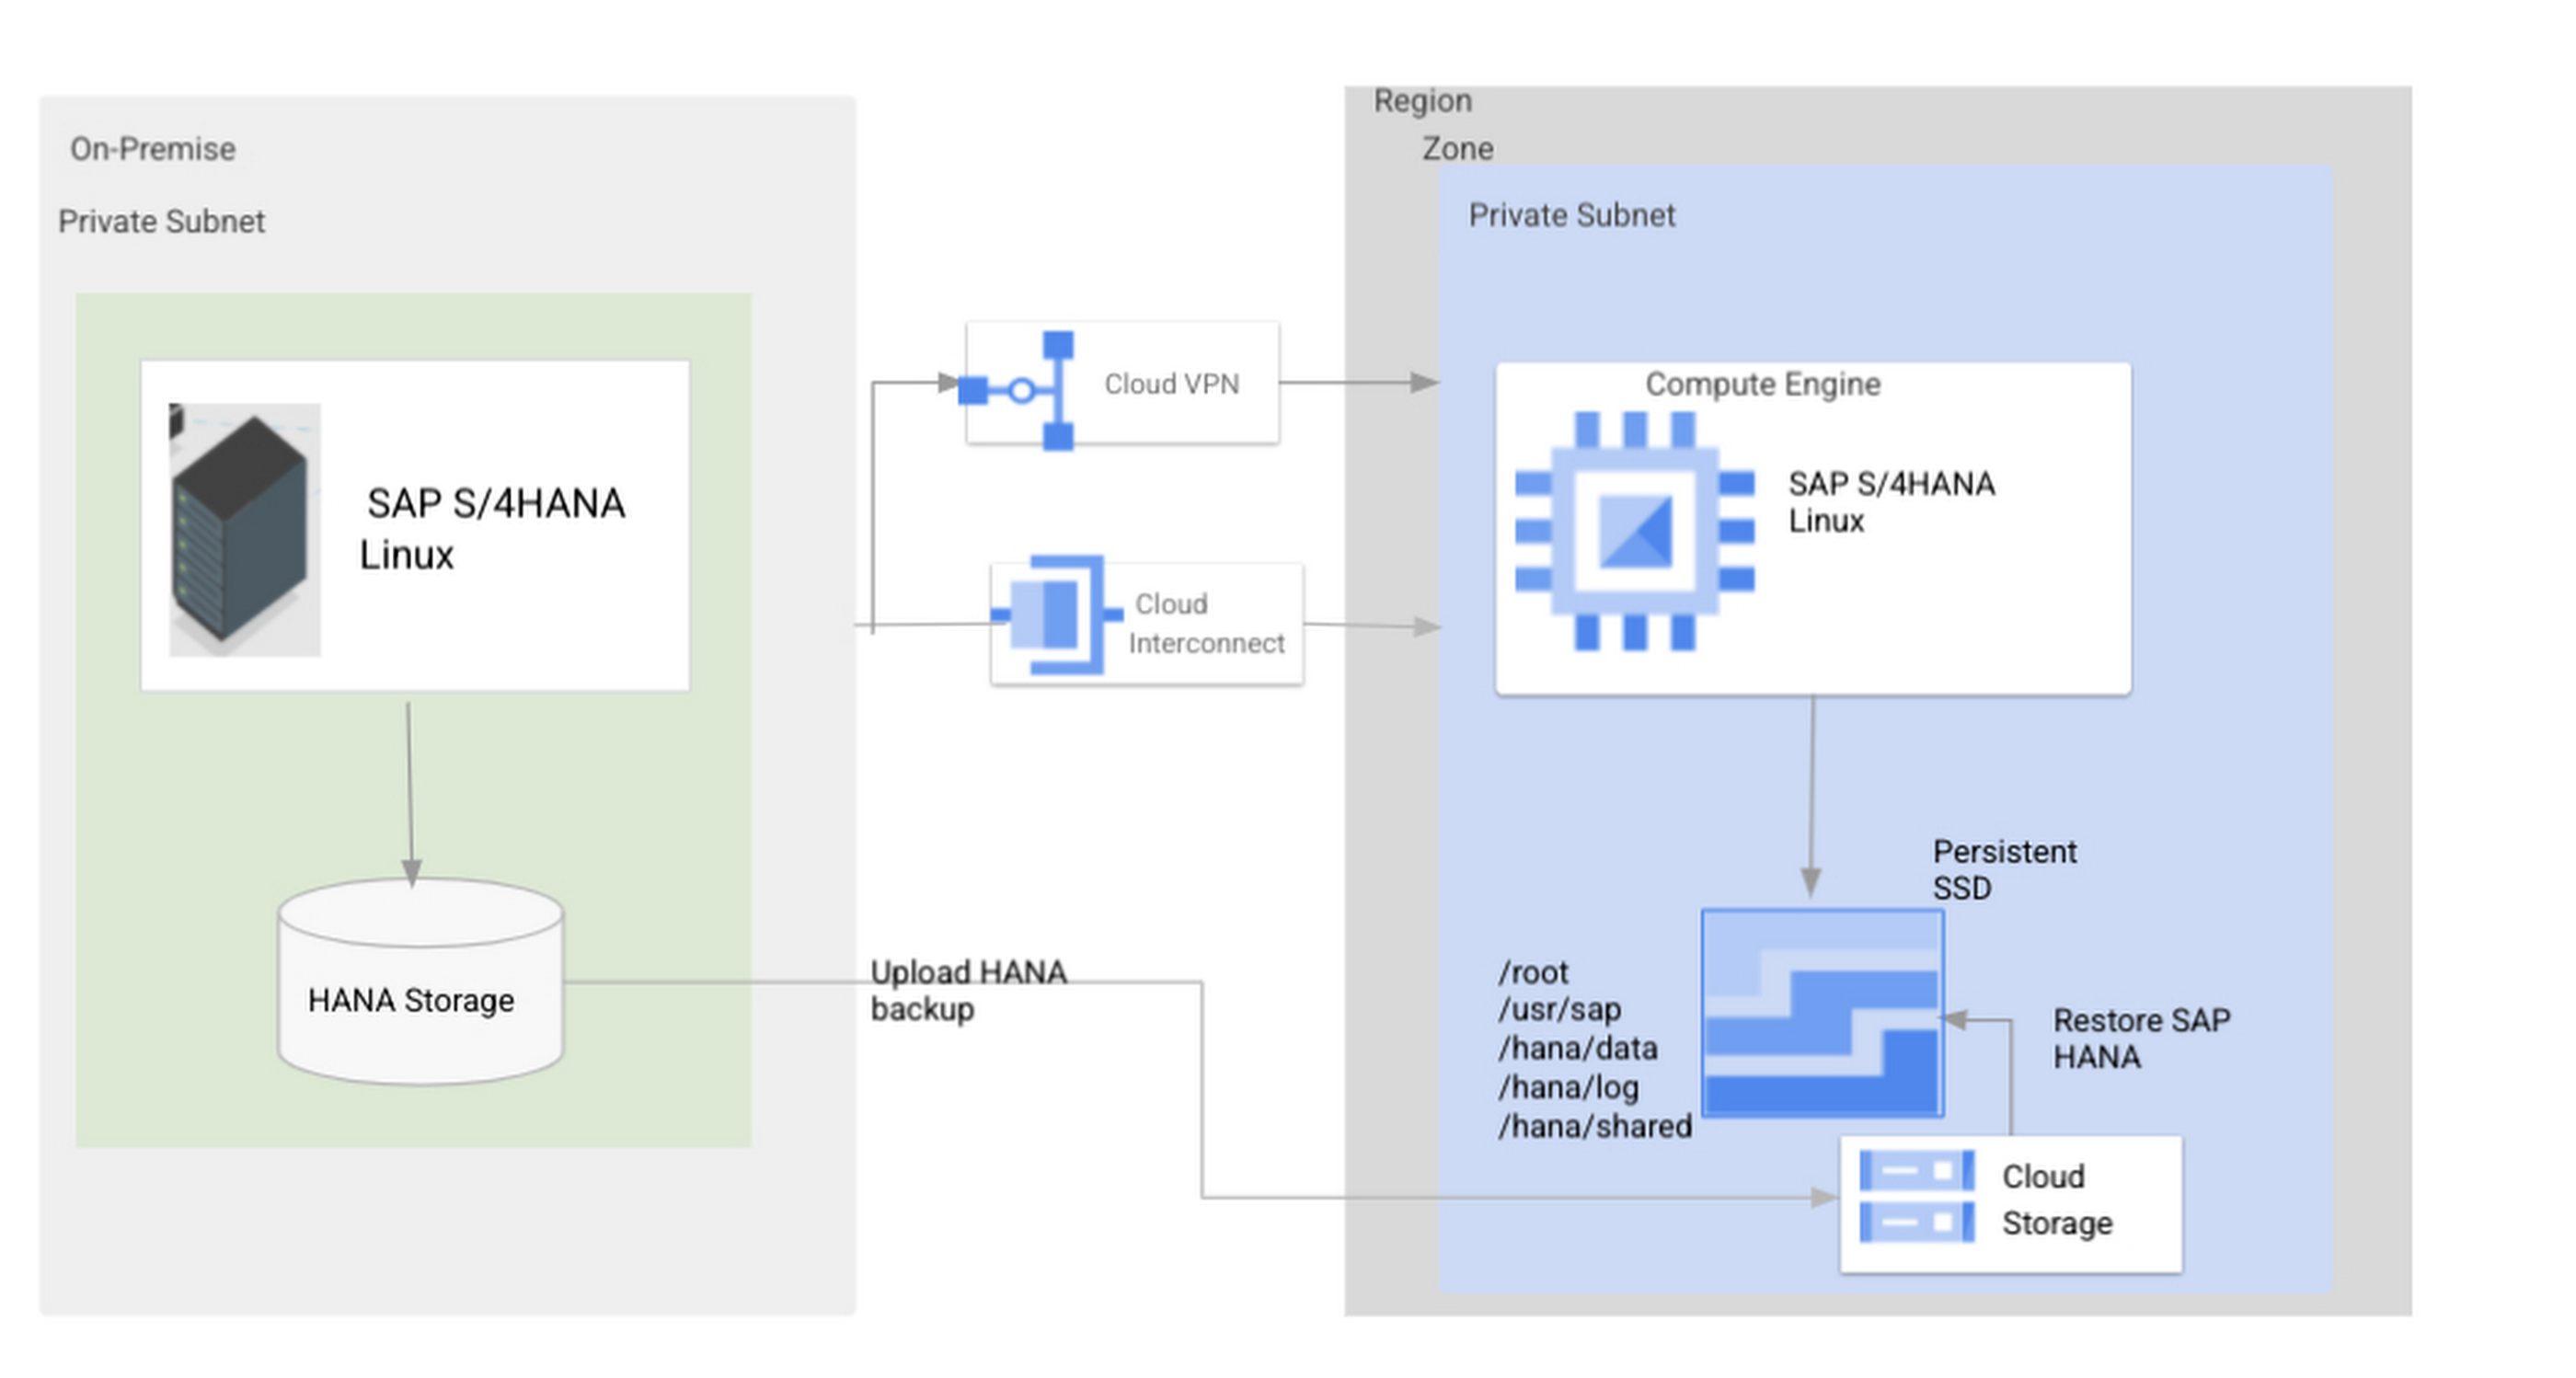
- Create a full backup of your SAP HANA database in your current environment.
- Create a new storage bucket in your Google Cloud environment. Visit Creating Storage Buckets in the Google Cloud Storage documentation.
- Download and install gsutil onto the source environment and run it to upload the HANA backup to the Google Cloud storage bucket. To install gsutil utility on any computer or server, visit Install gsutil in the Google Cloud Storage documentation.
Note: You can run parallel multi thread/multi processing in gsutil to copy large files more quickly. - Recover the HANA database on Google Cloud using SAP’s RECOVER DATABASE statement. See RECOVER DATABASE Statement (Backup and Recovery) in the SAP HANA SQL Reference Guide for SAP HANA Platform.
Note: BackInt agent is an integrated SAP interface tool used for HANA database on Google Cloud.Backint agent for SAP HANA can be used to store and retrieve backups directly from Google Cloud Storage. It is supported and certified by SAP on Google Cloud. To learn more: SAP HANA Backint Agent on Google Cloud.
In summary, we recommend using Asynchronous Replication (Option 1) for mission-critical applications that require the lowest downtime window. For all other applications, we recommend Backup and Restore (Option 2), as this approach requires fewer resources. It’s also a great way to implement the backup and restore functionality on Google Cloud.
A rehost migration is the most straightforward path to getting your SAP on HANA system up and running on Google Cloud. And the sooner you migrate, the sooner you can take advantage of the many benefits Google Cloud brings to your SAP solution. For more information on the different migration options please review: SAP on Google Cloud: Migration strategies.
Learn more about deploying SAP on Google Cloud. Technical resources can be found here.
More Relevant Stories for Your Company

Google’s Anti-Pattern Recognition Tool: Streamlining BigQuery Performance
Why do we need a BigQuery anti-pattern recognition tool? BigQuery is a serverless and cost-effective enterprise data warehouse that works across cloud environments and scales with your data. As with any large scale data-intensive platform, following best practices and avoiding inefficient anti-patterns goes a long way in terms of performance and cost

Google Cloud and Climate Engine Collaborate to Support Climate Action in Public Sector
While there is uncertainty about how much the climate will change in the future, we know it won’t look like the past. Extreme weather events will increase in frequency and severity; the world will continue to warm, and the cost of climate change will increase. Government plays a vital role

2022 Healthcare Trends: Healthcare Data, M&As, Better Patient Care, AI in Drug Development & Strategic Partnerships
The COVID-19 pandemic continues to push the healthcare and life sciences industry in entirely new ways. In record time, we’ve witnessed public health officials, vaccine developers, equipment manufacturers, and essential workers take life saving actions—regularly putting their own lives at risk—to respond to the exceptional challenges of our time. Yet

Dataflow is getting better with Dataflow Prime, Dataflow Go, and Dataflow ML
By the end of 2024, 75% of enterprises will shift from piloting to operationalizing artificial intelligence according to IDC, yet the growing complexity of data types, heterogeneous data stacks and programming languages make this a challenge for all data engineers. With the current economic climate, doing more with cheaper costs
