





AI in Manufacturing Already A Mainstream: Google Cloud Study

5666
Of your peers have already read this article.
3:00 Minutes
The most insightful time you'll spend today!
While the promise of artificial intelligence transforming the manufacturing industry is not new, long-ongoing experimentation hasn’t yet led to widespread business benefits. Manufacturers remain in “pilot purgatory,” as Gartner reports that only 21% of companies in the industry have active AI initiatives in production.
However, new research from Google Cloud reveals that the COVID-19 pandemic may have spurred a significant increase in the use of AI and other digital enablers among manufacturers. According to our data—which polled more than 1,000 senior manufacturing executives across seven countries—76% have turned to digital enablers and disruptive technologies due to the pandemic such as data and analytics, cloud, and artificial intelligence (AI). And 66% of manufacturers who use AI in their day-to-day operations report that their reliance on AI is increasing.

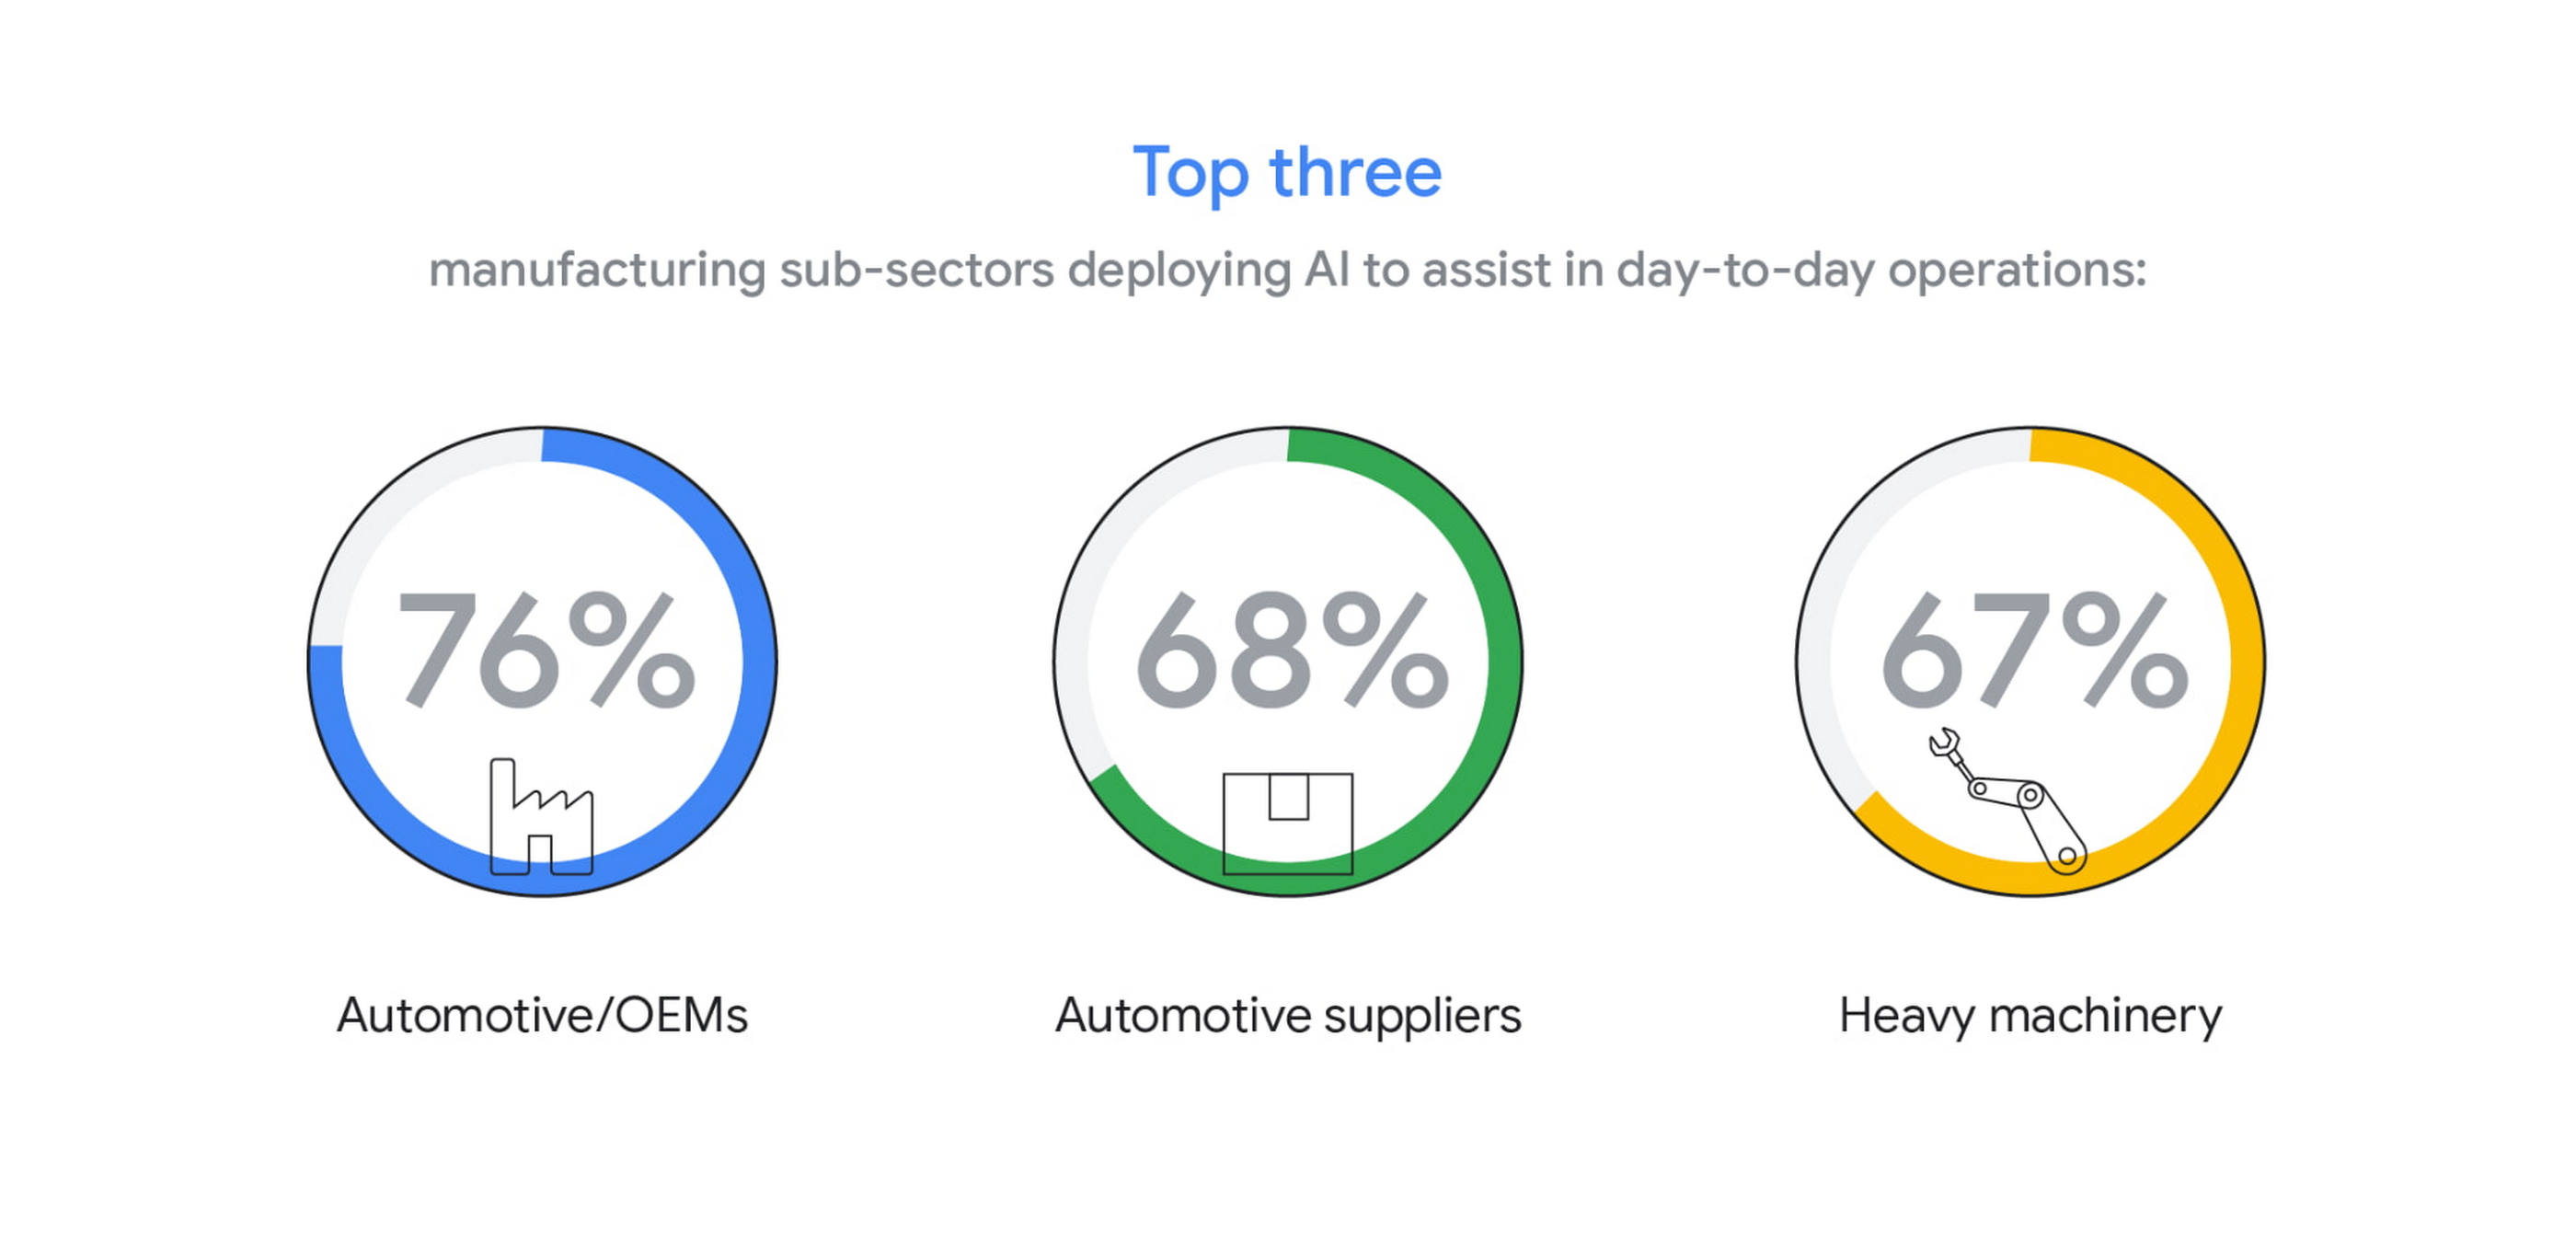
The top three sub-sectors deploying AI to assist in day-to-day operations are automotive/OEMs (76%), automotive suppliers (68%), and heavy machinery (67%).
In fact, Bryan Goodman, Director of Artificial Intelligence and Cloud, Ford Global Data & Insight and Analytics shares, “Our new relationship with Google will supercharge our efforts to democratize AI across our business, from the plant floor to vehicles to dealerships. We used to count the number of AI and machine learning projects at Ford. Now it’s so commonplace that it’s like asking how many people are using math. This includes an AI ecosystem that is fueled by data, and that powers a ‘digital network flywheel.’”
Moving from edge cases to mainstream business needs
Why are manufacturers now turning to AI in increasing numbers? Our research shows that companies who currently use AI in day-to-day operations are looking for assistance with business continuity (38%), helping make employees more efficient (38%), and to be helpful for employees overall (34%). It’s clear that AI/ML technology can augment manufacturing employees’ efforts, whether by providing prescriptive analytics like real-time guidance and training, flagging safety hazards, or detecting potential defects on the assembly line.

In terms of specific AI use cases called out by the research, two main areas emerged: quality control and supply chain optimization. In the quality control category, 39% of surveyed manufacturers who use AI in their day-to-day operations use it for quality inspection and 35% for product and/or production line quality checks. At Google Cloud, we often speak with manufacturers about AI for visual inspection of finished products. Using AI vision, production line workers can spend less time on repetitive product inspections and can instead focus on more complex tasks, such as root cause analysis.
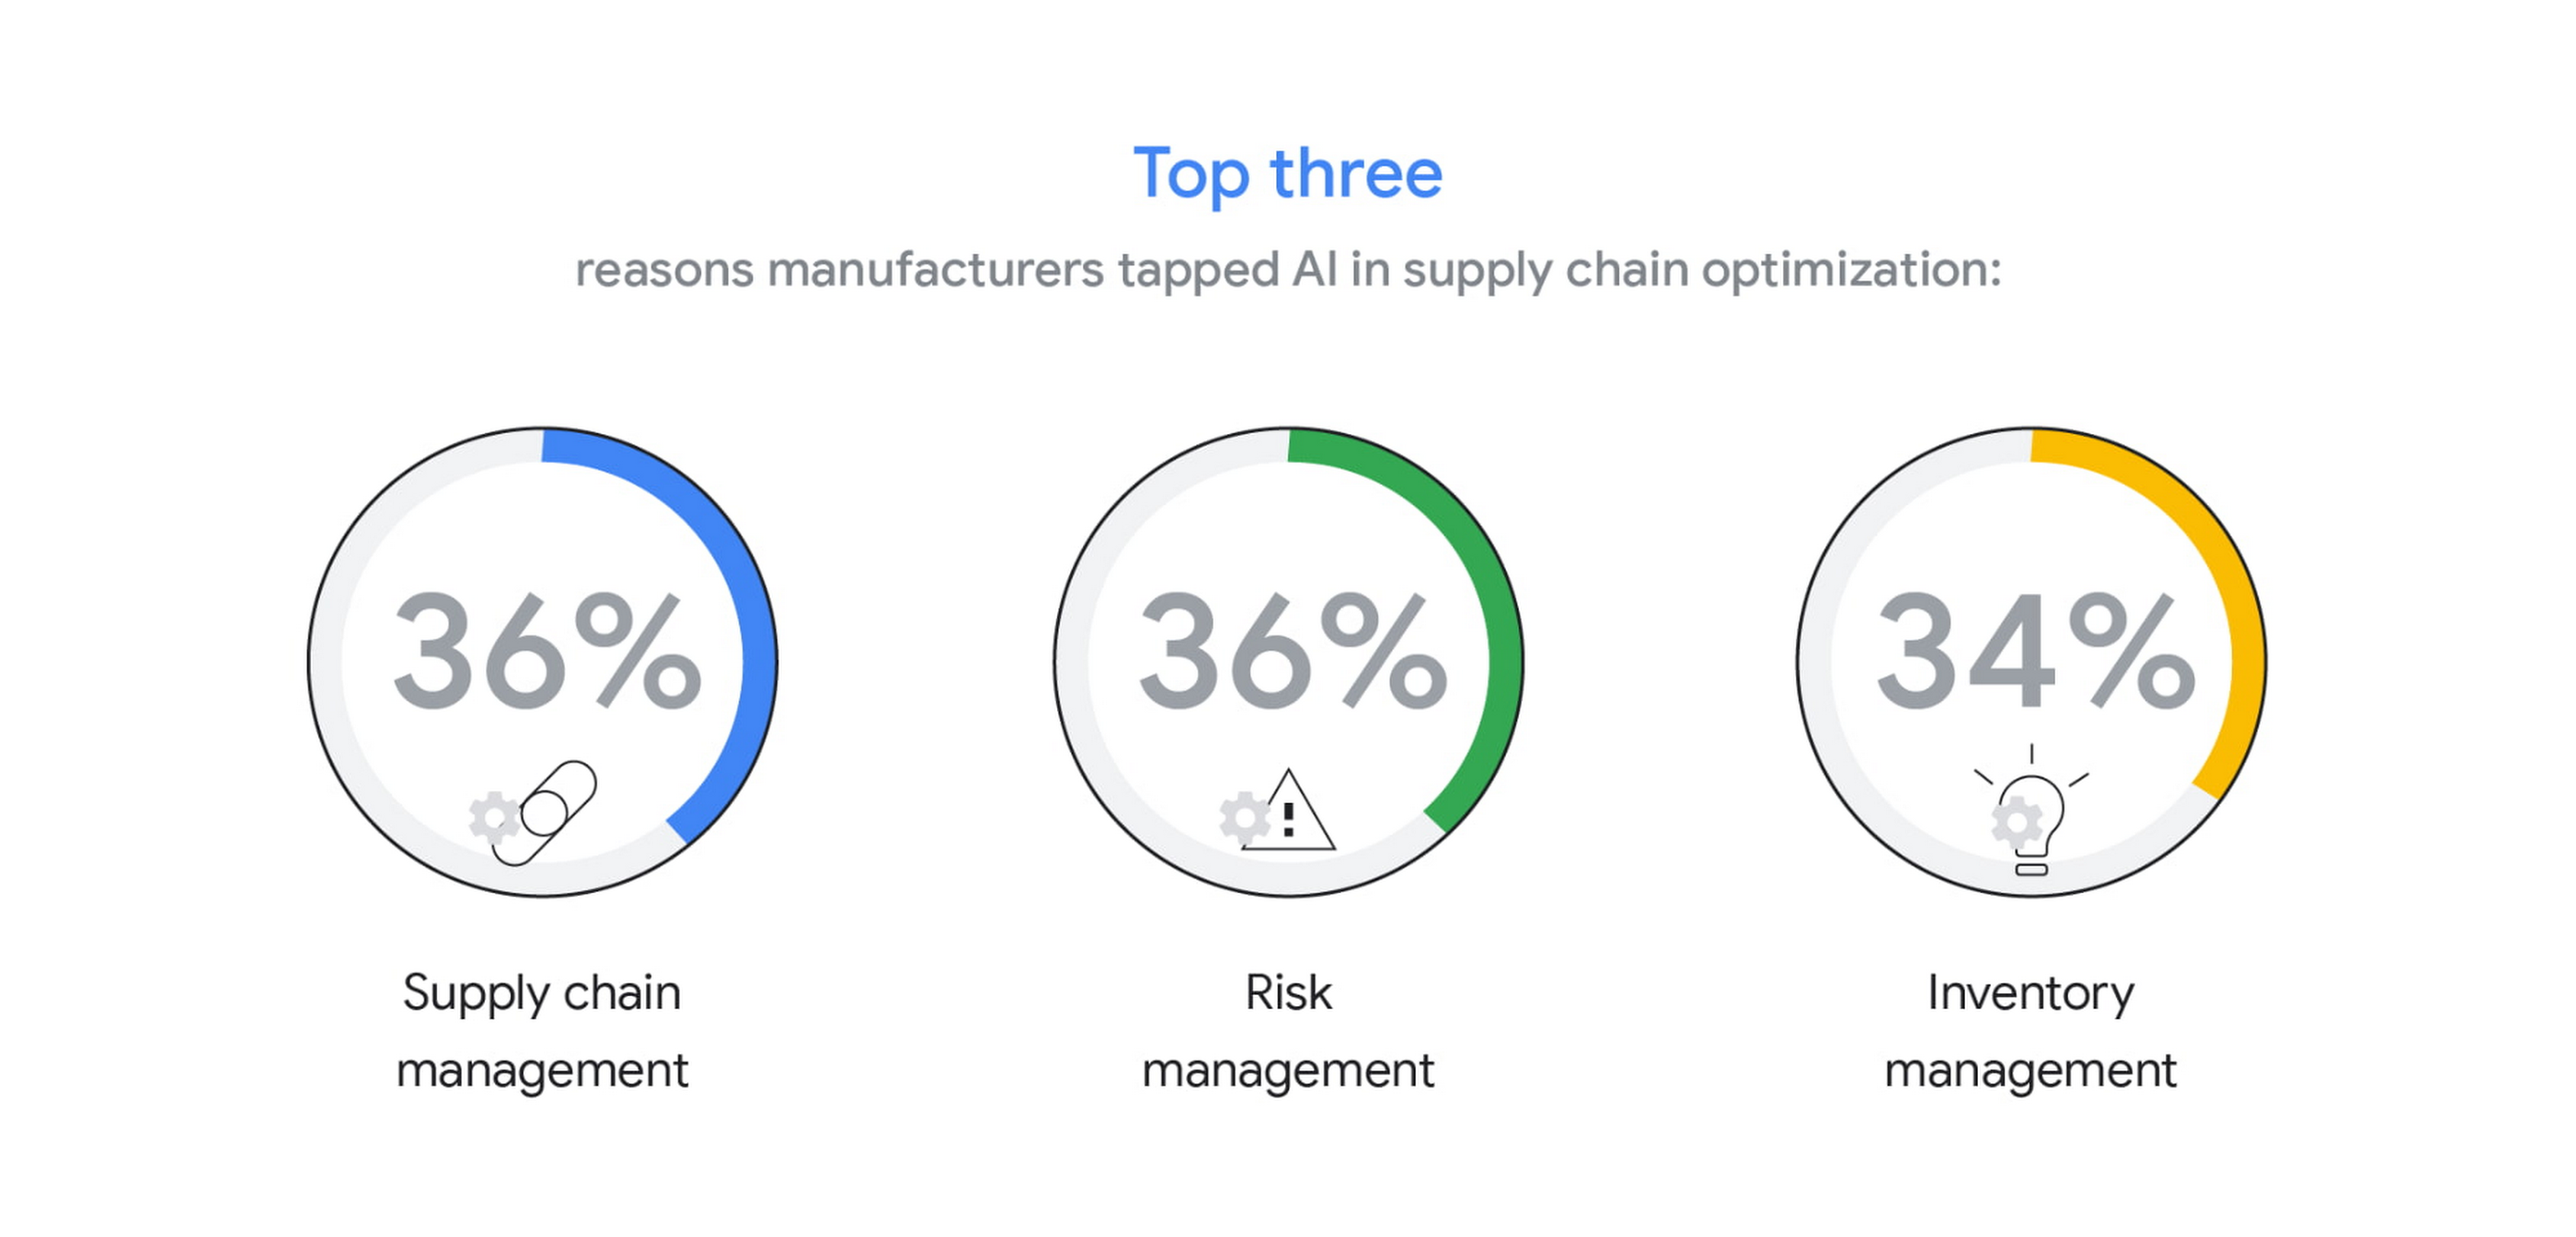
In the supply chain optimization category, manufacturers said they tapped AI for supply chain management (36%), risk management (36%), and inventory management (34%).
In our day-to-day work, we’re seeing many manufacturers rethink their supply chains and operating models to better accommodate for the increased volatility that has been brought about by the pandemic and support the secular trend of consumers asking for increasingly individualized products. We’ll share more on deglobalization in the third installment of our manufacturing insights series.
AI use differs by geography, but not for the reasons you may think
The extent to which AI is already being used today varies quite strongly between geographies, according to our research. While 80% and 79% of manufacturers in Italy and Germany respectively report using AI in day-to-day operations, that percentage plummets in the United States (64%), Japan (50%) and Korea (39%).

It’s tempting to state this disparity is due to an “AI talent gap.” Although the most common barrier, just a quarter (23%) of manufacturers surveyed believe they don’t have the talent to properly leverage AI. Cost, too, does not appear to be a roadblock (21% of those surveyed). Rather, from our observations, the missing link appears to be having the right technology platform and tools to manage a production-grade AI pipeline. This is obviously the focus of our efforts and others in the space, as we believe the cloud can truly help the industry make a step change.
Looking ahead: The Golden Age of AI for manufacturing
The key to widespread adoption of AI lies in its ease of deployment and use. As AI becomes more pervasive in solving real-world problems for manufacturers, we see the industry moving away from “pilot purgatory” to the “golden age of AI.” The manufacturing industry is no stranger to innovation, from the days of mass production, to lean manufacturing, six sigma and, more recently, enterprise resource planning. AI promises to bring even more innovation to the forefront.
To learn more about these findings and more, download our infographic here and our full report here.
Research methodology
The survey was conducted online by The Harris Poll on behalf of Google Cloud, from October 15 – November 4, 2020, among 1,154 senior manufacturing executives in France (n=150), Germany (n=200), Italy (n=154), Japan (n=150), South Korea (n=150), the UK (n=150), and the U.S. (n=200) who are employed full-time at a company with more than 500 employees, and who work in the manufacturing industry with a title of director level or higher. The data in each country were weighted by number of employees to bring them into line with actual company size proportions in the population. A global post-weight was applied to ensure equal weight of each country in the global total.
Smart Reply: How the AI-augmented Chat Helps Scale Google’s Tech Support Operations

2898
Of your peers have already read this article.
3:00 Minutes
The most insightful time you'll spend today!
As Googlers transitioned to working from home during the pandemic, more and more turned to chat-based support to help them fix technical problems. Google’s IT support team looked at many options to help us meet the increased demand for tech support quickly and efficiently.
More staff? Not easy during a pandemic.
Let service levels drop? Definitely not.
Outsource? Not possible with our IT requirements.
Automation? Maybe, just maybe…
How could we use AI to scale up our support operations, making our team more efficient?
The answer: Smart Reply, a technology developed by a Google Research team with expertise in machine learning, natural language understanding, and conversation modeling. This product provided us with an opportunity to improve our agents’ ability to respond to queries from Googlers by using our corpus of chat data. Smart Reply trains a model that provides suggestions to techs in real time. This reduces the cognitive load when multi-chatting and helps a tech drive sessions towards resolution.

In the solution detailed below, our hope is that IT teams in a similar situation can find best practices and a few shortcuts to implementing the same kind of time saving solutions. Let’s get into it!
Challenges in preparing our data
Our tech support service for Google employees—Techstop—provides a complex service, offering support for a range of products and technology stacks through chat, email, and other channels.
Techstop has a lot of data. We receive hundreds of thousands of requests for help per year. As Google has evolved we’ve used a single database for all internal support data, storing it as text, rather than as protocol buffers. Not so good for model training. To protect user privacy, we want to ensure no PII (personal identifiable information – e.g. usernames, real names, addresses, or phone numbers) makes it into the model.
To address these challenges we built a FlumeJava pipeline that takes our text and splits each message sent by agent and requester into individual lines, stored as repeated fields in a protocol buffer. As our pipe is executing this task, it also sends text to the Google Cloud DLP API, removing personal information from the session text, replacing it with a redaction that we can later use on our frontend.
With the data prepared in the correct format, we are able to begin our model training. The model provides next message suggestions for techs based on the overall context of the conversation. To train the model we implemented tokenization, encoding, and dialogue attributes.
Splitting it up
The messages between the agent and customer are tokenized: broken up into discrete chunks for easier use. This splitting of text into tokens must be carefully considered for several reasons:
- Tokenization determines the size of the vocabulary needed to cover the text.
- Tokens should attempt to split along logical boundaries, aiming to extract the meaning of the text.
- Tradeoffs can be made between the size of each token, with smaller tokens increasing processing requirements but enabling easier correlation between different spans of text.
There are many ways to tokenize text (SAFT, splitting on white spaces, etc.), here we chose sentence piece tokenization, with each token referring to a word segment.
Prediction with encoders
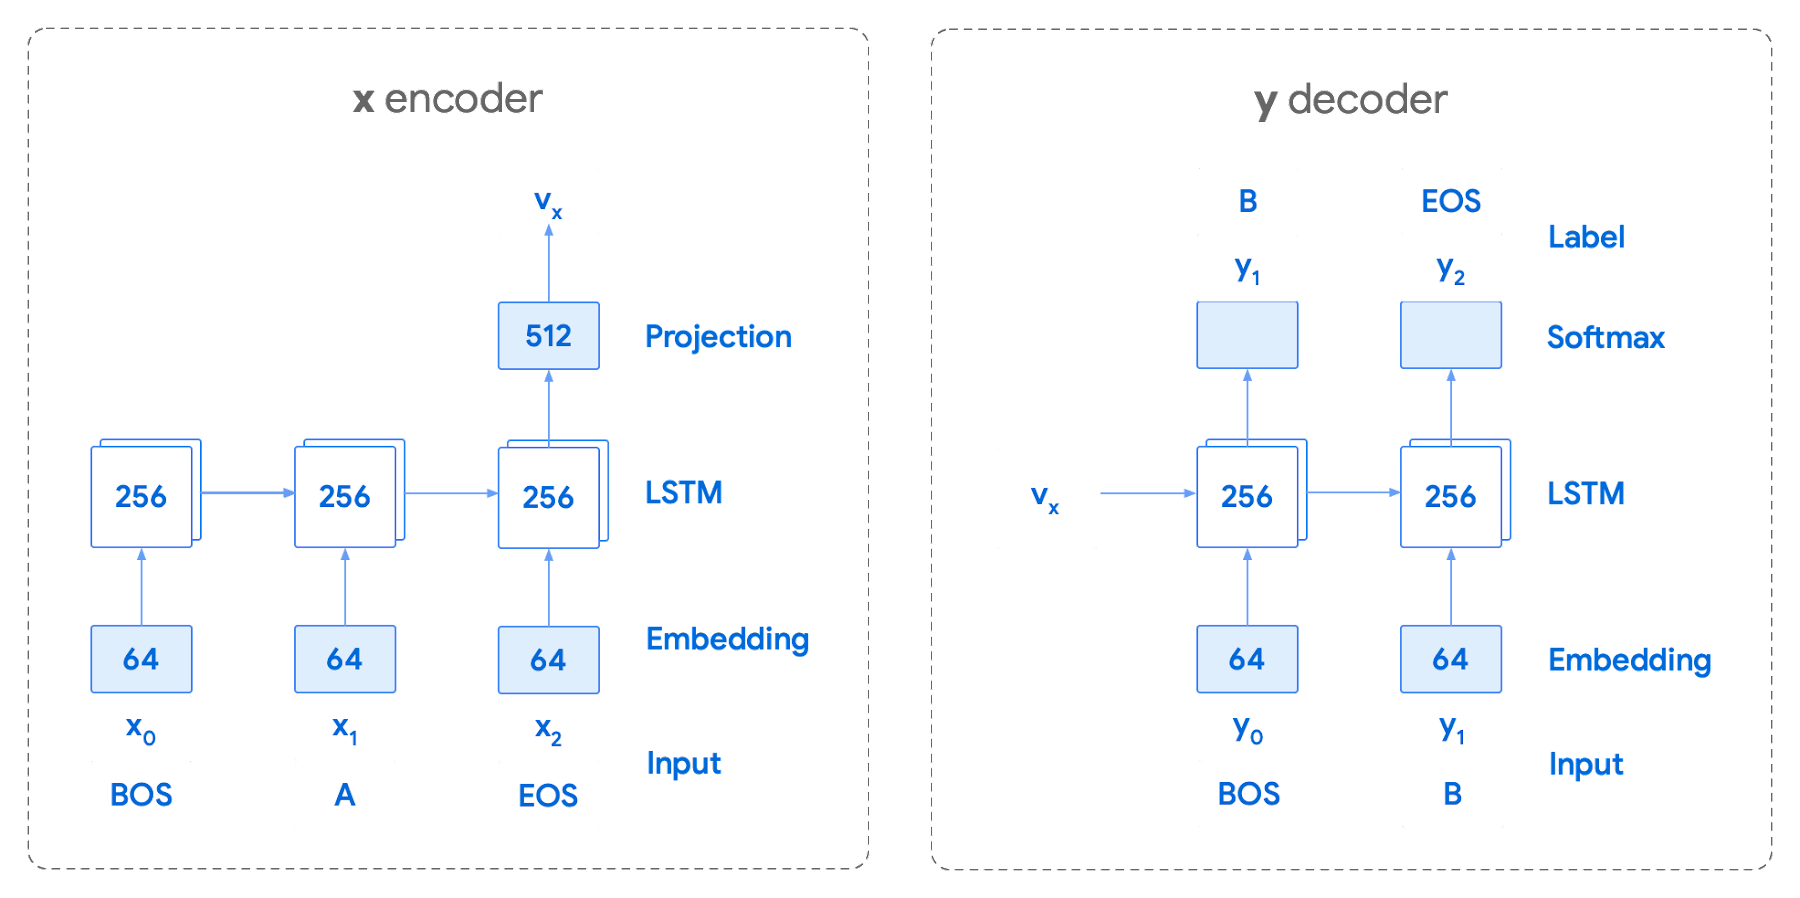
Training the neural network with tokenized values has gone through several iterations. The team used an Encoder-Decoder architecture that took a given vector along with a token and used a softmax function to predict the probability that the token was likely to be the next token in the sentence/conversation. Below, a diagram represents this method using LSTM-based recurrent networks. The power of this type of encoding comes from the ability of the encoder to effectively predict not just the next token, but the next series of tokens.
This has proven very useful for Smart Reply. In order to find the optimal sequence, an exponential search over each tree of possible future tokens is required. For this we opted to use beam search over a fixed-size list of best candidates, aiming to avoid increasing the overall memory use and run time for returning a list of suggestions. To do this we arranged tokens in a trie, and used a number of post processing techniques, as well as calculating a heuristic max score for a given candidate, to reduce the time it takes to iterate through the entire token list. While this improves the run time, the model tends to prefer shorter sequences.
In order to help reduce latency and improve control we decided to move to an Encoder-Encoder architecture. Instead of predicting a single next token and decoding a sequence of following predictions with multiple calls to the model, it instead encodes a candidate sequence with the neural network.
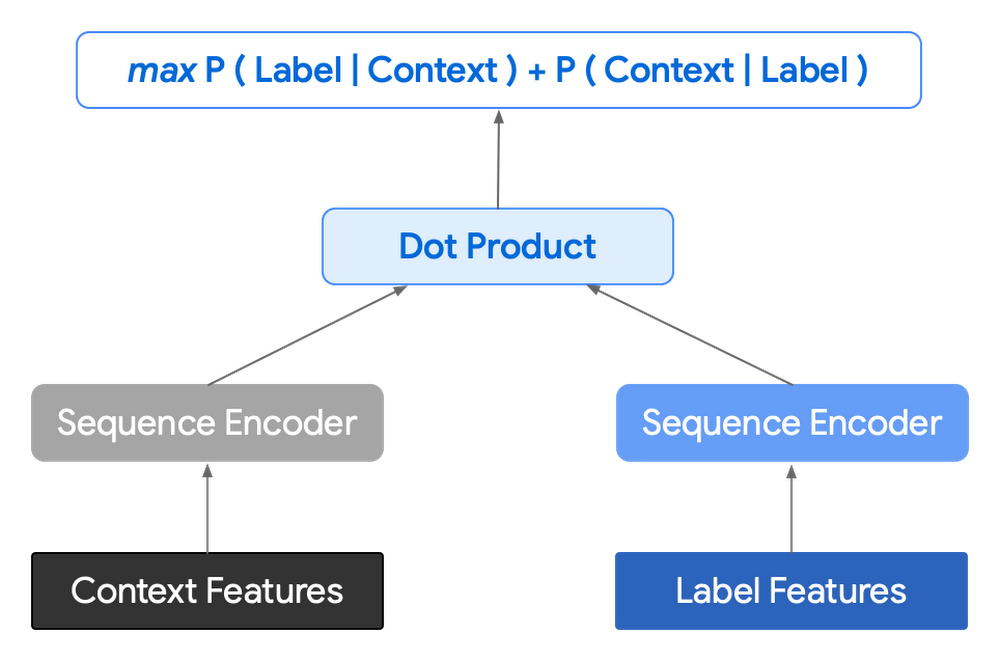
In practice, the two vectors – the context encoding and the encoding of a single candidate output – are combined with dot product to arrive at a score for the given candidate. The goal of this network is to maximize the score for true candidates – e.g. candidates that did appear in the training set – and minimize false candidates.
Choosing how to sample negatives affects the model training greatly. Below are some strategies that can be employed:
- Using positive labels from other training examples in the batch.
- Drawing randomly from a set of common messages. This assumes that the empirical probability of each message is sampled correctly.
- Using messages from context.
- Generating negatives from another model.
As this encoding generates a fixed list of candidates that can be precomputed and stored, each time a prediction is needed, only the context encoding needs to be computed, then multiplied by the matrix of candidate embeddings. This reduces both the time from the beam search method and the inherent bias towards shorter responses.
Dialogue Attributes
Conversations are more than simple text modeling. The overall flow of the conversation between participants provides important information, changing the attributes of each message. The context, such as who said what to whom and when, offers useful bits of input for the model when making a prediction. To that end the model uses the following attributes during its prediction:
- Local User ID’s – we set a finite number of participants for a given conversation to represent the turn taking between messages, assigning values to those participants. In most cases for support sessions there are 2 participants, requiring ID 0, and 1.
- Replies vs continuations – initially modeling focused only on replies. However, in practice conversations also include instances where participants are following up on the previously sent message. Given this, the model is trained for both same-user suggestions and “other” user suggestions.
- Timestamps – gaps in conversation can indicate a number of different things. From a support perspective, gaps may indicate that the user has disconnected. The model takes this information and focuses on the time elapsed between messages, providing different predictions based on the values.
Post processing
Suggestions can then be manipulated to get a more desirable final ranking. Such post-processing includes:
- Preferring longer suggestions by adding a token factor, generated by multiplying the number of tokens in the current candidate.
- Demoting suggestions with a high level of overlap with previously sent messages.
- Promoting more diverse suggestions based on embedding distance similarities.
To help us tune and focus on the best responses the team created a priority list. This gives us the opportunity to influence the model’s output, ensuring that responses that are incorrect can be de-prioritized. Abstractly it can be thought of as a filter that can be calibrated to best suit the client’s needs.
Getting suggestions to agents
With our model ready we now needed to get it in the hands of our techs. We wanted our solution to be as agnostic to our chat platform as possible, allowing us to be agile when facing tooling changes and speeding up our ability to deploy other efficiency features. To this end we wanted an API that we could query either via gRPC or via HTTPs. We designed a Google Cloud API, responsible for logging usage as well as acting as a bridge between our model and a Chrome Extension we would be using as a frontend.
The hidden step, measurement
Once we had our model, infrastructure, and extension in place we were left with the big question for any IT project. What was our impact? One of the great things about working in IT at Google is that it’s never dull. We have constant changes, be it planned or unplanned. However, this does complicate measuring the success of a deployment like this. Did we improve our service or was it just a quiet month?
In order to be satisfied with our results we conducted an A/B experiment, with some of our techs using our extension, and the others not. The groups were chosen at random with a distribution of techs across our global team, including a mix of techs with varying levels of experience ranging from 3 to 26 months.
Our primary goal was to measure tech support efficiency when using the tool. We looked at two key metrics as proxies for tech efficiency:
- The overall length of the chat.
- The number of messages sent by the tech.
Evaluating our experiment
To evaluate our data we used a two-sample permutation test. We had a null hypothesis that techs using the extension would not have a lower time-to-resolution, or be able to send more messages, than those without the extension. The alternative hypothesis was that techs using the extension would be able to resolve sessions quicker or send more messages in approximately the same time.
We took the mid mean of our data, using pandas to trim outliers greater than 3 standard deviations away. As the distribution of our chat lengths is not normal, with significant right skew caused by a long tail of longer issues, we opted to measure the difference in means, relying on central limit theorem (CLT) to provide us with our significance values. Any result with a p-value between 1.0 and 9.0 would be rejected.
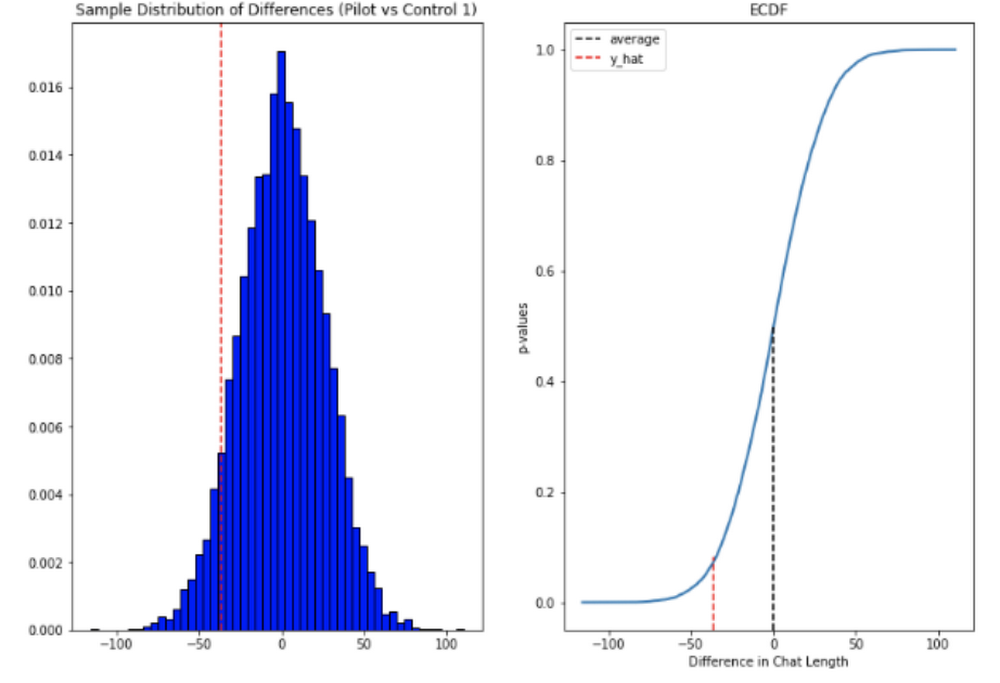
Across the entire pool we saw a decrease in chat lengths of 36 seconds.
In reference to the number of chat messages we saw techs on average being able to send 5-6 messages more in less time.
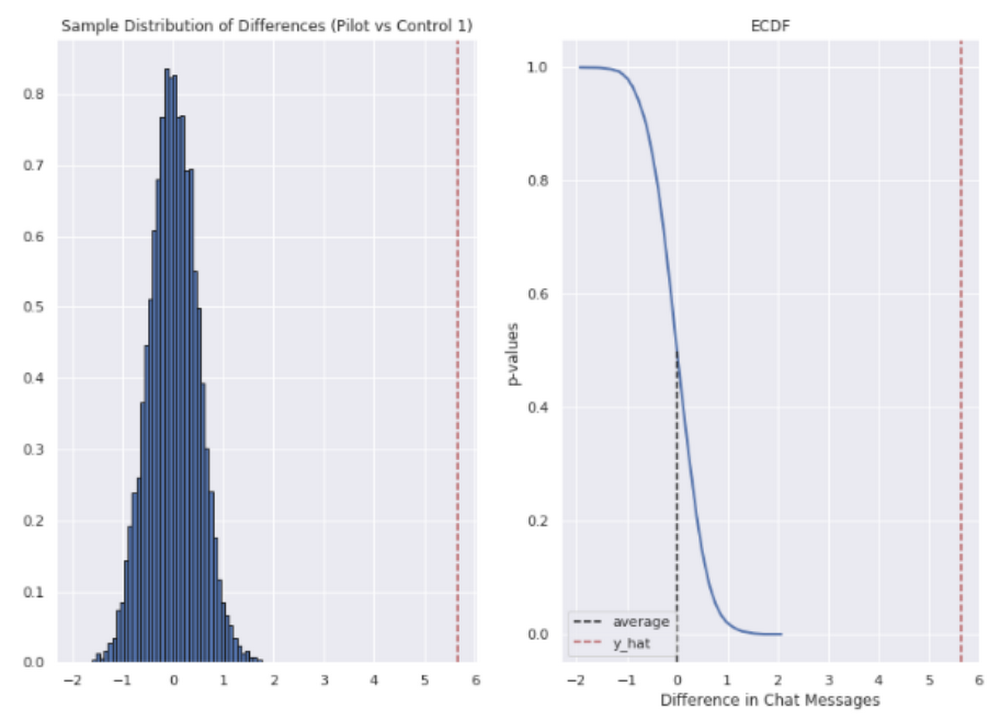
In short, we saw techs were able to send more messages in a shorter period of time. Our results also showed that these improvements increased with support agent tenure, and our more senior techs were able to save an average of ~4 minutes per support interaction.
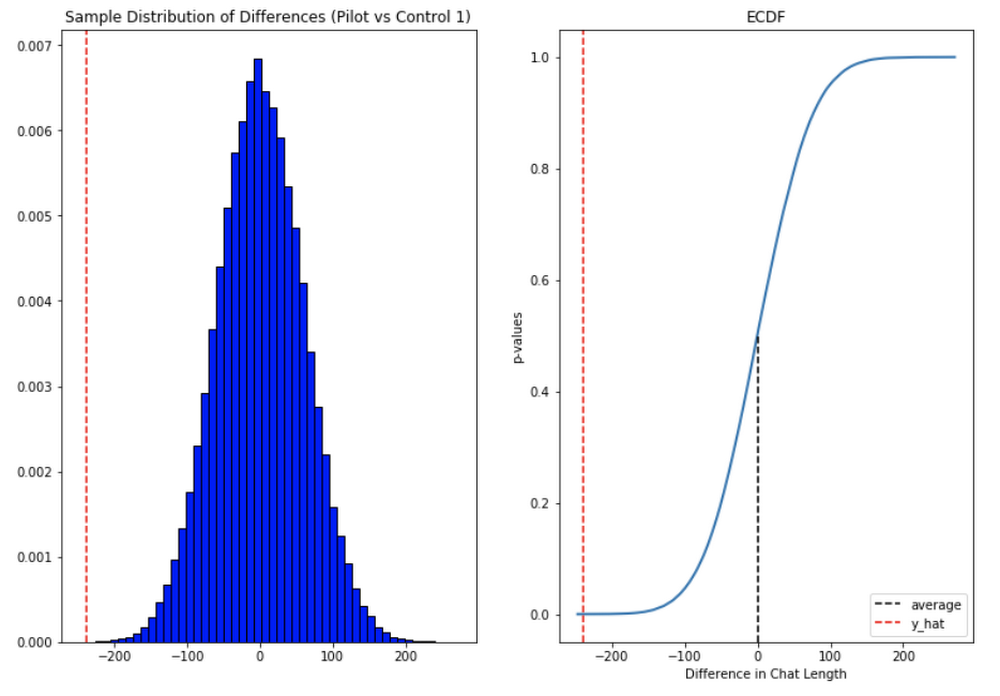
Overall we were pleased with the results. While things weren’t perfect, it looked like we were onto a good thing.
So what’s next for us?
Like any ML project, the better the data the better the result. We’ll be spending time looking into how to provide canonical suggestions to our support agents by clustering results coming from our allow list. We also want to investigate ways of making improvements to the support articles provided by the model, as anything that helps our techs, particularly the junior ones, with discoverability will be a huge win for us.
How can you do this?
A successful applied AI project always starts with data. Begin by gathering the information you have, segmenting it up, and then starting to process it. The interaction data you feed in will determine the quality of the suggestions you get, so make sure you select for the patterns you want to reinforce.
Our Contact Center AI allows tokenization, encoding and reporting, without you needing to design or train your own model, or create your own measurements. It handles all the training for you, once your data is formatted properly.
You’ll still need to determine how best to integrate its suggestions to your support system’s front-end. We also recommend doing statistical modeling to find out if the suggestions are making your support experience better.
As we gave our technicians ready-made replies to chat interactions, we saved time for our support team. We hope you’ll try using these methods to help your support team scale.
Held Back by Database Scalability, This Financial Services Company Switches to Google Cloud and Cloud Spanner

11577
Of your peers have already read this article.
4:30 Minutes
The most insightful time you'll spend today!
Azimut Group operates an international network of companies handling investment and asset management, mutual funds, hedge funds, and insurance. Founded in Milan, Italy in 1988, Azimut Group today has branches in fifteen countries, including Brazil, China, and the USA.
“We have subsidiaries and manage funds all over the world,” explains Simone Bertolotti, IT Manager at Azimut Holding S.p.a. “That means that any technology that we put in place has to cover needs from many different countries.”
“When complicated analysis has to be executed, we have to increase our table space in a couple of minutes so that the AI can drill down into the data and deliver the information we need.”
—Simone Bertolotti, IT Manager, Azimut Holding S.p.a.
Azimut manages its funds with investment advisors who use information sourced from Bloomberg, Reuters and others. “They use a huge amount of data,” says Simone. “They work with spreadsheets, algorithms, formulae and they analyse data in minutes.” In finance, every second is crucial, which is why Azimut decided to develop a risk management dashboard that can process information even more quickly, then distribute it worldwide.
“When an advisor manages data, that data is used to make immediate decisions on funds, capital movements or whether to sell stock,” says Simone. “They have to be ready to make recommendations for any amount of data that comes to them. For our dashboard, that means that when additional information arrives or complicated analysis has to be executed, we have to increase our table space in a couple of minutes so that the AI can drill down into the data and deliver the information we need.”
Generating insights at speed
Investors and investment managers make decisions based on the most accurate, up-to-date information possible. For Azimut Group, information sourced through financial data vendors such as Bloomberg and Reuters provided only part of the data that the group required.
“We looked to collect information from a range of different providers,” explains Simone, “then analyse it to develop a predictive algorithm that could work faster than an advisor stationed at the terminal. We set ourselves the challenge to try to manipulate that data to add new insights into our matrix, so that every one of our branches across the world can see risk information about the funds in real-time.”
“We compared Google Cloud Platform’s performance with our previous cloud provider, and saw huge benefits of switching to Google. For me, the key performance issue is scaling. With Google Cloud Platform I know that I can increase and decrease my infrastructure quickly, when I need it.
—Simone Bertolotti, IT Manager, Azimut Holding S.p.a.
The first cloud provider Azimut used to build its system struggled to scale quickly to meet different kinds of data challenges. “If we wanted to add more cores, that was fine,” says Simone. “But the previous cloud provider made it complicated to raise the amount of space in a database infrastructure and scale up to demand. Scaling up for more in-depth analysis would take a day, and our need was immediate.”
That’s why Azimut switched one year ago to Google Cloud Platform to run the 150 VMs on its risk analysis platform. “We compared Google Cloud Platform’s performance with our previous cloud provider, and saw huge benefits of switching to Google. For me, the key performance issue is scaling,” says Simone. “With Google Cloud Platform I know that I can increase and decrease my infrastructure quickly, when I need it. Instead of waiting a day to scale up infrastructure, we can request and add space to our database in a couple of minutes.”
The infrastructure of Azimut’s solution handles around 800TB of data per month, and Google’s global network of servers and high-speed connections ensure that it gets to where it’s most needed by the most direct route. Impressed by the speed, security and availability of Google Cloud Platform, Azimut has moved its intranet on to Google Cloud Platform, too, eliminating the need for staff to login with VPNs.
“Instead of waiting a day to scale up infrastructure, we can request and add space to our database in a couple of minutes.”
—Simone Bertolotti, IT Manager, Azimut Holding S.p.a.
Driving ahead with Noovle
For Azimut, migrating the risk management dashboard is the latest of many Google product collaborations with cloud consultancy Noovle. “Everything started five years ago,” says Simone, “when Noovle assisted us in migrating to Gmail from our on-premise email solution. From G Suite to Google Cloud Platform, we’ve had a great relationship. Noovle provides consultancy services, support for mobility, and external advisors who work on our premises, such as when they trained us how to broadcast our meetings on Google Hangouts. As an independent company, we know we can trust them for transparent advice. All they care about is the best way to get a job done and to help us reach our goals.”
New app, new customers
In a business case comparison, Google Cloud Platform cost Azimut 35% less to run than the previous cloud provider. Now the group is building a major new mobile application on Google App Engine to be released in 2018.
“The new mobile application will allow customers to trade directly, without human advisors, by proposing different investment solutions depending on targets the customers set,” says Simone. “So if a customer aims to make money with investments, they enter their relevant personal information and we carry out the necessary regulatory checks and suggest what they could buy. The entire project will be based on Google Cloud Platform, so customers can control their investments through the app while we manage the fund, using Google Cloud Spanner on the backend.”
2611
Of your peers have already downloaded this article
15:00 Minutes
The most insightful time you'll spend today!
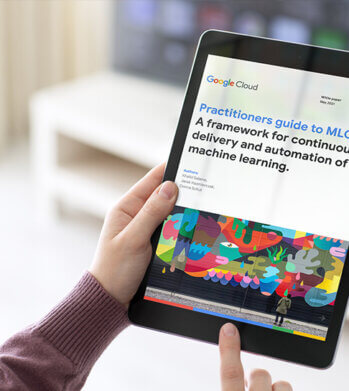
Across industries, DevOps and DataOps have been widely adopted as methodologies to improve quality and reduce the time to market of software engineering and data engineering initiatives.
With the rapid growth in machine learning (ML) systems, similar approaches need to be developed in the context of ML engineering, which handle the unique complexities of the practical applications of ML. This is the domain of MLOps.
MLOps is a set of standardized processes and technology capabilities for building, deploying, and operationalizing ML systems rapidly and reliably.
Inside, you will find an outline of an MLOps framework that defines core processes and technical capabilities. Organizations can use this framework to help establish mature MLOps practices for building and operationalizing ML systems.
Adopting the framework can help organizations improve collaboration between teams, improve the reliability and scalability of ML systems, and shorten development cycle times. These benefits in turn drive innovation and help gain overall business value from investments in ML.
BigQuery Explainable AI for Demystifying the Inner Workings of ML Models. Now GA!

6564
Of your peers have already read this article.
2:00 Minutes
The most insightful time you'll spend today!
Explainable AI (XAI) helps you understand and interpret how your machine learning models make decisions. We’re excited to announce that BigQuery Explainable AI is now generally available (GA). BigQuery is the data warehouse that supports explainable AI in a most comprehensive way w.r.t both XAI methodology and model types. It does this at BigQuery scale, enabling millions of explanations within seconds with a single SQL query.
Why is Explainable AI so important? To demystify the inner workings of machine learning models, Explainable AI is quickly becoming an essential and growing need for businesses as they continue to invest in AI and ML. With 76% of enterprises now prioritizing artificial intelligence (AI) and machine learning (ML) over other initiatives in 2021 IT budgets, the majority of CEOs (82%) believe that AI-based decisions must be explainable to be trusted according to a PwC survey.
While the focus of this blogpost is on BigQuery Explainable AI, Google Cloud provides a variety of tools and frameworks to help you interpret models outside of BigQuery, such as with Vertex Explainable AI, which includes AutoML Tables, AutoML Vision, and custom-trained models.
So how does Explainable AI in BigQuery work exactly? And how might you use it in practice?
Two types of Explainable AI: global and local explainability
When it comes to Explainable AI, the first thing to note is that there are two main types of explainability as they relate to the features used to train the ML model: global explainability and local explainability.
Imagine that you have a ML model that predicts housing price (as a dollar amount), based on three features: (1) number of bedrooms, (2) distance to the nearest city center, and (3) construction date.
Global explainability (a.k.a. global feature importance) describes the features’ overall influence on the model and helps you understand if a feature had a greater influence than other features over the model’s predictions. For example, global explainability can reveal that the number of bedrooms and distance to city center typically has a much stronger influence than the construction date on predicting housing prices. Global explainability is especially useful if you have hundreds or thousands of features and you want to determine which features are the most important contributors to your model. You may also consider using global explainability as a way to identify and prune less important features to improve the generalizability of their models.
Local explainability (a.k.a. feature attributions) describes the breakdown of how each feature contributes towards a specific prediction. For example, if the model predicts that house ID#1001 has a predicted price of $230,000, local explainability would describe a baseline amount (e.g. $50,000) and how each of the features contributes on top of the baseline towards the predicted price. For example, the model may say that on top of the baseline of $50,000, having 3 bedrooms contributed an additional $50,000, close proximity to the city center added $100,000, and construction date of 2010 added $30,000, for a total predicted price of $230,000. In essence, understanding the exact contribution of each feature used by the model to make each prediction is the main purpose of local explainability.
What ML models does BigQuery Explainable AI apply to?
BigQuery Explainable AI applies to a variety of models, including supervised learning models for IID data and time series models. The documentation for BigQuery Explainable AI provides an overview of the different ways of applying explainability per model. Note that each explainability method has its own way of calculation (e.g. Shapley values), which are covered more in-depth in the documentation.

Examples with BigQuery Explainable AI
In this next section, we will show three examples of how to use BigQuery Explainable AI in different ML applications:
Regression models with BigQuery Explainable AI
Let’s use a boosted tree regression model to predict how much a taxi cab driver will receive in tips for a taxi ride, based on features such as number of passengers, payment type, total payment and trip distance. Then let’s use BigQuery Explainable AI to help us understand how the model made the predictions in terms of global explainability (which features were most important?) and local explainability (how did the model arrive at each prediction?).
The taxi trips dataset comes from the BigQuery public datasets and is publicly available in the table: bigquery-public-data.new_york_taxi_trips.tlc_yellow_trips_2018.
First, you can train a boosted tree regression model.
CREATE OR REPLACE MODEL bqml_tutorial.taxi_tip_regression_modelOPTIONS (model_type='boosted_tree_regressor',input_label_cols=['tip_amount'],max_iterations = 50,tree_method = 'HIST',subsample = 0.85,enable_global_explain = TRUE) ASSELECTvendor_id,passenger_count,trip_distance,rate_code,payment_type,total_amount,tip_amountFROM`bigquery-public-data.new_york_taxi_trips.tlc_yellow_trips_2018`WHERE tip_amount >= 0LIMIT 1000000
Now let’s do a prediction using ML.PREDICT, which is the standard way in BigQuery ML to make predictions without explainability.
SELECT *FROMML.PREDICT(MODEL bqml_tutorial.taxi_tip_regression_model,(SELECT"0" AS vendor_id,1 AS passenger_count,CAST(5.85 AS NUMERIC) AS trip_distance,"0" AS rate_code,"0" AS payment_type,CAST(55.56 AS NUMERIC) AS total_amount))

But you might wonder—how did the model generate this prediction of ~11.077?
BigQuery Explainable AI can help us answer this question. Instead of using ML.PREDICT, you use ML.EXPLAIN_PREDICT with an additional optional parameter top_k_features. ML.EXPLAIN_PREDICT extends the capabilities of ML.PREDICT by outputting several additional columns that explain how each feature contributes to the predicted value. In fact, since ML.EXPLAIN_PREDICT includes all the output from ML.PREDICT anyway, you may want to consider using ML.EXPLAIN_PREDICT every time instead.
SELECT *FROMML.EXPLAIN_PREDICT(MODEL bqml_tutorial.taxi_tip_regression_model,(SELECT"0" AS vendor_id,1 AS passenger_count,CAST(5.85 AS NUMERIC) AS trip_distance,"0" AS rate_code,"0" AS payment_type,CAST(55.56 AS NUMERIC) AS total_amount),STRUCT(6 AS top_k_features))

The way to interpret these columns is:
Σfeature_attributions + baseline_prediction_value = prediction_value
Let’s break this down. The prediction_value is ~11.077, which is simply the predicted_tip_amount. The baseline_prediction_value is ~6.184, which is the tip amount for an average instance. top_feature_attributions indicates how much each of the features contributes towards the prediction value. For example, total_amount contributes ~2.540 to the predicted_tip_amount.
ML.EXPLAIN_PREDICT provides local feature explainability for regression models. For global feature importance, see the documentation for ML.GLOBAL_EXPLAIN.
Classification models with BigQuery Explainable AI
Let’s use a logistic regression model to show you an example of BigQuery Explainable AI with classification models. We can use the same public dataset as before: bigquery-public-data.new_york_taxi_trips.tlc_yellow_trips_2018.
Train a logistic regression model to predict the bracket of the percentage of the tip amount out of the taxi bill.
CREATE OR REPLACE MODEL bqml_tutorial.taxi_tip_classification_modelOPTIONS(model_type='logistic_reg',input_label_cols=['tip_bucket'],enable_global_explain=true) ASSELECTvendor_id,passenger_count,trip_distance,rate_code,payment_type,total_amount,CASEWHEN tip_amount > total_amount*0.20 THEN '20% or more'WHEN tip_amount > total_amount*0.15 THEN '15% to 20%'WHEN tip_amount > total_amount*0.10 THEN '10% to 15%'ELSE '10% or less'END AS tip_bucketFROM`bigquery-public-data.new_york_taxi_trips.tlc_yellow_trips_2018`WHERE tip_amount >= 0LIMIT 1000000
Next, you can run ML.EXPLAIN_PREDICT to get both the classification results and the additional information for local feature explainability. For global explainability, you can use ML.GLOBAL_EXPLAIN. Again, since ML.EXPLAIN_PREDICT includes all the output from ML.PREDICT anyway, you may want to consider using ML.EXPLAIN_PREDICT every time instead.
SELECT *FROMML.EXPLAIN_PREDICT(MODEL bqml_tutorial.taxi_tip_classification_model,(SELECT"0" AS vendor_id,1 AS passenger_count,CAST(5.85 AS NUMERIC) AS trip_distance,"0" AS rate_code,"0" AS payment_type,CAST(55.56 AS NUMERIC) AS total_amount),STRUCT(6 AS top_k_features))

Similar to the regression example earlier, the formula is used to derive the prediction_value:
Σfeature_attributions + baseline_prediction_value = prediction_value
As you can see in the screenshot above, the baseline_prediction_value is ~0.296. total_amount is the most important feature in making this specific prediction, contributing ~0.067 to the prediction_value, though followed by trip_distance. The feature passenger_count contributes negatively to prediction_value by -0.0015. The features vendor_id, rate_code, and payment_type did not seem to contribute much to the prediction_value.
You may wonder why the prediction_value of ~0.389 doesn’t equal the probability value of ~0.359. The reason is that unlike for regression models, for classification models, prediction_value is not a probability score. Instead, prediction_value is the logit value (i.e., log-odds) for the predicted class, which you could separately convert to probabilities by applying the softmax transformation to the logit values. For example, a three-class classification has a log-odds output of [2.446, -2.021, -2.190]. After applying the softmax transformation, the probability of these class predictions is [0.9905, 0.0056, 0.0038].
Time-series forecasting models with BigQuery Explainable AI

Explainable AI for forecasting provides more interpretability into how the forecasting model came to its predictions. Let’s go through an example of forecasting the number of bike trips in NYC using the new_york.citibike_trips public data in BigQuery.
You can train a time-series model ARIMA_PLUS:
CREATE OR REPLACE MODEL bqml_tutorial.nyc_citibike_arima_modelOPTIONS(model_type = 'ARIMA_PLUS',time_series_timestamp_col = 'date',time_series_data_col = 'num_trips',holiday_region = 'US') ASSELECTEXTRACT(DATE from starttime) AS date,COUNT(*) AS num_tripsFROM`bigquery-public-data.new_york.citibike_trips`GROUP BY dateNext, you can first try forecasting without explainability using ML.FORECAST:SELECT*FROMML.FORECAST(MODEL bqml_tutorial.nyc_citibike_arima_model,STRUCT(365 AS horizon, 0.9 AS confidence_level))
This function outputs the forecasted values and the prediction interval. Plotting it in addition to the input time series gives the following figure.

But how does the forecasting model arrive at its predictions? Explainability is especially important if the model ever generates unexpected results.
With ML.EXPLAIN_FORECAST, BigQuery Explainable AI provides extra transparency into the seasonality, trend, holiday effects, level (step) changes, and spikes and dips outlier removal. In fact, since ML.EXPLAIN_FORECAST includes all the output from ML.FORECAST anyway, you may want to consider using ML.EXPLAIN_FORECAST every time instead.
SELECT*FROMML.EXPLAIN_FORECAST(MODEL bqml_tutorial.nyc_citibike_arima_model,STRUCT(365 AS horizon, 0.9 AS confidence_level))

Compared to the previous figure which only shows the forecasting results, this figure shows much richer information to explain how the forecast is made.
First, it shows how the input time series is adjusted by removing the spikes and dips anomalies, and by compensating the level changes. That is:
time_series_adjusted_data = time_series_data - spikes_and_dips - step_changes
Second, it shows how the adjusted input time series is decomposed into different components such as both weekly and yearly seasonal components, holiday effect component and trend component. That is
time_series_adjusted_data = trend + seasonal_period_yearly + seasonal_period_weekly + holiday_effect + residual
Finally, it shows how these components are forecasted separately to compose the final forecasting results. That is:
time_series_data = trend + seasonal_period_yearly + seasonal_period_weekly + holiday_effect
For more information on these time series components, please see the documentation here.
Conclusion
With the GA of BigQuery Explainable AI, we hope you will now be able to interpret your machine learning models with ease.
Thanks to the BigQuery ML team, especially Lisa Yin, Jiashang Liu, Amir Hormati, Mingge Deng, Jerry Ye and Abhinav Khushraj. Also thanks to the Vertex Explainable AI team, especially David Pitman and Besim Avci.
Next-Level Search: Discover the Game-Changing Capabilities of Enterprise Search on Gen App Builder

1189
Of your peers have already read this article.
4:30 Minutes
The most insightful time you'll spend today!
In our conversations with customers, few generative AI use cases have driven as much enthusiasm as generative search. Leaders at enterprises know the limits of traditional enterprise search, with queries producing a list of links based on pattern matching, and significant manual investigation required to find the more relevant answers. In generative AI, these leaders see an opportunity to leverage their data more effectively and deeply, including applying it to conversational apps that can answer complex questions, produce accurate summaries that synthesize many sources, and help people get the information they need, faster.
Enterprise Search on Generative AI App Builder (Gen App Builder) lets organizations create custom chatbots and semantic search applications in as little as a few minutes, with minimal coding needed to get started and enterprise-grade management and security built in. Customers can combine their internal data with the power of Google’s search technologies and generative foundation models, delivering relevant, personalized search experiences for enterprise applications or consumer-facing websites.
To date, most approaches to combining generative AI and search technology have been inadequate for the scale and reliability needed for enterprise use. For example, building search by breaking long documents into chunks and feeding each segment into an AI assistant typically isn’t scalable and doesn’t effectively provide insights across multiple sources. Likewise, many solutions are limited in the data types they can handle, prone to errors, and susceptible to data leakage. Bespoke, do-it-yourself approaches are generally no easier, with production-grade solutions often requiring complex tasks like integrating embeddings data with foundation models and significant use case data testing. Even when organizations make these efforts, the resulting solutions still tend to lack feature completeness and reliability, with significant investments of time and resources required to achieve high-quality results.
These challenges demonstrate that to effectively implement generative search, organizations typically need more than access to powerful foundation models. They also likely need the ability to ground model outputs in specific data, so that outputs are more relevant and less likely to include mistakes or “hallucinations.” They generally need safeguards that protect their data, how it is accessed, and how it is used. And they generally need the process to be high-performant and scalable out of the box, making the functionality easy to use even if the organization lacks data science and machine learning expertise.
Let’s look at how Enterprise Search on Gen App Builder helps customers bypass these scale and reliability challenges, so they can start leveraging generative search quickly.
The intersection of generative AI and enterprise data
Enterprise Search on Gen App Builder lets developers create search engines that help ground outputs in specific data sources for accuracy and relevance, can handle multimodal data such as images, and include controls over how answer summaries are generated. Multi-turn conversations are supported so that users can ask follow up questions as they peruse outputs, and customers have control over their data—including the ability to support HIPAA compliance for healthcare use cases. All of this is available as a fully managed service, so developers can focus on building rather than cloud complexity.
Gen App Builder’s out-of-box capabilities can remove the need for data chunking, generating embeddings, or managing indexes, hiding complexity behind a straightforward interface that lets developers build apps in minutes with little or no coding and no prior machine learning experience. With the ability to ingest large volumes of documents and support for both unstructured and structured data, apps built with Gen App Builder help customers solve the long-standing headache of finding relevant information across the organization, turning tasks that used to take hours into quick searches or conversational explorations with an app.
These capabilities are underpinned by both Google’s foundation models and a variety of Google Search technologies, including:
- Semantic search, which helps deliver more relevant results than traditional keyword-based search techniques by using natural language processing and machine learning techniques to infer relationships within the content and intent from the user’s query input.
- Google’s understanding of how users search for information.
- Google’s expertise in understanding relevance, which considers factors such as content popularity and user personalization of content when determining the order in which search results are displayed.
For more advanced use cases, Gen App Builder can be easily integrated with Vertex AI for in-depth foundation model tuning, enabling flexible input and output search formats.
As always with our AI products, Gen App Builder has been evaluated for alignment with our AI Principles, which is reflected by the product’s many safeguards against bias, toxic content, and unhelpful outputs. Whether for prototypes built in minutes or apps with many custom components, Enterprise Search on Gen App Builder offers a robust suite of user-friendly tools for customers across industries and levels of expertise.
How customers are innovating with Enterprise Search
After gaining access to Enterprise Search on Gen App Builder via our trusted tester program, a number of customers are already leveraging the product for novel use cases.
Priceline is harnessing Gen App Builder and Vertex AI for a range of projects, including internal search engines for employees and a new chatbot to assist customers as they make travel plans. Slated to be available across both desktop and mobile experiences, Priceline’s chatbot will help customers find the right information faster via always-on, personalized experiences, including answering nuanced questions like, “What are the best 4-star hotel options in midtown Manhattan within walking distance to Central Park?” and “Can you help me extend my hotel reservation for an additional night?”
“Priceline is charting a course to transform the novelty of generative AI into lasting value for our customers and our business. We believe it’s not just about having the latest technology; it’s also about practically targeting innovation to the right challenges and opportunities,” said Marty Brodbeck, Chief Technology Officer, Priceline. “With Google Cloud as our AI innovation partner, we’re doubling down on our commitment to delivering the fastest, most seamless and informative booking experience for our customers, from personalized planning and travel inspiration to customer service.”
Vodafone is experimenting with Enterprise Search and foundation models on Gen App Builder to build a tool that can rapidly and securely query documents, search, and understand specific commercial terms and conditions. Vodafone Voice and Roaming Services has over 10,000 contracts with other telecommunications companies worldwide, in a variety of formats such as PDFs, images, and complex tables. Searching this document repository is often a time consuming process for employees.
“Every day we introduce and manage new services like 5G to a roaming footprint comprising more than 700 operators in 210 countries to ensure both Vodafone and our partners’ business customers, holidaymakers, and Internet of Things devices stay connected when abroad. With Enterprise Search on Gen App Builder, we are building an intelligent assistant to securely and quickly search contracts.” said Sherif Bakir, CEO of Vodafone Voice and Roaming Services. “With generative AI, we’re accelerating otherwise protracted processes, increasing productivity and operational efficiency.”
Software startup Trender.ai, which creates customer monitoring and intelligence solutions for B2B relationships, is using Gen App Builder to build a product that can synthesize information from social media, public sources, and CRM data so that users can form more productive, personal relationships with prospects and customers.
“With Enterprise Search on Gen App Builder, we have been able to do things in the last month that we had projected to take 12-18 months on our prior roadmap,” said Betsy Bilhorn, co-founder at Trender.ai. “We had expected it would take at least 12 months to build and train models from an individual’s public social, web, and other data, and to then be able to ask questions like ‘What things are most important to this person?’ or ‘When and how is the best way to make an introduction to this prospect that they’ll respond to?’ Last year, we thought getting to this vision was a bit of a moonshot for a startup our size — but now we were able to achieve this in under a month.”
Stop searching for solutions — start discovering insights
We’re excited to see how customers use Enterprise Search on Gen App Builder to leverage data in powerful ways, discover new insights, and create useful, personal, and efficient experiences.
Today, we’re pleased to help our customers accomplish these goals, with the general availability of Enterprise Search on Gen App Builder for customers on the allowlist (i.e., approved for access). Please contact your Google Cloud sales team for access and pricing details. We are also launching two new features within Enterprise Search on Gen App Builder that are available today in our preview offering: multi-turn search, which supports asking follow-up questions, and content recommendations to find semantically relevant content. Access to the preview offering is available via Google Cloud’s trusted tester program. Read more about Enterprise Search on Gen App Builder and sign up for access on our webpage.
We’re also bringing generative AI features of Enterprise Search to our existing solutions like Contact Center AI and Document AI. As an example, starting this month, customers can preview generative AI-powered search in Document AI Warehouse. To keep up with our latest generative AI news, don’t miss The Prompt or our generative AI primer for executives on Transform with Google Cloud.
More Relevant Stories for Your Company




How L&T Financial Services Processes 95% of Motorcycle Loans in Less Than Two Minutes
L&T Financial Services is one of the largest lenders in India. India’s demonetization policy in recent years has led to a shift from cash transactions to digital payments. In 2016, the government withdrew 500 and 1000 rupee notes from circulation and encouraged a heavily cash-based population to deposit their canceled notes

How AI-powered ML Models Helps Run Unemployment Claims Verification at Scale
With unemployment application submissions reaching record numbers over the past year, state and local agencies in the United States have faced the challenge of processing unprecedented numbers of claims per week. The digital infrastructure most agencies have in place is unable to handle this volume, resulting in constituents waiting longer,

Make Your Data Useful with Google Cloud Products and Services
While you likely know that data science is the practice of making data useful, you may not have a clear landscape around the tools that can aid each stage of the data science workflow as you use machine learning to tackle your challenges. Click to enlarge Read on to discover

Google Cloud and Univision Partnership to Up the Ante in UX for Spanish-speaking Audience
The past year has given everyone lots to think about—about our priorities as people and as businesses. As the world retreated behind closed doors, we saw how shared interests and experiences can bring us together. As the world grappled with a common enemy, we witnessed just how differently individuals, communities
