





Analytics Hub for Secure Data Sharing and Analytics Unlocks True Data Value and Insights

6737
Of your peers have already read this article.
2:30 Minutes
The most insightful time you'll spend today!
Customers tell us that sharing and exchanging data with other organizations is a critical element of their analytics strategy, but it’s hamstrung by unreliable data and processes, and only getting harder with security threats and privacy regulations on the rise.
Furthermore, traditional data sharing techniques use batch data pipelines that are expensive to run, create late arriving data, and can break with any changes to the source data. They also create multiple copies of data, which brings unnecessary costs and can bypass data governance processes. These techniques do not offer features for data monetization, such as managing subscriptions and entitlements. Altogether, these challenges mean that organizations are unable to realize the full potential of transforming their business with shared data.
To address these limitations, we are introducing Analytics Hub, a new fully managed service, available in Q3, in preview, that helps you unlock the value of data sharing, leading to new insights and increased business value. With Analytics Hub you get:
- A rich data ecosystem by publishing and subscribing to analytics-ready datasets.
- Control and monitoring over how your data is being used, because data is shared in one place.
- A self-service way to access valuable and trusted data assets, including data provided by Google. For example, a unique dataset from Google Search Trends will be available, that you can query and combine with your own data.
- An easy way to monetize your data assets without the overhead of building and managing the infrastructure.
Built on a decade of cross-organizational sharing
While Analytics Hub is a new service, it builds on BigQuery, Google’s petabyte-scale, serverless cloud data warehouse. BigQuery’s unique architecture provides separation between compute and storage, enabling data publishers to share data with as many subscribers as you want without having to make multiple copies of your data. With BigQuery, there are no servers to deploy or manage, which means that data consumers get immediate value from shared data. Data can be provided and consumed in real-time using the streaming capabilities of BigQuery and you can leverage the built in machine learning, geospatial, and natural language capabilities of BigQuery or take advantage of the native business intelligence support with tools like Looker, Google Sheets, and Data Studio.
BigQuery has had cross-organizational, in-place data sharing capabilities since it was introduced in 2010. We took a look at usage metrics in BigQuery and found that over a 7 day period in April, we had over 3,000 different organizations sharing over 200 petabytes of data. These numbers don’t include data sharing between departments within the same organization.
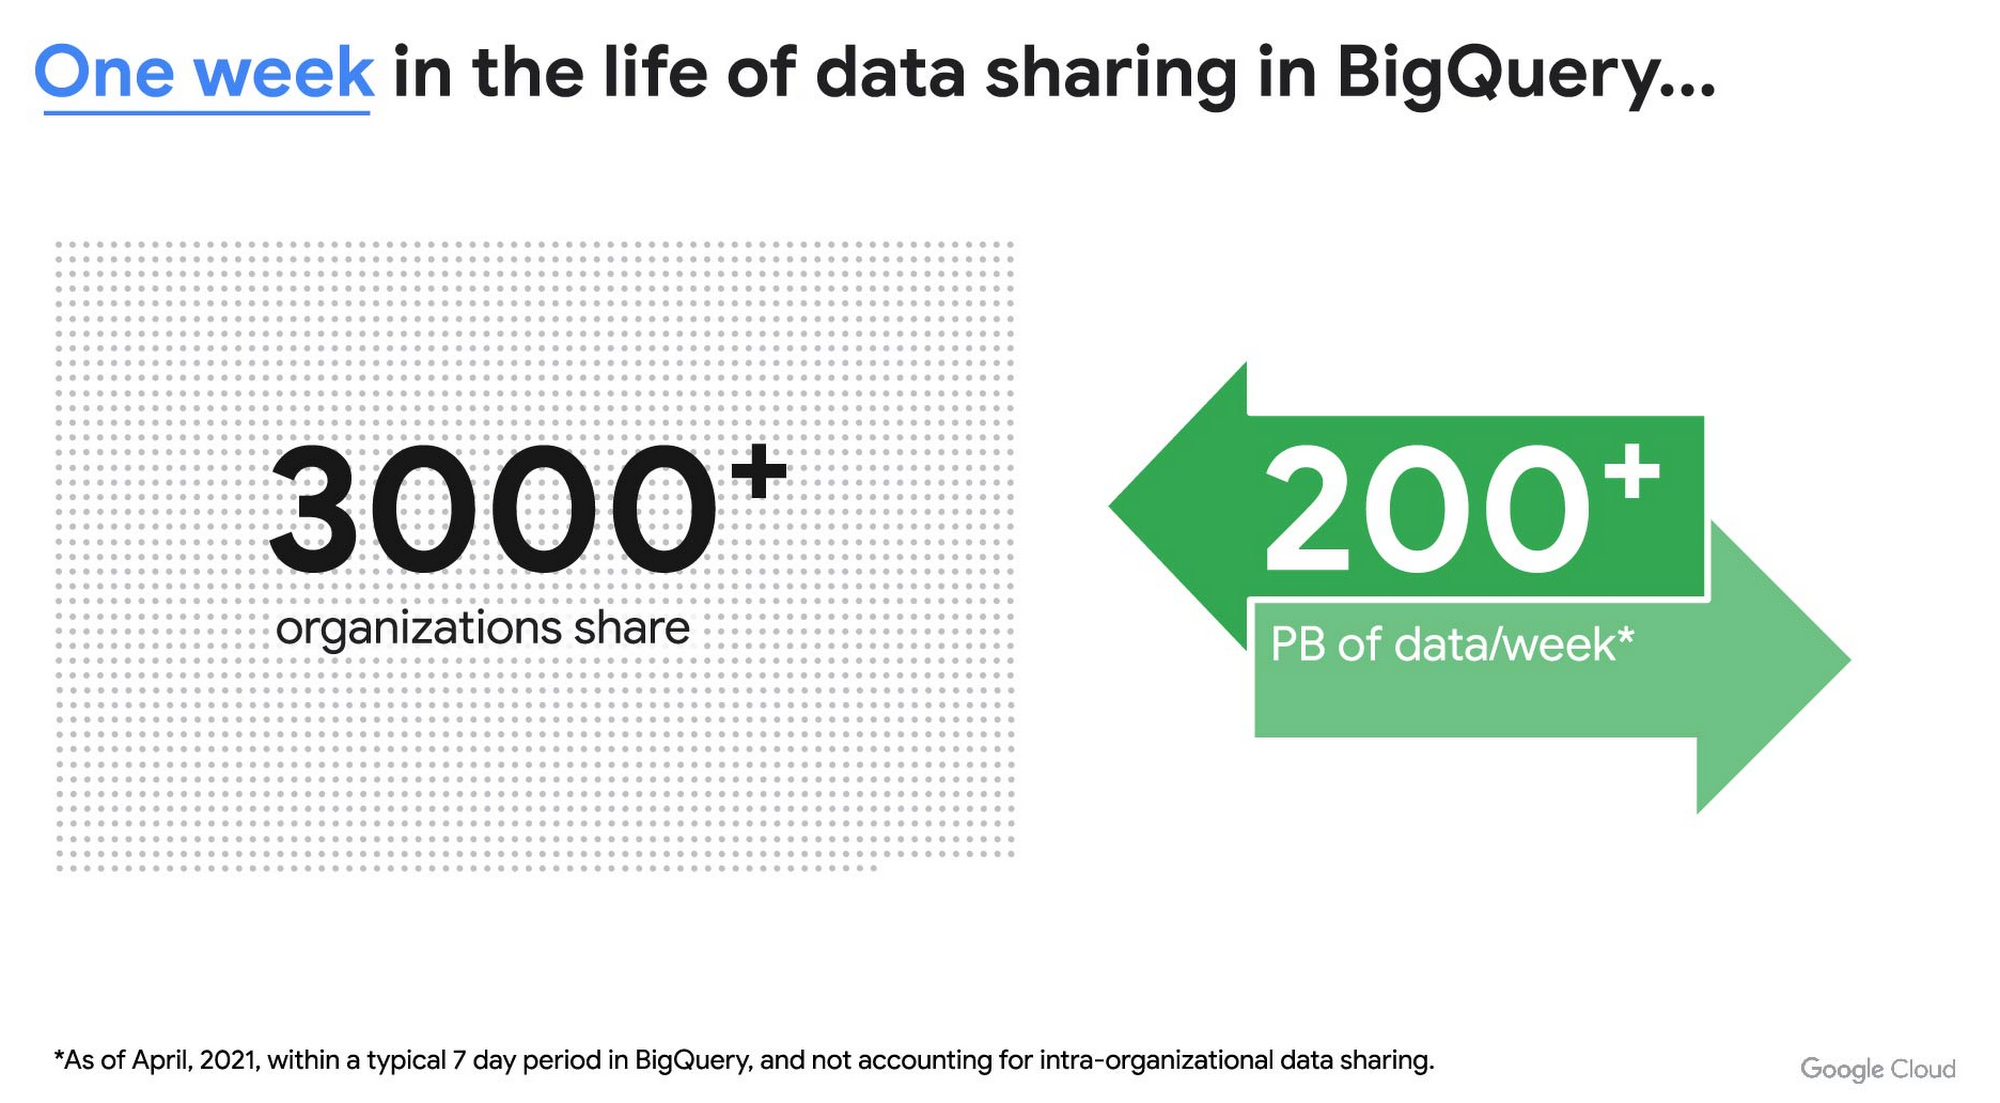
As you can see, data sharing in BigQuery is already popular. But we want to make it easier and even more scalable.
Raising the bar on data sharing
To make data sharing easier and more scalable in BigQuery, Analytics Hub introduces the concepts of shared datasets and exchanges. As a data publisher, you create shared datasets that contain the views of data that you want to deliver to your subscribers. Next, you create exchanges, which are used to organize and secure shared datasets. By default, exchanges are completely private, which means that only the users and groups that you give access to can view or subscribe to the data. You can also create internal exchanges or leverage public exchanges provided by Google. Finally, you publish shared datasets into an exchange to make them available to subscribers.
Data subscribers search through the datasets that are available across all exchanges for which they have access and subscribe to relevant datasets. This creates a linked dataset in their project that they can query and join with their own data. Subscribers pay for the queries that they run against the data while the publisher pays for the storage of the data. Data providers can add new data, new tables, or new columns to the shared dataset and these will be immediately available to subscribers. In addition, the publisher can track subscribers, disable subscriptions, and see aggregated usage information for the shared data.
Analytics Hub makes it easy for you to publish, discover, and subscribe to valuable datasets that you can combine with your own data to derive unique insights. Here are some types of data that will be available through Analytics Hub:
- Public datasets: Easy access to the existing repository of over 200 public datasets, including data about weather and climate, cryptocurrency, healthcare and life sciences, and transportation.
- Google datasets: Unique, freely-available datasets from Google. One example of this is the COVID-19 community mobility dataset. Another example is the forthcoming Google Trends dataset, which will provide the top 25 search terms and top 25 rising search terms over a 5 year window in 210 distinct locations in the US. Trends data can be used by everyone in the organization to gain insights into what customers care about.
- Commercial (paid for) datasets: We are working with leading commercial data providers to bring their data products to Analytics Hub. If you are interested in delivering your data via Analytics Hub, we’re also introducing Data Gravity, an initiative that provides storage benefits and new distribution paths for data published through Analytics Hub.
- Internal datasets: We know that data sharing can be challenging in larger organizations. Analytics Hub can be used for internal data, for example, to share standardized customer demographics with your sales engineering and data science teams.
Customers and partners using Analytics Hub

“Google Search Trends data has always been an important tool for our WPP agency data teams. At WPP we believe that data variety is a superpower which is why we are excited to use the new Trends dataset availability within BigQuery, plus the launch of Analytics Hub. The best creativity in the world is informed by data insights, and influenced by what people search for, so the operational efficiencies we’ll gain via the Analytics Hub and the insights we can drive with Trends data are just phenomenal.”
—Di Mayze Global Head of Data and AI, WPP

“Equifax Ignite is our shared data analytics environment within our Equifax data fabric. We are excited to partner with Google to leverage Analytics Hub and BigQuery to deliver data to over 400 statisticians and data modelers as well as securely sharing data with our partner financial institutions.”
—Kumar Menon, SVP Data Fabric and Decision Science, Equifax

“The flow of data and insights between our teams at Deloitte and our clients is paramount for building truly transformational data cultures. With its purpose-built architecture for secure data exchanges and sharing analytics resources, Google Cloud’s Analytics Hub can help provide significant operational efficiencies for how Deloitte teams support our clients’ data-driven initiatives within their industry ecosystems. It will also help minimize the worries about scale, privacy and security, or the administrative burden associated with each.”
—Navin Warerkar, Managing Director, Deloitte Consulting LLP, and US Google Cloud Data & Analytics GTM Lead

“Crux Informatics is proud to partner with Google to support the launch of Analytics Hub, removing friction for those who need access to analytics-ready data. With thousands of datasets from over 140 sources, Crux Informatics will accelerate access to data on Analytics Hub and together provide a more efficient and cost effective solution to deliver datasets in Google Cloud’s ecosystem.”
—Will Freiberg, CEO, Crux Informatics
Next steps for Analytics Hub
This is just the beginning for Analytics Hub. As we get to preview and general availability, we will be adding additional capabilities, including workflows for publishing and subscribing, publishing analytics assets (Looker Blocks, Data Studio reports, Connected Google Sheets) along with the shared data, the ability for data publishers to specify query restrictions on the usage of their data, and making it easy for data publishers to create sandbox environments for subscribers to work with their data, even if they are not yet on Google Cloud. We will provide features in Analytics Hub for monetization of data, including managing subscriptions, data entitlements, and billing.
Please sign up for the preview, which is scheduled to be available in the third quarter of 2021. In the meantime, you can learn more about BigQuery and how to leverage its built-in data sharing capabilities. Please go to g.co/cloud/analytics-hub to register your interest in Analytics Hub.
Wayfair Writes its Success Story with BigQuery for Internal Analytics

4932
Of your peers have already read this article.
4:00 Minutes
The most insightful time you'll spend today!
Editor’s note: Home-goods and furniture giant Wayfair first partnered up with Google Cloud to transform and scale its storefront—work that proved its value many times over during the unprecedented surge in ecommerce traffic during 2020. Today, we hear how BigQuery’s performance and cost optimization have transformed the company’s internal analytics to create an environment of “yes”.
At Wayfair, we have several unique challenges relating to the scale of our product catalog, our global delivery network, and our position in a multi-sided marketplace that supports both our customers and suppliers. To give you a sense of our scale we have a team of more than 3,000 engineers with tens of millions of customers. We supply more than 20 Million items using more than 16,000 supplier partners.
Serving those constituents generates a lot of analytics work. Wayfair runs over a billion ‘analytic’ database queries a year, from both humans and systems, against multi-petabyte datasets. Scaling our previous environment to meet these challenges required us to maintain dozens of copies of data for different use cases and manage complex data synchronization routines to move trillions of records each day, resulting in long development times and high support costs for our analytics projects.
Centralizing our data using Cloud Storage and BigQuery enabled us to break down existing silos and build unified pipelines for our batch and real-time operations. BigQuery shines by letting us decouple our compute and storage resources and flexibly ingest structured data in streaming and batch modes. We also benefit from the same decoupling for more complicated machine learning (ML) workflows in Dataproc and Cloud Storage. In particular, BigQuery is extremely low maintenance. From ML and easy data integrations to the integrated query cache, many out-of-the-box features have proven valuable for multiple use cases.
Beyond storage and compute, Google Cloud offers multiple tools to maximize the value of our data. For example, we can easily connect Data Studio to BigQuery for lightning-fast dashboarding of enterprise KPI reporting. When we need to dive deeper into a metric, Looker provides an interface and semantic model that empowers more business users to answer important questions — without understanding SQL or our vast dataset and table structure.
The combination of all of Google Cloud’s tools enables every Wayfairian the opportunity to self-serve their data visualization and analysis needs. We are able to support all of the requirements of our internal and external users, from descriptive analytics to alerting and ML, in a platform that blends Google’s proprietary technology with open-source standards.we have seen a greater than 90% reduction in the number of analytic queries in production that take more than one minute to run
As a result, we have seen a greater than 90% reduction in the number of analytic queries in production that take more than one minute to run, which delights our users and increases adoption of our analytics tools across the business.
Higher performance means saying “Yes” more often
We went into the BigQuery experience expecting very strong performance on large, aggregate queries and excellent scalability — the kind of performance that could enable consistent 5-15 minute processing queries and 5-10 second response times for large analytics queries.
We weren’t disappointed — we saw slightly better than linear performance profiles as record counts went up from millions to trillions for a flat resource allocation. BigQuery had the expected high performance for aggregate queries. This made our large data processing pipelines predictable and straightforward to maintain and optimize.
Below is a plot of gigabytes processed by a query against query run time in seconds; outliers are filtered and the axes are pruned to ranges where we had a large sample size. This focuses on longer-duration queries. As an example of the linear performance, a 2 terabyte query averages 5 minutes — 2.5min/terabyte — and an 18 terabyte query (9 times as much data) averages 25s — only 1.4min/terabyte. This is despite the fact that complex queries [sorting and analytic functions are particularly problematic] are more common with large data sizes. We do see increasing variability at large sizes as slot limits and other resource constraints come into play, but these factors are controllable and ultimately a business optimization decision.
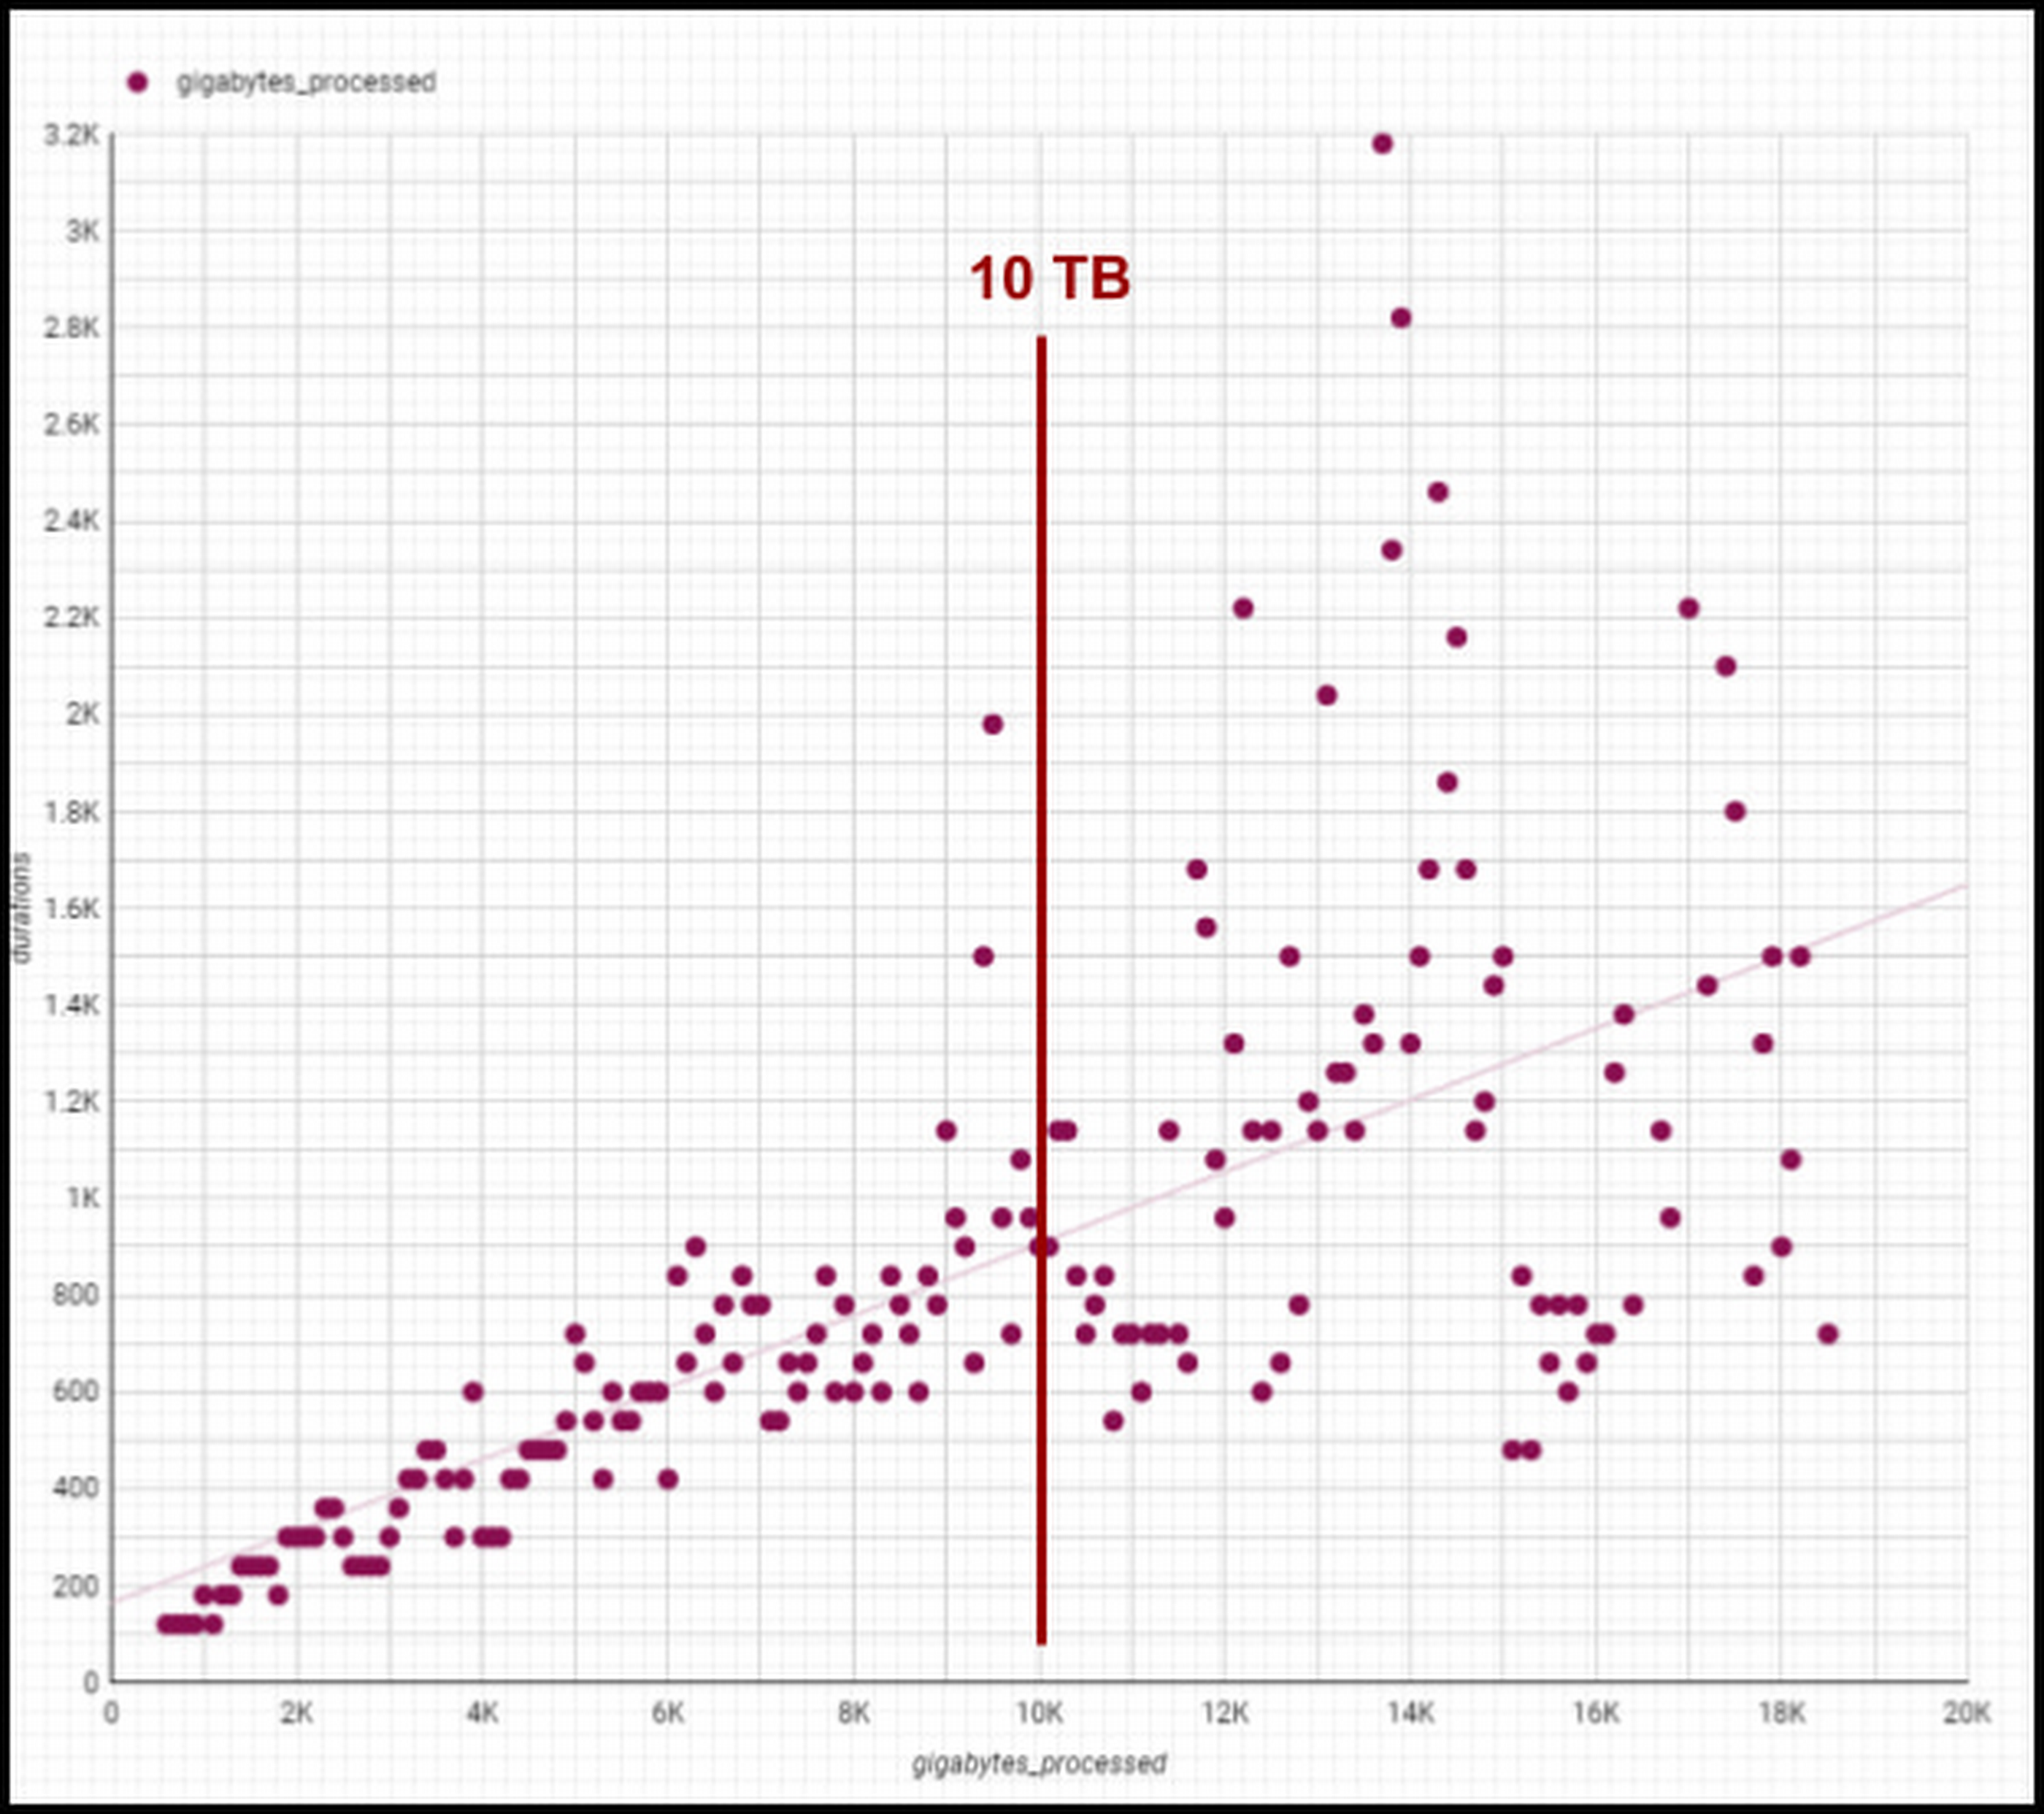
Though individual values vary greatly depending on query complexity [analytic functions/sorting can be computationally expensive], the overall trend line is below 1-1 for bytes versus duration, meaning our BigQuery query runtimes are increasing slower than our data volumes. We are still seeing sub 1:1 threshold runtimes, and we’re already at 100 PB of total data with single queries running on 50PB or more. Going strong!
One unexpected and pleasant surprise has been high performance for smaller queries, such as those required for development, interactive analytics, and internal applications we use for forecasting, segmentation, and other latency-sensitive data workflows. BigQuery’s resource management systems have provided smoother degradation and parallelism profiles than we initially expected for a multi-tenant platform.
We regularly see sub-second p50 query performance for interactive use cases, with p90 performance coming in under 10 seconds for Looker, Data Studio, and AtScale — meeting the threshold we set to avoid analysts losing focus during a business investigation. The chart below shows p50, p90, and p95 timing for core workloads, as well as the number of queries in each bucket and the number of unique users. [Looker and Atscale will use small numbers of service accounts for a large number of users].

This has enabled two important shifts in the way our customers experience analytics services:
- Delivering better user productivity. People no longer have long wait times to get results for a basic query delivering an improved overall user experience.
- Scaling our data transformation. BigQuery has proven, effective data transformation that allows us to embrace the industry shift away towards ELT (extract, load, transform) to transform raw data right within the database.
We no longer have to ask ourselves, “Can we meet the SLA for this data processing task?” The new conversation is, “Of course, we can meet it. What’s the associated cost based on how many resources we assign?” We can make cost and resource trade-offs clear to our users and say “yes” more often to requirements that have measurable business value.
Supporting cost vs. performance decisions
Democratized access to internal analytics is a powerful decision-making tool. With BigQuery’s robust tooling, the decision about how to best allocate computational resources is in the hands of the analytics groups closest to the business decision being made. If they want to spend a sprint optimizing a dashboard, they can show exactly how much money it will save. If they choose not to optimize a report, they can offset the decision with concrete cost savings and other realized value.
Wayfair teams also benefit from visibility into their committed costs by abstracting away the details of the underlying services, including BigQuery slots, the virtual CPUs used to execute SQL queries.
Take a look at this example view consumed by our teams (the metrics for these dashboards are from the BigQuery INFORMATION_SCHEMA (jobs and reservations tables):
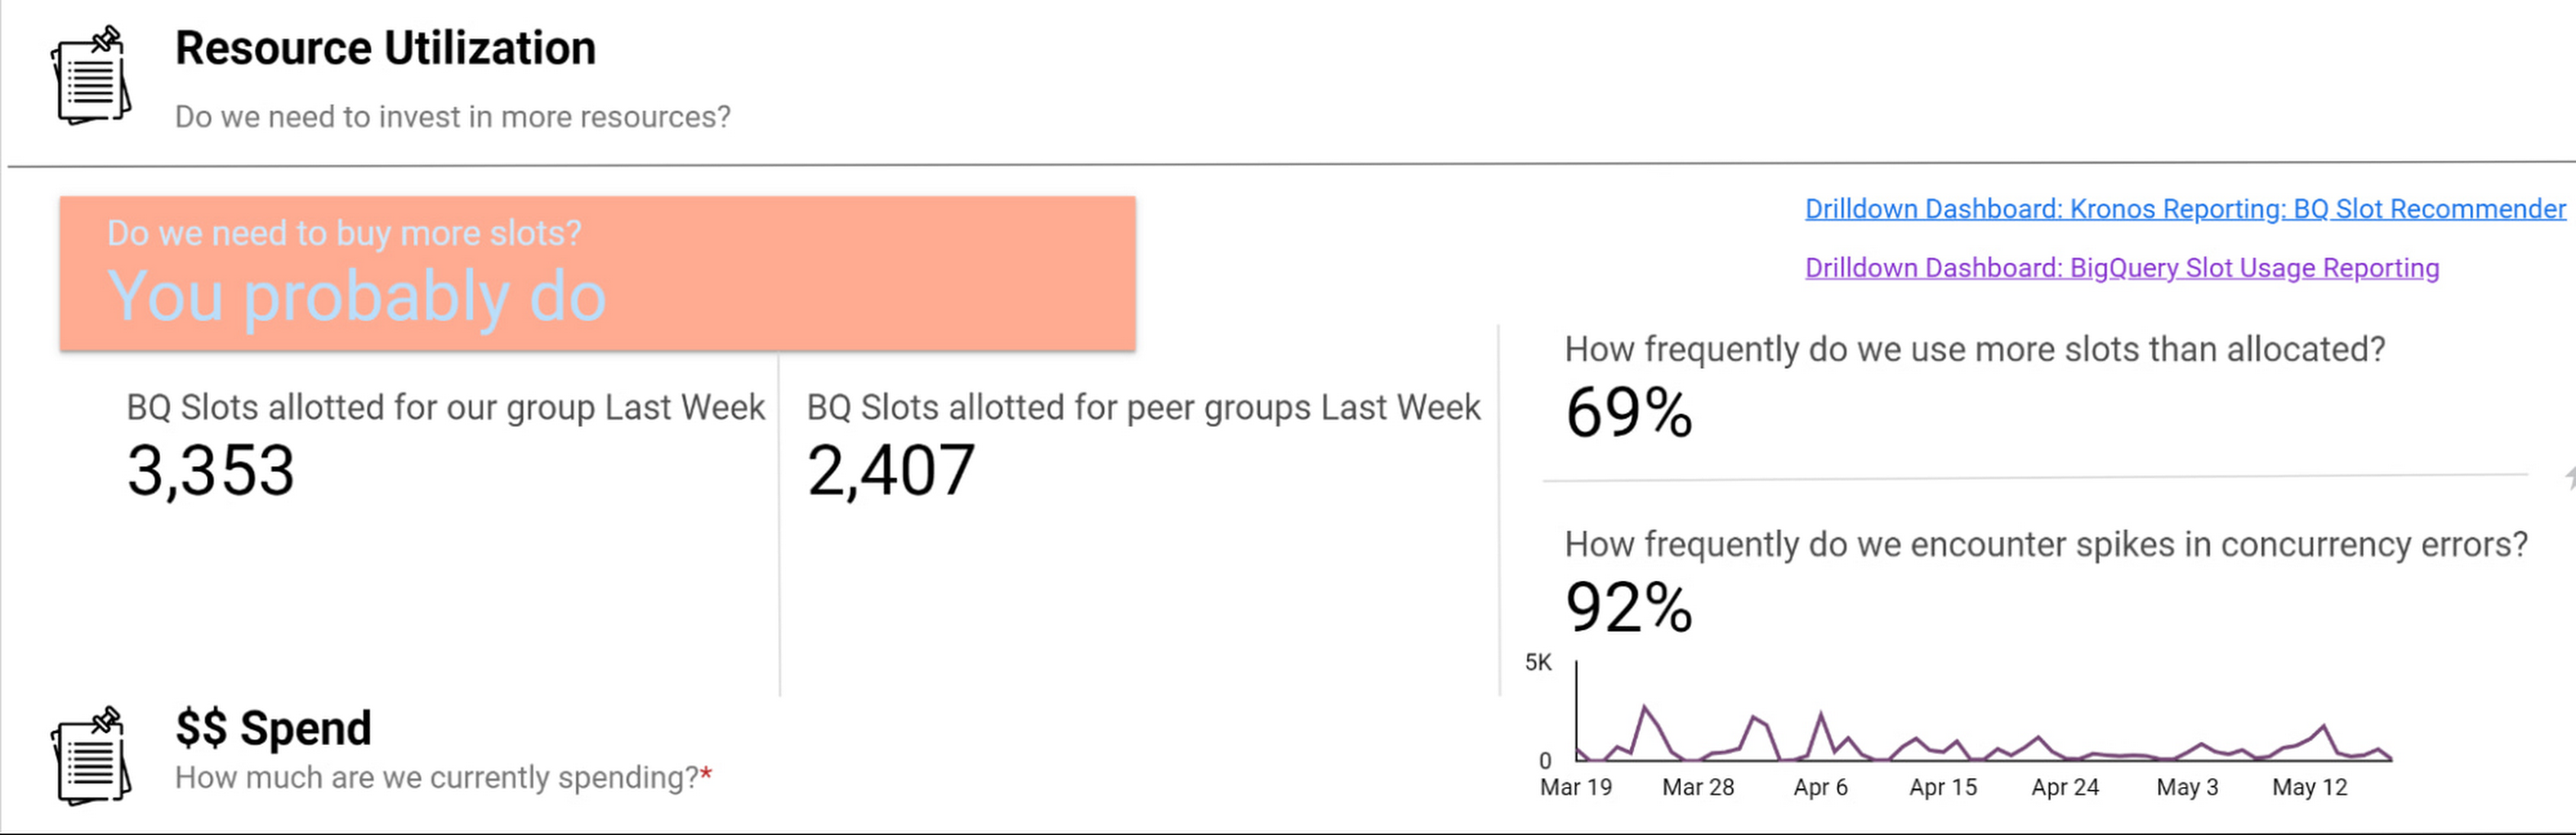
Suppose an organization wants to purchase capacity for a period of time. In that case, we provide an average cost for a slot during that time and charge them based on their slot usage for queries, multiplied by the average price.
Teams can see whether their consumption matches their reservations with a consistent, high-level number. We apply the same approach to tools like Dataproc by aggregating up the costs of component services and providing an organizational cost for those services.
How we use performance signals to improve user efficiency
Instead of overcorrecting for occasional performance fluctuations by allocating excessive resources, we try to align incentives so that people make the right choices for the business. Showback doesn’t work in a vacuum — it requires context and integrated insights. Teams need to show the cost of running a dashboard as well as the ROI is in terms of end user engagement and what peer dashboards with equivalent source datasets might cost.
We want to give users the freedom to do things the way they want and need to while also educating them on achieving their goals and using best practices to reduce their costs and improve their performance. The goal is never for all dashboards to load “less than x seconds” — we believe that any dashboard can load in x seconds when it is properly designed and resourced.
For instance, BigQuery allocates slots for a new workload quickly and efficiently, and queries that are optimized and have dedicated resources consistently complete quickly. When users experience a slowdown, it’s typically because they are sharing resources or inefficiently using their resources. Variable performance is a useful signal to help users discover opportunities to optimize queries and work more productively. We value these signals as we like to focus on the aggregate experience of all users interacting with the tool, not individual interaction.
A natural way to improve user efficiency is to reward ideal behaviors and discourage those that do not align with our analytics strategy. Some examples include splitting out high-demand reporting from ad-hoc exploration to reduce concurrency errors or encouraging people to use materialized tables instead of writing complex custom SQL. For instance, a dedicated reporting project might only include an organization’s Data Studio dashboard if it directly references a table or meets other optimization requirements. Using this approach, we give our users a high degree of freedom and experimentation at the entry-level while providing a well-documented path to scale.
Visibility into query performance improves business performance
The detailed tracking information we get from Google Cloud products is critical — Google’s robust analytics performance has enabled us to scale Data Studio to over 15,000 Wayfarians. Of course, a larger user base always comes with concerns that less sophisticated users may not appropriately optimize their queries or make the best use of the infrastructure.
Evaluating the different Data Studio dashboards helps us identify opportunities to use better query optimization practices, such as reducing custom queries, connecting directly to permanent tables, or using the BI Engine to improve dashboard performance. Recently, our team built new billing projects specific for Data Studio reporting. We can scale up a reservation dedicated to reporting about a major sales event in minutes.
Beyond everyday reporting, holidays and sales events may require higher, guaranteed performance. BigQuery’s flexible capacity commitments allow us to decide at a business level whether an urgent need requires us to reprioritize resources immediately or whether we have the time to optimize queries and rebuild dashboards to be performant. These new billing projects let us evaluate if teams need to scale up resourcing, what areas they can optimize in BigQuery, or if a new reservation is needed to resource that team separately.
Recommendations for achieving high performance at low cost
Are you wondering how to allocate BigQuery slots? Teams must see direct, immediate return on their investment in performance and optimization.
Our first rule of thumb is to align resource utilization with ownership as closely as possible. This makes it easier for teams to secure dedicated resources, even if they start out small. We’re comfortable doing this because BigQuery dynamically reassigns capacity between the targeted reservation and other consumers in milliseconds. We always get the total usage of our slots — there is no wasted capacity even when we break assignments down granularly.
Once a team has a reservation, we provide reporting that consumes various BigQuery information schema views, such as query logs and reservation information, and processes it into aggregated reporting. We look for metrics like the average slots available to a query at a point in time, overall query performance, and how long queries took to execute to pinpoint the overall health of a reservation against our business objectives. Flex slots also let us experiment easily with additional capacity, and BigQuery’s performance is so consistent that we can use straightforward models to estimate return on additional slot investment.
Other key cost optimization tips we have found helpful at Wayfair include:
- Optimize for worst-case performance. Given BigQuery’s ability to share slots, we expect teams will often see much better performance, but we find that thinking it’s more effective when teams think about the most pessimistic case when resourcing their jobs.
- Take advantage of BI Engine reservations. We like to think critically about the data and workload. BI Engine reservations are excellent for workloads that query lots of small dimension tables or a few larger tables loaded into memory. In cases like that, such as with OLAP tools using pre-computed aggregates, we’ve seen BI engine investments drive a 25% reduction in average query time—excellent ROI.
- Leverage Looker for large, longitudinal datasets. Since Looker supports a wide range of use cases, we see a broader range of performance — p50 is still under a second, but p95 can get as high as a minute. For these cases, we recommend modeling user patterns [first of month, first day of week] and dynamically allocating more slots for these periods while deprioritizing batch workloads in the key windows.
- Lean in heavily on the BQ cache for broad-based reporting. To avoid a Monday morning reporting lag, We use the BigQuery cache to avoid Monday morning report loading lags. Up to 30% of our Data Studio queries hit the BQ cache, ensuring our Data Studio p95 consistently stays under 10 seconds.
- Use slots-per-job to improve experience. In our reporting, we find that the most valuable view is slots-per-job. We look for dips in slots available for jobs as this situation often correlates strongly with poor user experiences. For example, our reporting showed us that Looker has the highest volumes of queries and users on Mondays and during each month’s first two business days. We used this information to scale up slots to support these periods of highest demand, delivering on performance SLAs to support business users.

- Get a global picture of usage. We manage slots in a central tool. Teams input their requirements into a calendar to indicate when they want higher or lower capacity to inform our flex slot purchases and annual commitments. It might seem like dozens of relatively inconsistent workloads at the team level, but the picture changes when you look at demand across a week (or our entire business). Understanding global usage makes it easy for us to model baseline capacity recommendations for serving year slots versus flexible demands.
Reaping the rewards of BigQuery
From our first initial undertaking with Google Cloud to transform our storefront, we had a lot of confidence in the underlying technology offerings and the teams that ran them and their ability to meet our unique requirements. But our experience using BigQuery for internal analytics at Wayfair has exceeded our already high expectations.
BigQuery’s fast, dynamic allocation of resources and ability to transform data in place are important to our mission of maintaining consistently high performance for our users while closely managing costs. Moreover, our visibility into query and dashboard performance through BigQuery’s DSP views and other performance metrics have helped us make clearer connections between performance goals and the costs required to meet them — and guide our analysts across the company towards attaining high performance on every project.

Google Leads the Database-as-a-Service Market: Forrester Research
DOWNLOAD RESEARCH REPORTS5477
Of your peers have already downloaded this article
3:00 Minutes
The most insightful time you'll spend today!
Database-as-a-service (DBaaS) has become critical for all businesses to build and support modern business applications and operational systems. It is changing the way companies build and support business applications and operational systems. With DBaaS, organizations can provision a relational or non-relational database of any size in minutes, without needing any technical expertise.
For app developers, it offers a database platform to build simple to sophisticated applications quickly, allowing them to focus on application logic rather than deal with database administration challenges. DBaaS automates the provisioning, administration, backup, recovery, availability, security, and scalability of the database without the need for a database administrator (DBA).
In addition, DBaaS helps enterprises migrate from their on-premises databases to the cloud to save money, support elastic scale, and deliver higher performance for expanding workloads.
Analyst firm Forrester Research in its recent report on the Database-as-a-Service market has named Google Cloud a leader in this space as it supports a broader set of use cases, automation, high-end scalability and performance, and security.
Download this Forrester Research report to understand why enterprises are turning to DBaaS and why Google Cloud is a leader in this space.
Home Depot’s Interconnected Retail Experience by Virtue of Google Cloud Migration for SAP Applications

8258
Of your peers have already read this article.
1:30 Minutes
The most insightful time you'll spend today!
With nearly 2,300 stores, The Home Depot is the world’s largest home-improvement chain — a brand that professional contractors and DIYers alike have come to depend on. The home improvement industry continues to experience unprecedented demand and dramatic increases in online ordering accompanied by expanding consumer expectations for things like curbside pickup and same day delivery. The Home Depot’s decision to migrate to cloud-based infrastructure, including the migration of the company’s SAP applications on Google Cloud which began in 2017, has set it up for success in an increasingly digital world, and helped the company adapt to changing market conditions quickly.
Interconnected retail at scale
Building on a strong customer-first philosophy, The Home Depot aims to create what it calls interconnected retail—allowing customers to shop however, whenever, and wherever they want. “So many companies are focused on omni-channel retail,” explains Sam Moses, Vice President of Corporate Systems. “At The Home Depot, we wanted to take it to the next level. Interconnected retail puts the customer at the center of everything and enables them to shop in store, online, or both. Customers can begin a transaction online and continue in-store, or vice-versa.”
To support this strategy, the company’s SAP environment needed to be more agile. Running everything on-premises, from central finance to POS systems, meant that The Home Depot’s IT teams experienced redundancy and repetitive, manual processes. Their data warehouse needed an upgrade to process and analyze growing and increasingly diverse data sets. The Home Depot chose to migrate its SAP environment to Google Cloud to support both the velocity and scale needed for the business as well as critical analytics capabilities needed for its bold digital initiatives. “We chose Google Cloud to support our SAP implementation. Our decision had a lot to do with the relationship between Google Cloud and SAP and also for the applications and services that are offered by Google Cloud, like BigQuery, which are helping to enable data and analytics within our organization,” Moses explains.
After migrating its SAP applications—including S/4HANA, its customer activity repository (CAR), general ledger, e-commerce system, enterprise data warehouse and more to Google Cloud, the company now has the speed, scale and flexibility to tackle enormous spikes in the business, all while staying fully available for their customers. Additionally, The Home Depot was able to transform its financial systems and make them more agile to deliver critical information across multiple business functions in real time.
Maximizing data insights to support customer experiences
By migrating to Google Cloud, The Home Depot is leveraging Google Cloud analytics to build the industry’s most efficient supply chain including more robust demand forecasting, supplier lead times, estimated delivery times and more, all while maintaining better security than before. “We experienced unprecedented change in our customers’ behavior and their buying patterns, which puts a lot of pressure on our supply chain,” explains Moses. “So having the ability to leverage data and analytics gives us insights to know exactly what it is that our customers need.”
The company’s analysts now use BigQuery ML for machine learning directly against the company’s BigQuery data and use AutoML to determine the best model for predictions. The Home Depot’s engineers have also adapted BigQuery to monitor, analyze, and act on application performance data across all its stores and warehouses in real time—capabilities that were not as seamless in the on-premises environment.
With hundreds of projects on Google Cloud, The Home Depot’s cloud journey is well on track, but the company is always looking to the future. “As our customers’ needs have continued to evolve, and as technology has continued to evolve, our relationship with Google will continue to advance — to be able to innovate together, to be able to find new solutions together, to better serve our customers.”
Learn more about how The Home Depot is renovating its retail operation with SAP on Google Cloud.
4021
Of your peers have already watched this video.
54:30 Minutes
The most insightful time you'll spend today!
Quick Tips to Get the Most Out of Cloud Spanner
Today, IT Admins and DBAs are inundated with thankless tasks. But they no longer have to deal with that. With Cloud Spanner, they can focus on value-add and innovation instead of maintenance. Creating or scaling a globally replicated database for mission-critical apps now takes a handful of clicks.
Industry-leading high-availability and Google-grade security as defaults, not expensive add-ons, help ensure your apps stay online and more secure.
Cloud Spanner is a powerful product, but many users do not maximize its benefits.
It is the first scalable, enterprise-grade, globally-distributed, and strongly consistent database service built for the cloud specifically to combine the benefits of relational database structure with a non-relational horizontal scale.
This combination delivers high-performance transactions and strong consistency across rows, regions, and continents with an industry-leading 99.999% availability SLA, no planned downtime, and enterprise-grade security. Cloud Spanner revolutionizes database administration and management and makes application development more efficient.
This video highlights best practices, strategies for optimizing applications and workloads, and ways to improve performance and scalability. This live demos shows real-time speed-ups of transactions, queries, and overall performance.
Additionally, this talk explores techniques for monitoring Cloud Spanner to identify performance bottlenecks. Watch now to learn more.
Discover Effingo: Google’s Solution to Moving Data at Massive Scale

1354
Of your peers have already read this article.
3:30 Minutes
The most insightful time you'll spend today!
Every hour of every day, Google moves a lot of data around the world. But how? With the Effingo (Latin for ‘to duplicate’ or ‘copy’) data copying service, a Google-only service that moves data internally and on Google Cloud customers’ behalf.
As a Google Cloud customer perhaps you move data with Storage Transfer Service, a managed transfer option that provides out-of-the-box security, reliability, and performance, that eliminates the need to optimize and maintain scripts, and handle retries. Storage Transfer Service is useful for consolidating data from separate projects, to move data into a backup location, or to change the location of your data.
Likewise, Google’s internal services need very similar functionality to manage their data. This includes data that is in charge of the ecosystem of Google Cloud services, such as BigQuery and Cloud Spanner.
Effingo solves a challenging problem of data movement at a global scale. It supports a wide range of workloads with different traffic characteristics and different requirements for data replication, durability, and latency. In this article we will explore the main motivations behind data movement and solutions to core infrastructure problems that we face when copying exabytes of data on a daily basis.
Why move data in the first place?
But first, let’s think about why you even want to move or geographically distribute your data.
For one thing, you want to replicate your data for durability and reliability. You definitely don’t want to keep a single copy of your data. In the end, we’re talking about a file that is stored on a hard drive. Any hard drive can fail at any point. For this reason, keeping copies of your data in different locations helps ensure that at any point of time there is a copy of your file that you can read from. Moreover, these locations should be geographically distant from each other to avoid even temporary data loss due to natural disasters, network cuts, and other incidents that can impact a local area.
Second, you want your data to be close to your users to reduce latency. You want to serve data with minimal delay to give a great user experience. In many cases, delays caused by data transfers from remote locations can spoil the usability of your application or create the perception that your service doesn’t work. According to Google research, 53% of mobile users abandon sites that take over 3 seconds to load. There are other consequences of lack of data proximity: for example, transferring data from distant locations wastes network resources, which can have a negative impact on the environment. Google has been carbon-neutral for our operations since 2007, and we have matched 100% of the electricity consumption of our operations with renewable energy purchases annually since 2017, but we aim higher: Our goal is to run all our data centers and offices on carbon-free energy, 24/7, by 2030.
The third reason to geographically distribute your data is to balance storage capacity between clusters. This reduces the cost of storing data because it enables us to increase the overall capacity of our data centers and use computation power in less loaded clusters. We can then limit the amount of wasted resources and use otherwise idle hardware. This is especially relevant for batch processing and storing cold data where the exact storage location is not that important.
What are the challenges?
Operating at such a large scale as Google makes data movement a challenging problem for several reasons. Here are a few examples.
Data must be secure and consistent at its destination. Achieving this is complex. For example, to copy a file from one location to another, you need the following: throughput to read and write to disks, network capacity to transfer bytes between data centers, and compute resources to instrument the whole operation.
Considering the volume of data that Google operates on, high and predictable throughput is one of the key features of a copy service at scale. It is typical to transfer terabytes of data per second, and so it’s essential to have a scalable service that can handle traffic with sometimes rapidly changing patterns. It poses a further question: how to run such a service and still be resource efficient?
Finally, it’s crucial to ensure high system availability. Google infrastructure is dynamic and copying data between any two clusters may behave differently at different points of time. Effingo needs to be resilient to cluster turndowns, network bottlenecks, rapid changes in resource demands and capacity, and so on.
How do we solve (some) of these problems?
One of the core use cases for data movement is replication. If you want to ensure that your data is reliable, you want to keep more than one copy, ideally in different locations, to be less prone to data loss.
Let’s consider the following example. You have a file in cluster A, and you want to make copies in destinations B – G.
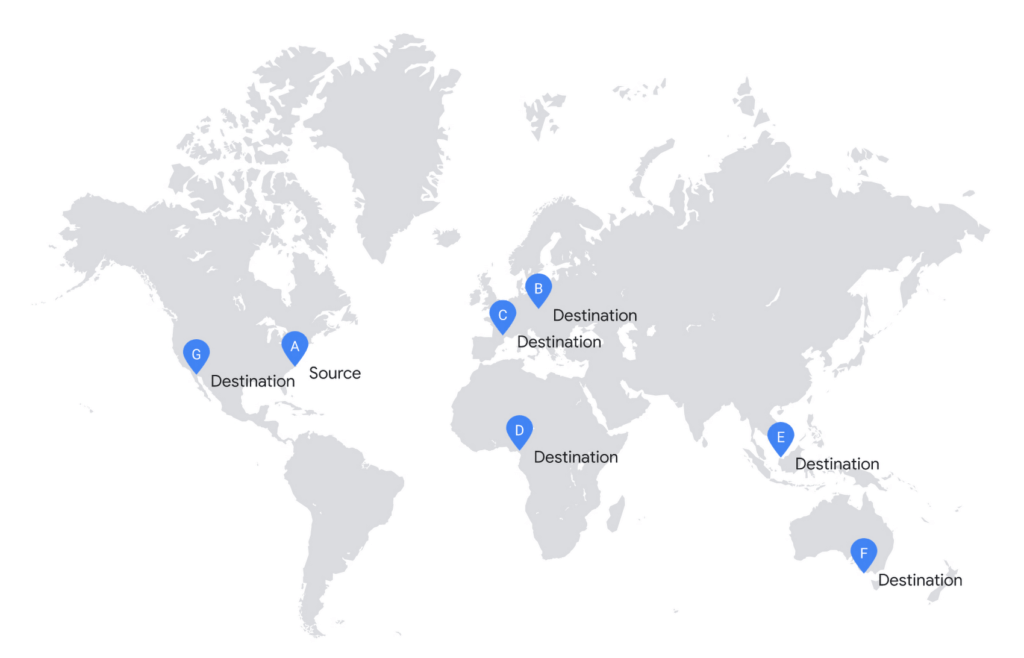
In the simplistic approach, you would start copying to all destinations in parallel.
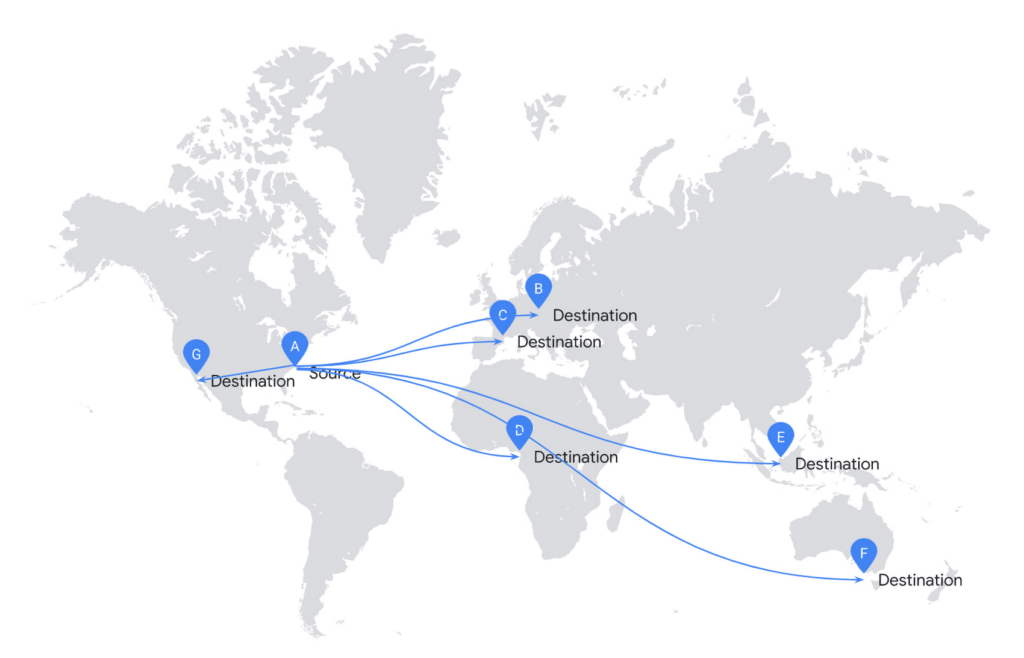
Unfortunately, it is highly inefficient to replicate your file this way. This solution doesn’t scale and requires significant investment in infrastructure.
If you consider the cost of network infrastructure, moving data across the ocean is an expensive operation. Effingo creates data transfer plans that reduce the volume of data to transfer across the ocean. If possible, it reuses already replicated data as a new source.
To create data transfer plans Effingo needs to know alternative data sources and be aware of the network topology.
If it goes to the alternative sources, Effingo stores a recent history of transferred files together with their metadata and time-bound permissions to access the files. Whenever a new copy is issued, Effingo checks whether there were copies of the original file that could serve as the same source but in the alternative location. Worth noting is that Effingo is very strict in verifying that both files — the requested source file and the alternative transfer file — are indeed the same to follow high security standards. Effingo not only checks whether the same user issued a copy from the same source but also if file properties including checksum, ciphertext checksum, mtime and several others match.
Once Effingo knows the source files and their alternative sources, it creates a transfer plan over the Google network. Effingo has a model of the network in the form of a graph where each location is a node and each edge is a weighted link between each node. For each copy Effingo creates a Minimum Spanning Tree over such a graph, which serves as an input to the transfer engine. Thanks to this approach we can select a plan that is optimal for each copy.
In the next example, we show a more efficient approach. Effingo first makes an expensive copy to a remote location and then uses it as a new source. For instance, Effingo first copies a file from the US (source A) to Europe (destination C) and then uses the Europe-based file as a copy source for copies on the same continent. Note that Effingo never stores files in temporary locations for optimization purposes – the service only uses locations explicitly requested by our users.
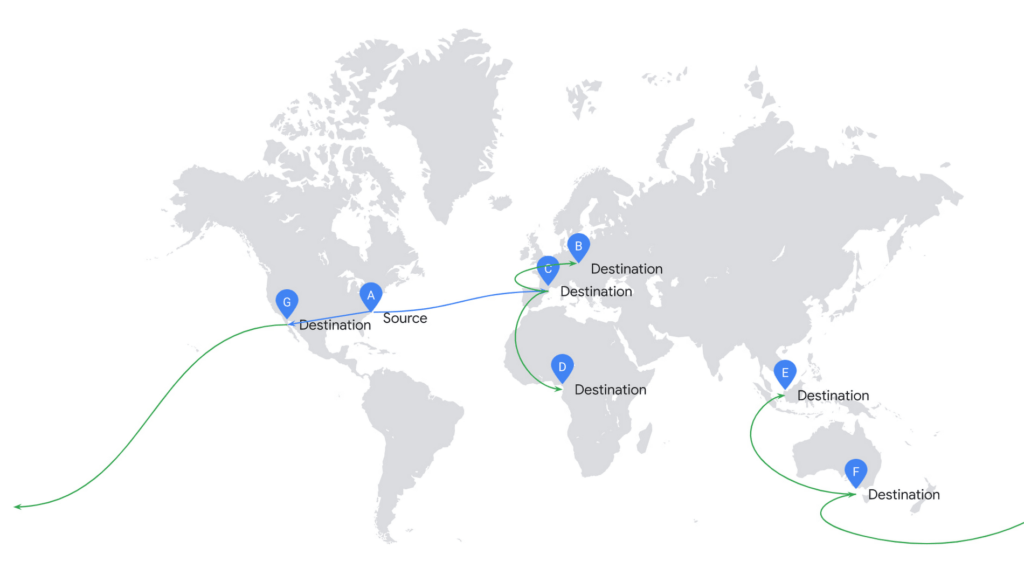
In addition to resource efficiency, the main challenge is to ensure high throughput of data transfer. We solve this problem by applying several approaches that address different problems that may arise.
As described above, our customers’ workloads exhibit a range of different traffic patterns, which results in dynamic changes in capacity on each network link. For this reason, Effingo not only needs to respond to altering resource availability, but also to ensure user fairness in such conditions. In other words, Effingo wants all copy operations to progress while using resources in the best possible way. To achieve this, it uses sophisticated parallelism controls. These controls scale the service up to meet increased demand and limit service capacity if there is service overload, performance degradation, or resource waste.
Further, Effingo must be very resilient and react quickly to errors. On the file level, the service extensively uses retries for transient failures and aborts transfers quickly if it detects non-retryable errors. Effingo uses metrics, logs, and other observability signals to adjust data transfers when needed. For example, it can detect that copies from a specific source are slow and there is another file replica available. Effingo then reconfigures the copy operation to use the other replica to complete the data move.
Data movement at global scale is hard
Hopefully at this point you have a better understanding of why moving data is a challenging problem for infrastructure that operates at Google’s global scale. Effingo supports a range of services that run on Google infrastructure, including Google Cloud services and many internal Google services. While moving data at large scale requires a lot of attention to resource usage and resilience to support high throughput, there is good news: We keep working on this problem and make our infrastructure better every day, so you can run your business on Google Cloud and all data movement is transparent to you.
More Relevant Stories for Your Company

How TapClicks’ Google Cloud Migration Makes Life Easy for Marketers
Editor’s note: In this blog post we learn how TapClicks migrated to Google Cloud to offer their marketing customers a unified platform for data management, operations, insights, and analysis. TapClicks is a smart marketing cloud, powered by data, that unifies our customer’s marketing. By choosing to migrate our core applications last

Google Migration and BigQuery Brings PedidosYa Closer towards its Goal of Becoming Data-driven
Editor’s note: PedidosYa is the market leader for online food ordering in Latin America, serving 15 markets and over 400 cities. It’s also one of the largest brands within the German multinational company Delivery Hero SE. With over 20 million app downloads, PedidosYa provides the best online delivery experience through




Skincare Firm Scales 4X in Minutes with SAP on Google Cloud
As the number one skincare brand in the United States, Rodan + Fields must support its team of over 300,000 of independent contractors as well as work to ensure a really personalized experience for customers. To keep pace with the company’s growth, Rodan + Fields realized it needed a more

How Intelligent and Trusted Data Cloud is Pivotal for Digital Disruption
Businesses that are dependent on legacy systems find it real hard to derive desired business results and unlock value from their ever-growing volume of siloed data, as a major chunk of their efforts and resources are invested in its extensive maintenance and management. Even with the adoption of latest tools
