





Fairygoodboss and Google Cloud Tied to Advancing Diversity and Female Leadership at Workplaces

5120
Of your peers have already read this article.
2:00 Minutes
The most insightful time you'll spend today!
May is Asian American Pacific Islander Heritage Month — a time for us to come together to celebrate and remember the important people and history of Asian and Pacific Island heritage. This feature highlights founder Georgene Huang and how her startup Fairygodboss uses easy to use Google Cloud tools to grow and innovate.
Coming from a male-dominated industry like Wall Street, I never thought much about my gender. I was so focused on work that I didn’t feel like I could focus on my identity as a woman of color. That all changed when I found myself thrust into the job market while two months pregnant.
Traditionally, job-seeking sites are built by – and geared towards – men and their professional needs. There was no recruiting site that broke down what candidates who identify as women might expect from a company, let alone women of color like myself. I founded Fairygodboss to create a space where women can crowdsource information about opportunities and employers in order to make informed career decisions.
Fairygodboss
Fair•y•god•boss (noun): A person who elevates women at work.
Fairygodboss is the largest career community for women. In researching potential employers, I had many questions surrounding company culture, maternity leave, and women in leadership positions. While sites like Glassdoor provide high-level details for job seekers, I wanted more concrete examples and data than general salary information and anecdotes about work-life balance.
Fairygodboss began as a job review site geared towards women, but has expanded significantly since our initial launch. In addition to providing free resources like career connections, job listings, virtual recruiting events, community advice, and real research on how companies treat women, we also proactively help companies improve gender diversity. Fairygodboss partners with hundreds of top employers to create a 360-degree recruiting and employer branding program designed to drive female applicants to job postings by showcasing a company’s track record of women in leadership within a company, and their diversity investments.

Google Cloud + Fairygodboss: Data defined
At our core, Fairygodboss is a data-driven company, and we rely on Google Cloud to help us process, store, and analyze user-driven events occurring on the site. As a highly scalable, serverless, and cost-effective data warehousing solution, BigQuery collect millions of events each day, helping us identify where traffic is coming from (and where it goes next), and it produces actionable insights to provide better recommendations, information, and opportunities for women visiting our platform.
After seamlessly connecting our BigQuery data to Data Studio, we have been able to visualize and make sense of all the data we receive on our platform. Unlike some other data visualization tools, Data Studio allows us to analyze data in real time. With tools like BigQuery, we are now able to identify trends and gain a deep understanding for how our users interact with our site.
Google for Startups Accelerator: Women Founders
In order to provide more accurate job recommendations for our users, the Fairygodboss team wanted to build a machine learning prototype to classify our users and jobs into categories to facilitate more effective matching. So we applied for the Google for Startups Accelerator: Women Founders, a three-month digital accelerator program for high-potential Seed to Series A tech startups based in the U.S. and Canada. Along with tailored mentorship and product support from Googlers and industry experts, the Google for Startups Accelerator provided $100K in Google Cloud credits to scale our businesses. The mentorship we received from the Google Cloud technical experts as part of the Accelerator – special shout out to Peter Novig! – empowered us to integrate Cloud AutoML into our systems and ultimately curate more accurate job suggestions for our users.
Not only did the Google for Startups Accelerator program help to achieve our business goals for the year, it was also extremely beneficial to be connected with a cohort of other women founders of color. While we are all building different kinds of businesses across different industries, the guidance around fundraising, scaling teams, and coping with the struggles of being a founder rang true for all of us.
Advancing the community
It can be daunting to launch your own business – and even more so as an AAPI woman. Throughout my career, I am certain I have experienced unconscious bias around my race. Specifically, there have likely been “model minority” stereotypes about my demeanor and math abilities, assumptions that I may be mild-mannered or agreeable. While frustrating, these unfair tropes actually inspired me to see myself beyond others’ perceptions. Why be either analytical or creative, meek or brash, inspiring or agreeable? It’s the ors of life that prevent us from seeing ourselves as truly multi-dimensional individuals. I aspired to be more instead of or, and want my company to be as well.
As an inclusion-focused business, it is extremely important that Fairygodboss mindfully engage with all underrepresented groups. Diversity can be sliced in many different ways, and these intersections lead to great opportunities for change. We have a team of volunteer ‘culture wizards’ at work that provide educational resources and videos for those wanting to learn more about different cultures and identities from members of under-represented groups. We also practice what we preach at Fairygodboss by prioritizing diverse slates and diversity in our own hiring process. We aim for the talent we hire to be representative of the diverse communities we support. It is imperative to take an intentional approach to hiring diverse talent, as it falls on all employers to promote equity and inclusion—there are always ways in which we can all improve. Fairygodboss looks forward to evolving with Google Cloud in 2021 and beyond as we work together to foster inclusive teams around the world.
If you want to learn more about how Google Cloud can help your startup, visit our Startup Program application page here and sign up for our monthly startup newsletter to get a peek at our community activities, digital events, special offers, and more.
Google Cloud Helped Digitec Galaxus Personalize Over 2 Million Newsletters in a Week

8299
Of your peers have already read this article.
3:00 Minutes
The most insightful time you'll spend today!
Digitec Galaxus AG is the biggest online retailer in Switzerland, operating two online stores: Digitec, Switzerland’s online market leader for consumer electronics and media products, and Galaxus, the largest Swiss online shop with a steadily growing range of consistently low-priced products for almost all daily needs.
Known for its efficient, personalized shopping experiences, it’s clear that Digitec Galaxus understands what it takes to deliver a platform that is interesting and relevant to customers every time they shop.
The problem: Personalizing decisions for every situation
Digitec Galaxus already had established an engine to help them personalize experiences for shoppers when they reached out to Google Cloud. They had multiple recommendation systems in place and were also extensive early adopters of Recommendations AI, which already enabled them to offer personalized content in places like their homepages, product detail pages, and their newsletter.
But those same systems sometimes made it difficult to understand how best to combine and optimize to create the most personalized experiences for their shoppers. Their requirements were threefold:
- Personalization: They have over 12 recommenders they can display on the app, however they would like to contextualize this and choose different recommenders (which in turn select the items) for different users. Furthermore they would like to exploit existing trends as well as experiment with new ones.
- Latency: They would like to ensure that the solution is architected so that the ranked list of recommenders can be retrieved with sub 50 ms latency.
- End-to-end easy to maintain & generalizable/modular architecture: Digitec wanted the solution to be architected using an easy to maintain, open source stack, complete with all MLops capabilities required to train and use contextual bandits models. It was also important to them that it is built in a modular fashion such that it can be adapted easily to other use cases which have in mind such as recommendations on the homepage, Smartags and more .
To improve, they asked us to help them implement a machine learning (ML) contextual bandit based recommender system on Google Cloud taking all the above factors into consideration to take their personalization to the next level.
Contextual bandits algorithms are a simplified form of reinforcement learning and help aid real-world decision making by factoring in additional information about the visitor (context) to help learn what is most engaging for each individual. They also excel at exploiting trends which work well, as well as exploring new untested trends which can yield potentially even better results. For instance, imagine that you are personalizing a homepage image where you could show a comfy living room couch or pet supplies.
Without a contextual bandit algorithm, one of these images would be shown to someone at random without considering information you may have observed about them during previous visits. Contextual bandits enable businesses to consider outside context, such as previously visited pages or other purchases, and then observe the final outcome (a click on the image) to help determine what works best.
Creating a personalization system with contextual bandits
While Digitec Galaxus heavily personalizes their website homepages, they are very very sensitive and also require more cross-team collaboration to update and make changes.
Together with the Digitec Galaxus team, we decided to narrow the scope and focus on building a contextual bandit personalization system for the newsletter first. The digitec Galaxus team has complete control over newsletter decisions and testing various ML experiments on a newsletter would have less chance of adverse revenue impact than a website homepage.
The main goal was to architect a system that could be easily ported over to the homepage and other services offered by Digitec with minimal adaptations. It would also need to satisfy the functional and non-functional requirements of the homepage as well as other internal use cases.
Below is a diagram of how the newsletter’s personalization recommendation system works:

- The system is given some context features about the newsletter subscriber such as their purchase history and demographics. Features are sometimes referred to as variables or attributes, and can vary widely depending on what data is being analyzed.
- The contextual bandit model trains recommendations using those context features and 12 available recommenders (potential actions).
- The model then calculates which action is most likely to enhance the chance of reward (a user clicking in the newsletter) and also minimize the problem (an unsubscribe).
Calculating whether a click was a newsletter or an unsubscribe enabled the system to optimize for increasing clicks and avoid showing non-relevant content to the user (click-bait). This enabled Digitec Galaxus to exploit popular trends while also exploring potentially better-performing trends.
How Google Cloud helps
The newsletter context-driven personalization system was built on Google Cloud architecture using the ML recommendation training and prediction solutions available within our ecosystem.
Below is a diagram of the high-level architecture used:
The architecture covers three phases of generating context-driven ML predictions, including:
ML Development: Designing and building the ML models and pipeline
Vertex Notebooks are used as data science environments for experimentation and prototyping. Notebooks are also used to implement model training, scoring components, and pipelines. The source code is version controlled in Github. A continuous integration (CI) pipeline is set up to automatically run unit tests, build pipeline components, and store the container images to Cloud Container Registry.
ML Training: Large-scale training and storing of ML models
The training pipeline is executed on Vertex Pipelines. In essence, the pipeline trains the model using new training data extracted from BigQuery and produces a trained, validated contextual bandit model stored in the model registry. In our system, the model registry is a curated Cloud Storage.
The training pipeline uses Dataflow for large scale data extraction, validation, processing, and model evaluation, and Vertex Training for large-scale distributed training of the model. AI Platform Pipelines also stores artifacts, the output of training models, produced by the various pipeline steps to Cloud Storage. Information about these artifacts are then stored in an ML metadata database in Cloud SQL. To learn more about how to build a Continuous Training Pipeline, read the documentation guide.
ML Serving: Deploying new algorithms and experiments in production
The training pipeline uses batch prediction to generate many predictions at once using AI Platform Pipelines, allowing Digitec Galaxus to score large data sets. Once the predictions are produced, they are stored in Cloud Datastore for consumption. The pipeline uses the most recent contextual bandit model in the model registry to evaluate the inference dataset in BigQuery and give a ranked list of the best newsletters for each user, and persist it in Datastore. A Cloud Function is provided as a REST/HTTP endpoint to retrieve the precomputed predictions from Datastore.
All components of the code and architecture are modular and easy to use, which means they can be adapted and tweaked to several other use cases within the company as well.
Better newsletter predictions for millions
The newsletter prediction system was first deployed in production in February, and Digitec Galaxus has been using it to personalize over 2 million newsletters a week for subscribers. The results have been impressive, 50% higher than our baseline. However, the collaboration is still ongoing to improve the results even more.
“Working at this level in direct exchange with Google’s machine learning experts is a unique opportunity for us. The use of contextual bandits in the targeting of our recommendations enables us to pursue completely new approaches in personalization by also personalizing the delivery of the respective recommender to the user. We have already achieved good results in our newsletter in initial experiments and are now working on extending the approach to the entire newsletter by including more contextual data about the bandits arms. Furthermore, as a next step, we intend to apply the system to our online store as well, in order to provide our users with an even more personalized experience. To build this scalable solution, we are using Google’s open source tools such as TFX and TF Agents, as well as Google Cloud Services such as Compute Engine, Cloud Machine Learning Engine, Kubernetes Engine and Cloud Dataflow.”—Christian Sager, Product Owner, Personalization ( Digitec Galaxus)
Since the existing architecture and system is also dynamic, it will automatically adapt to new behaviours, trends, and users. As a result, Digitec Galaxus plans to re-use the same components and extend the existing system to help them improve the personalization of their homepage and other current use cases they have within the company. Beyond clicks and user engagement, the system’s flexibility also allows for future optimization of other criteria. It’s a very exciting time and we can’t wait to see what they build next!
What Drives Your Organization to be Data-driven?

4879
Of your peers have already read this article.
4:00 Minutes
The most insightful time you'll spend today!
Every organization has its own unique data culture and capabilities. Yet each is expected to use technology trends and solutions in the same way as everyone else. Your organization may be built on years of legacy applications, you may have developed a considerable amount of expertise and knowledge, yet you may be asked to adopt a new approach based on a technology trend. On the other hand, you may be on the other side of the spectrum, a digitally native organization built with engineering principles from scratch without legacy systems but expected to follow the same principles as process driven, established organizations. The question is, should we treat these organizations in the same way when it comes to data processing? In this series of blogs and papers this is what we are exploring: how to set up an organization from the first principles from data analyst, data engineering and data science point of view. In reality, there is no such organization that is solely driven by one of these but it is likely to be a combination of multiple types. What type of organization you become is then driven by how much you are influenced by each of these principles.
When you are considering what data processing technology encompasses, take a step back and make a strategic decision based on your key goals. This can be whether you optimize for performance, cost, reduction in operational overhead, increase in operational excellence, integration of new analytical and machine learning approaches. Or perhaps you’re looking to leverage existing employees’ skills while meeting all your data governance and regulatory requirements. We will be exploring these different themes and will focus on how they guide your decision-making process. You may be coming from technologies which are solving some of the past problems and some of the terminologies may be more familiar, however they don’t scale your capabilities. There is also the opportunity cost of prioritizing legacy and new issues that arise from a transformation effort, and as a result your new initiative can set you further behind on your core business while you play catch up to an ever changing technology landscape.
Data value chain
The key for any ingestion and transformation tool is to extract data from a source and start acting on it. The ultimate goal is to reduce the complexity and increase the timeliness of the data. Without data, it is impossible to create a data driven organization and act on the insights. As a result, data needs to be transformed, enriched, joined with other data sources, and aggregated to make better decisions. In other words, insights on good timely data mean good decisions.
While deciding on the data ingestion pipeline, one of the best approaches is to look into the volume of data, the velocity of the data, and type of data that is arriving. Other considerations include the number of different data sources you are managing, whether you need to scale to thousands of sources using generic pipelines, whether you want to create one generic pipeline but then apply data quality rules and governance. ETL tools are ideal for this use case as generic pipelines can be written and then parameterized.
On the other hand, consider the data source. Can the data be directly ingested without transforming and formatting the data? If the data does not need to be transformed and can be ingested directly into the data warehouse as a managed solution. This not only reduces the operational costs but also allows for more timely data delivery. If the data is coming in through an unstructured format such as XML or in a format such as EBCDIC and needs to be transformed and formatted, then a tool with ETL Capabilities can be used depending on the speed of the data arrival.
It is also important to understand the speed and time of arrival of the data. Think about your SLAs and time durations/windows that are relevant for your data ingestion plans. This would not only drive the ingestion profiles but would also dictate which framework to use. As discussed above, velocity requirements would drive the decision-making process.
Type of Organization
Different organizations can be successful by employing different strategies based on the talent that they have. Just like in sports, each team plays with a different strategy with the ultimate goal of winning.
Organizations often need to decide on what’s the best strategy to take in respect to data ingestion and processing – whether you need to hire an expensive group of data engineers, or exploit your data wizards and analysts to enrich and transform data that can be acted on, or whether it would be more realistic to train the current workforce to do more functional/high value work rather than to focus on building generally understood and available foundational pieces.
On the other hand, the transformation part of ETL pipelines as we know it, dictates where the load will be. All of these are made a reality in the cloud native world where data can be enriched, aggregated, and joined. Loading data into a powerful and modern data warehouse means that you can already join and enrich the data using ELT. Consequently, ETL isn’t really needed in its strict terms anymore if the data can be loaded directly into the data warehouse.
All of the above was not possible in the traditional, siloed, and static data warehouses and data ecosystems whereby systems would not talk to each other or there were capacity constraints in respect to both storing and processing the data in the expensive Data Warehouse. This is no longer the case in the BigQuery world as storage is now cheap and transformations are now much more capable without constraints of virtual appliances.
If your organization is already heavily invested into an ETL tool, one option is to use them to load BigQuery and transform the data initially within the ETL tool. Once the as-is and to-be are verified to be matching, then with the improved knowledge and expertise one can start moving workloads into BigQuery SQL, and effectively do ELT.
Furthermore, if your organization is coming from a more traditional data warehouse that extensively relies on stored procedures and scripting, then the question that one may ask is, do I continue leveraging these skills and expertise and use these capabilities that are also provided in BigQuery? ELT with BigQuery is more natural, similar to what’s already in Teradata BTEQ, Oracle PL/SQL but migrating from ETL to ELT requires changes. This change then enables exploiting streaming use cases, such as real-time use cases in retail. This is because there is no preceding step before data is loaded and made available.
Organizations can be broadly classified under 3 types as Data Analyst Driven, Data Engineering driven, and Blended organization. We will be covering a Data Science driven organization within the Blended category.
Data Analyst Driven
Analysts understand the business and are used to using SQL/spreadsheets. Allowing them to do advanced analytics through interfaces that they are accustomed to enables scaling. As a result, easy to use ETL tooling to bring data quickly into the target system becomes a key driver. Ingesting data directly from a source or staging area then also becomes critical as it allows analysts to exploit their key skills using ELT and increases timeliness of the data. This is commonplace with traditional EDWs and realized by extended capabilities of using Stored Procedures and Scripting. Data is enriched, transformed, and cleansed using SQL and ETL tools act as the orchestration tools.
The capabilities brought by cloud computing on separation of data and computation changes the face of the EDW as well. Rather than creating complex ingestion pipelines, the role of the ingestion becomes, bringing data close to the cloud, staging on a storage bucket or on a messaging system before being ingested into the cloud EDW. This then releases data analysts to focus on looking into data insights using tools and interfaces that they are accustomed to.
Data Engineering / Data Science Driven
Building complex data engineering pipelines is expensive but enables increased capabilities. This allows creating repeatable processes and scaling the number of sources. Once complemented with cloud it enables agile data processing methodologies. On the other hand, data science organizations allow carrying out experiments and producing applications that work for specific use cases but are not often productionised or generalized.
Real-time analytics enables immediate responses and there are specific use cases where low latency anomaly detection applications are required to run. In other words, business requirements would be such that it has to be acted upon as the data arrives on the fly. Processing this type of data or application requires transformation done outside of the target.
All the above usually requires custom applications or state-of-the-art tooling which is achieved by organizations that excel with their engineering capabilities. In reality, there are very few organizations that can be truly engineering organizations. Many fall into what we call here as the blended organization.
Blended org
The above classification can be used on tool selection for each project. For example, rather than choosing a single tool, choose the right tool for the right workload, because this would reduce operational cost, license cost and use the best of the tools available. Let the deciding factor be driven by business requirements: each business unit or team would know the applications they need to connect with to get valuable business insights. This coupled with the data maturity of the organization would be the key to making sure the right data processing tool would be the right fit.
In reality, you are likely to be somewhere on a spectrum. Digital native organizations are likely to be closer to being engineering driven, due to their culture and business that they are in. However, brick and mortar organizations would be closer to being analyst driven due to the significant number of legacy systems and processes they possess. These organizations are either considering or working toward digital transformation with an aspiration of having a data engineering / software engineering culture like Google.
The blended organization with strong skills around data engineering, would have built the platform and built frameworks, to increase reusable patterns would increase productivity and then reduce costs. Data engineers focus on running Spark on Kubernetes whereas infrastructure engineers focus on container work. This in turn provides unparalleled capabilities as application developers focus on the data pipelines and even the underlying technologies or platforms changes code stays the same. As a result, security issues, latency requirements, cost demands and portability are addressed at multiple layers.
Conclusion – What type of organization are you?
Often an organization’s infrastructure is not flexible enough to react to a fast changing technological landscape. Whether you are part of an organization which is engineering driven or analyst driven, organizations frequently look at technical requirements that inform which architecture to implement. But a key, and frequently overlooked, component needed to truly become a data-driven organization is the impact of the architecture on your data users. When you take into account the responsibilities, skill sets, and trust of your data users, you can create the right data platform to meet the needs of your IT department as well as your business.
To become a truly data-driven organization, the first step is to design and implement an analytics data platform that meets your technical and business needs. The reality is that each organization is different and has a different culture, different skills, and capabilities. Key is to leverage its strengths to stay competitive while adopting new technologies when it is needed and as it fits to your organization.
To learn more about the elements of how to build an analytics data platform depending on the organization you are, read our paper here.
Statsig’s Journey to Seamless Data Management with Google BigQuery

1200
Of your peers have already read this article.
3:30 Minutes
The most insightful time you'll spend today!
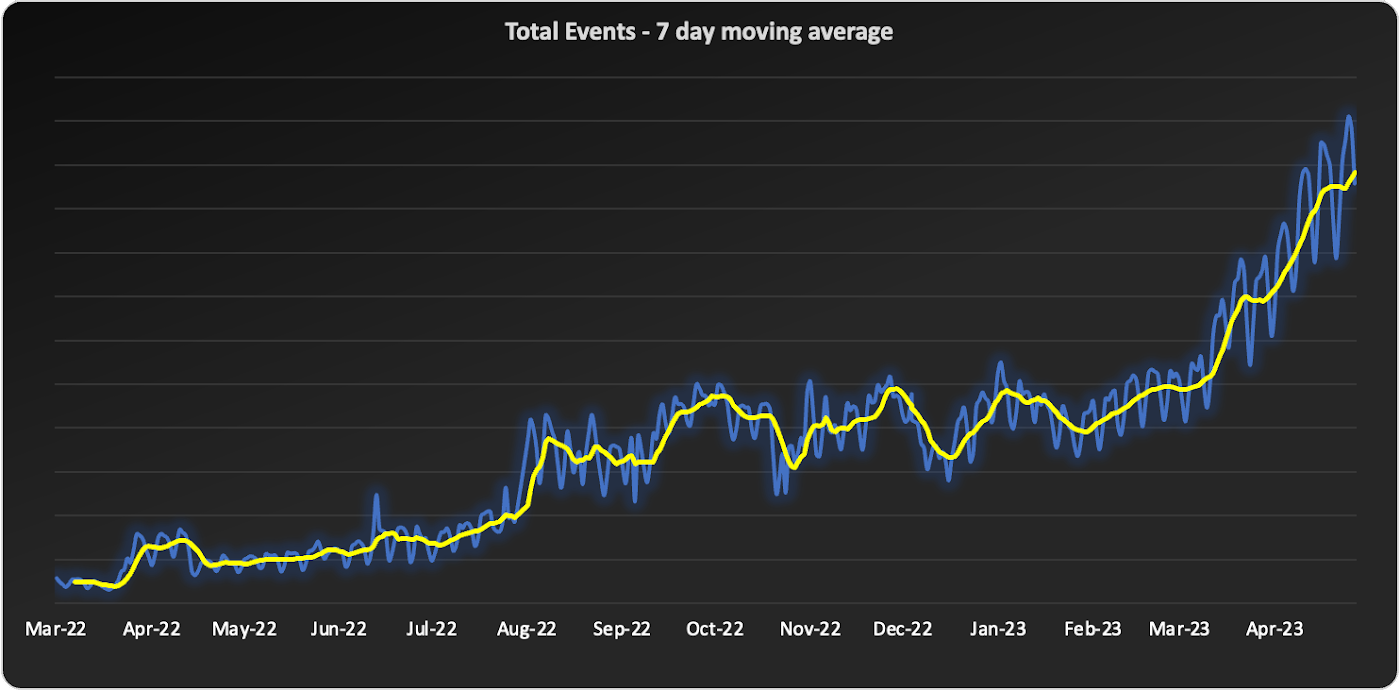
Statsig is a modern feature management and experimentation platform used by hundreds of organizations. Statsig’s end-to-end product analytics platform simplifies and accelerates experimentation with integrated feature gates (flags), custom metrics, real-time analytics tools, and more, enabling data-driven decision-making and confident feature releases. Companies send their real-time event-stream data to Statsig’s data platform, which, on average, adds up to over 30B events a day and has been growing at 30-40% month over month.
With these fast-growing event volumes, our Spark-based data processing regularly ran into performance issues, pipeline bottlenecks, and storage limits. In turn, this rapid data growth negatively impacted the team’s ability to deliver product insights on time. The sustained Spark tuning efforts that we were dealing with made it challenging to keep up with our feature backlog. Instead of spending time building new features for our customers, our engineering team was controlling significant increases in Spark’s runtime and cloud costs.
Adopting BigQuery pulled us out of Spark’s recurring spiral of re-architecture and into a Data Cloud, enabling us to focus on our customers and develop new features to help them run scalable experimentation programs.
The growing data dilemma
At Statsig, our processing volumes were growing rapidly. The assumptions and optimizations we madea month ago would become irrelevant the next month. While our team was knowledgeable in Spark performance tuning, the benefits of each change were short lived and became obsolete almost as quickly as it was implemented. As the months passed, our data teams were dedicating moretime to optimizing and tuning Spark clusters instead of building new data products and features. We knew we needed to change our data cloud strategy.
We started to source advice from companies and startups who had faced similar data scaling challenges – the resounding recommendation was “Go with BigQuery.” Initially, our team was reluctant. For us, a BigQuery migration would require an entirely new data warehouse and a cross-cloud migration to GCP.
However, during a company-wide hackathon, a pair of engineers decided to test BigQuery with our most resource-intensive job. Shockingly, this unoptimized job finished much faster and at a lower cost than our current finely-tuned setup. This outcome made it impossible for us to ignore a BigQuery migration any longer. We set out to learn more.
Investigating BigQuery
When we started our BigQuery journey, the first and obvious thing we had to understand was how to actually run jobs. With Spark, we were accustomed to daunting configurations, mapping concepts like executors back to virtual machines, and creating orchestration pipelines for all the tracking and variations required.
When we approached running jobs on BigQuery, we were surprised to learn that we only needed to configure the number of slots allocated to the project. Suddenly, with BigQuery, there were no longer hundreds of settings affecting query performance. Even before running our first migration test, BigQuery had already eliminated an expensive and tedious task list of optimizations our team would typically need to complete.
Digging into BigQuery, we learned about additional serverless optimizations that BigQuery offered out of the box that addressed many of the issues we had with Spark. For example, we often had a single task get stuck with Spark because virtual machines would be lost or the right VM shape needed to be attainable. With BigQuery’s autoscaling, SQL jobs are much more granularly defined and can move resources as needed between multiple jobs. As another example, we sometimes encountered a storage issue with Spark due to the shuffled data overwhelming a machine’s disk. On BigQuery, there is a separate in-memory shuffle service that eliminates the need for our team to worry about predicting and sizing shuffle disk sizes.
At this point, it was clear that the migration away from the DevOps of Spark and into the serverless BigQuery architecture would be worth the effort.
Spark to BigQuery migration
When migrating our pipelines over, we ran into situations where we had to rewrite large blocks of code, making it easy to introduce new bugs. We needed a way to simultaneously stage this migration without committing to huge rewrites . Dataproc is a very useful tool for this purpose. Dataproc provides us with a simple yet flexible API to spin up Spark clusters and gives us access to the full swath of configurations and optimizations that we’re accustomed to from our previous Spark deployments.
Additionally, BigQuery offers a direct Spark integration through stored procedures with Apache Spark, which provides a fully managed and serverless Spark experience native to BigQuery and allows you to call Spark code directly from BigQuery SQL. It can be configured as part of the BigQuery autoscaler and called from any orchestration tool that can execute SQL, such as dbt.
This ability to mix and match BigQuery SQL and multiple options for Spark gave us the flexibility to move to BigQuery immediately but roll out the entire migration on our timeline.
With BigQuery, we’re back to building features
With BigQuery, we could to tap into performance improvements, direct cost savings, and experienced a reduction in our data pipeline error rates. However, BigQuery really changed our business by unlocking new real-time features that we didn’t have before. A couple of examples are:
1. Fresh, fast data results
On our Spark cluster, we needed to pre-compute tens of thousands of possible results each day if a customer wanted to look at a specific detail. While only a small percentage of results would get viewed each day, we couldn’t predict which results would be needed, so we had to pre-compute it all. With BigQuery, the queries run much faster, so we now compute specific results when customers need them. We benefit from avoiding expensive jobs. To our customers, this translates into fresher data.
2. Real-time decision features
Since our migration to BigQuery began, we have rolled out several new features powered by BigQuery’s ability to compute things in near real-time, enhancing our customers’ ability to make real-time decisions.
1) A metrics explorer that lets our customers query their metric data in real-time.
2) A deep dive experience that lets our customers instantly dig into a specific user’s details instead of waiting on a 15-minute Spark job to process.
3) A warehouse-native solution that lets our customers use their own BigQuery project to run analysis.
Migrating from Spark to BigQuery has simplified many of our workflows and saved us significant money. But equally importantly, it has made it easier to work with massive data, reduced the strain on our perpetually stretched-thin data team, and allowed us to build awesome products faster for our customers.
Getting started with BigQuery
There are a few ways to get started with BigQuery. New customers get $300 in free credits to spend on BigQuery. All customers get 10GB storage and up to 1TB queries free per month, not charged against their credits. You can get these credits by signing up for the BigQuery free trial. Not ready yet? You can use the BigQuery sandbox without a credit card to see how it works.
The Built with BigQuery advantage for ISVs
Google is helping tech companies like Statsig build innovative applications on Google’s data cloud with simplified access to technology, helpful and dedicated engineering support, and joint go-to-market programs through the Built with BigQuery initiative.
More on Statsig
Companies want to understand the impact of their new features on the business, test different options, and identify optimal configurations that balance customer success with business impact. But running these experiments is hard. Simple mistakes can cause you to make wrong decisions, and lack of standardization can make results hard to compare, and reduce user trust. When implemented poorly, an experimentation program can become a bottleneck, causing feature releases to slow down or, in some cases, causing teams to skip experimentation altogether. Statsig provides an end-to-end product experimentation and analytics platform that makes it simple for companies to leverage best-in-class experimentation tooling.
If you’re looking to improve your company’s experimentation process, visit statsig.com and explore what our platform can offer. We have a generous free tier and a community of experts on Slack to help ensure your efforts are successful. Boost your business’s growth with Statsig and unlock the full potential of your data.
Built with BigQuery: Retailers Unlock the Value of Data with SoundCommerce

3243
Of your peers have already read this article.
3:30 Minutes
The most insightful time you'll spend today!
As economic conditions change, retail brands’ reliance on ever-growing customer demand puts these companies at financial and even existential risk. Top-line revenue and active customer growth do not equal profitable growth.
Despite multi-billion dollar valuations for some brands, especially those operating the direct-to-consumer model, the rising costs of meeting shoppers’ high expectations (i.e. free shipping, free returns) along with the escalating cost of goods, fulfillment operations, and delivery costs, create pressure for brands to turn a profit. The ONLY way brands drive profitable growth is by managing variable costs in real-time. This in turn mandates adopting modern data cloud infrastructure including Google Cloud services such as BigQuery.
To unlock the value of data, Google Cloud has partnered with SoundCommerce, a retail data and analytics platform that offers a unique way of connecting marketing, merchandising, and operations data and modeling it within a retail context – all so brands can optimize profitability across the business.
Profitability can be measured per order through short-term metrics like contribution profit or long-term metrics like Customer Lifetime Value (CLV). Often, retailers calculate CLV as a measure of revenue with no consideration for the variable costs of serving that customer, for instance: the costs of marketing, discounting, delivering orders to the doorstep, or post-conversion operational exceptions (e.g. cancellations, returns).
What may first appear to be a high lifetime value customer through revenue-based CLV models, may not be profitable at all. By connecting marketing, merchandising, and operations data together, brands can understand their most profitable programs, channels, and products through the lens of actual customer value – and optimize accordingly.
The journey for brands starts with the awareness and data enablement of a more complex data set containing all variable revenue, cost, and margin inputs. What does a retailer need to do to achieve this?
- All data together in one place
- Matched and deduplicated disparate data
- Data is organized into entities and concepts that business decision makers can understand
- A common definition of key business metrics (this is especially important yet challenging for retailers because systems are siloed by the department and common KPIs like contribution profit per order may be defined differently across a company)
- Branched outputs for actionability: BI dashboards vs. data activation to improve marginal profit.
Once brands understand these requirements, up next is execution. This responsibility may fall within a ‘build’ strategy on the shoulders of technical IT/data leadership and their team(s) within a brand. This offers maximum control but at maximum cost and time-to-value. Retail data sources are complicated and change often. Technical teams within brands can spend too much time building and maintaining the tactical data ingestion process, which means they are spending less time deriving business value from the data.
But it doesn’t have to be this hard. There are other options in the market that brands can consider, such as a tool like SoundCommerce which provides a library of data connectors, pre-built and customizable date mappings, and outbound data orchestrations all tailor-made and ready-to-go for retail brands.
SoundCommerce empowers retail technology leaders to:
- Maintain data ownership to allow users to send modeled data to external data warehouses or layer-on business analytics tools for greater flexibility
- Provide universal access to data across the organization so every employee can have access to and participate in a low-code or no-code experience
- Expand and democratize data exploration and activation among both technical and non-technical users
For retail business and marketing decision-makers, SoundCommerce makes it easy to:
- Calculate individual customer lifetime value through the lens of profitability – not just revenue.
- Evaluate and predict lifetime shopper performance – identify which programs drive the highest CLV impact
- Set CAC and retention cost thresholds – determine optimal Customer Acquisition Costs (CAC) and retention costs that ensure marketing efforts are profitable through the lens of total lifetime transactions
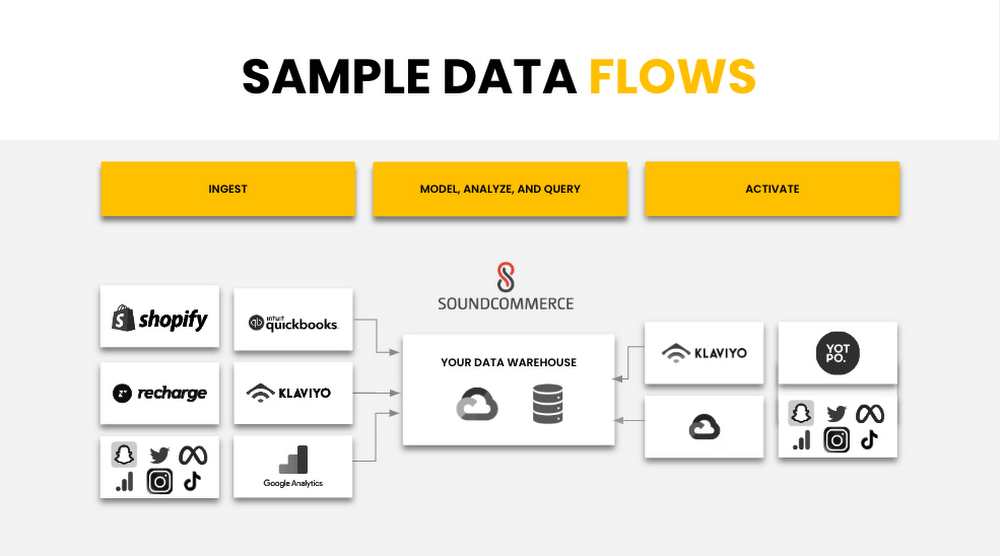
Below is a sample data flow that illustrates how SoundCommerce connects to all the tools a Retailer is using and ingests the first-party data, agnostic of the platform. SoundCommerce then models and transforms the data within the retail context for brands to take immediate action on the insights they gain from the modeled data.
SoundCommerce built on Google Cloud Platform Services
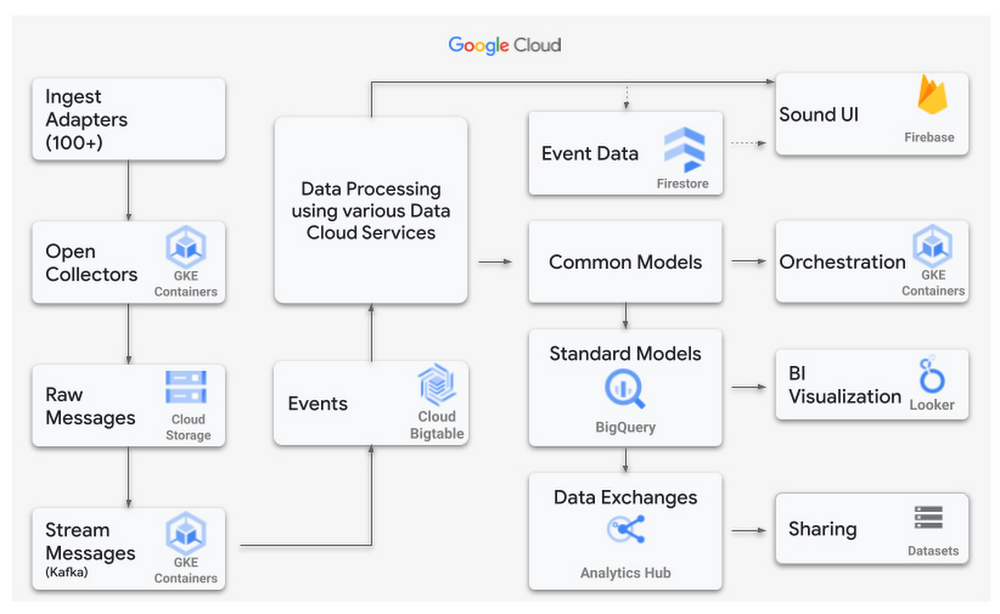
SoundCommerce selected the Google Cloud Platform and its services to achieve what they set out to do – drive profitability for retailers and brands. SoundCommerce perfected this very need of retailers to centralize and harmonize data, map to business users’ needs to infer key metrics and insights by visualizing the data, or reuse the produced datasets to build upon other use cases specific to retailers. SoundCommerce built a cloud-native solution on Google Cloud leveraging the data cloud platform. Data from various sources are ingested in raw format, parsed, and processed as messages in Cloud Storage buckets using Google Kubernetes Engine (GKE) and stored as individual events in Cloud BigTable. A mapping engine maps the data to proprietary data models stored in BigQuery to store the produced data as datasets. Customers use visualization dashboards in Looker to access the data exposed as materialized views from within BigQuery. In many cases, these views are directly accessible by the customer per their use case.
Power Retail Profitable Growth with Analytics Hub
SoundCommerce adopted BigQuery and the recent release of Analytics Hub – a data exchange that enables BigQuery users to efficiently and securely share data. This feature ensures a more scalable direct access experience for SoundCommerce’s current and future customers. It meets brands where they are in their data maturity by giving them the keys to own their data and control their analytics-driven business outcomes. With this feature, retailers can customize their analysis with additional data they own and manage.
“Retail Brands need flexible data models to make key business decisions in real-time to optimize contribution profit and shopper lifetime value,” said SoundCommerce CEO Eric Best. “GCP and BigQuery with Analytics Hub make it easy for SoundCommerce to land and maintain complex data sets, so brands and retailers can drive profitable shopper experiences with every decision.”
SoundCommerce uses Analytics Hub to increase the pace of innovation by sharing datasets with its customers in real time by using the streaming functionality of BigQuery. Customers subscribe to specific datasets through a data exchange as data is generated from external data sources and published into BigQuery. This leads to a natural flow of data that scales easily to hundreds of exchanges and thousands of listings. From the Customer’s viewpoint, Analytics Hub enables them to search listings and coalesce data from other software vendors to produce richer insights. All of the benefits are an add-on to the BigQuery features such as separation of compute and storage, petabyte-scale serverless data warehouse, and tighter integration with several Google Cloud products.
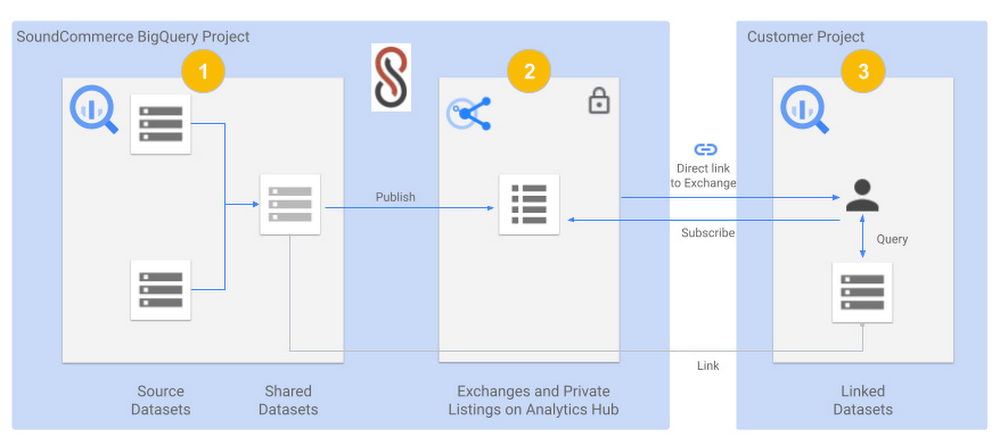
The below diagram shows a view of SoundCommerce sharing datasets with one of its customers:
- A SoundCommerce GCP project that hosts the BigQuery instance contains one or more Source Datasets that are composed into a Shared Dataset for a specific customer. The dataset is wrapped around Materialized views but can include other BigQuery objects such as Tables, Views, Authorized views and datasets, BigQuery ML models, external Tables, etc.
- The same SoundCommerce GCP project contains the data exchange that acts as a container regarding the shared datasets. The exchange is made private to securely share the curated dataset relevant to the customer. The shared dataset is published into the data exchange as a private listing. The listing inherits the security permissions that are configured on the exchange.
- SoundCommerce shares a direct link to the Exchange to the Customer, which they can add as a Linked dataset into their project in their Google Cloud Organization. The shareable link can be pointed to a private listing. From here on, the dataset is visible in the Customer project like any other dataset and immediately available to accept queries and return results. Alternatively, the customer can also view the listing in their own project under Analytics Hub and subscribe to it by adding it as a linked dataset.
SoundCommerce is incrementally onboarding customers to use Analytics Hub for all data sharing use cases. This enables brands to get business insights faster and gain an understanding of their profitable growth quickly. Plus, it gives them the ownership to own their own data and manage it how they see fit for their business. From a technical standpoint, the adoption of Analytics Hub has led to leveraging an inherent capability in BigQuery for data sharing, faster scaling, and reducing operational overhead to onboard customers.
The Built with BigQuery advantage for ISVs
Through Built with BigQuery launched in April as part of the Google Data Cloud Summit, Google is helping tech companies like SoundCommerce build innovative applications on Google’s data cloud with simplified access to technology, helpful and dedicated engineering support, and joint go-to-market programs. Participating companies can:
- Get started fast with a Google-funded, pre-configured sandbox.
- Accelerate product design and architecture through access to designated experts from the ISV Center of Excellence who can provide insight into key use cases, architectural patterns, and best practices.
- Amplify success with joint marketing programs to drive awareness, generate demand, and increase adoption.
BigQuery gives ISVs the advantage of a powerful, highly scalable data warehouse that’s integrated with Google Cloud’s open, secure, sustainable platform. And with a huge partner ecosystem and support for multi-cloud, open source tools, and APIs, Google provides technology companies the portability and extensibility they need to avoid data lock-in.
Click here to learn more about Built with BigQuery.
We thank the many Google Cloud team members including Yemi Falokun in Partner Engineering who contributed to close collaboration with the SoundCommerce team.
Unlocking the Potential of Advanced Analytics with BigQuery and Connected Vehicle Data

2872
Of your peers have already read this article.
2:30 Minutes
The most insightful time you'll spend today!
As software-defined vehicles continue to advance and the quantity of digital services grows to meet consumer demand, the data required to provide these services continue to grow as well. This makes automotive manufacturers and suppliers look for capabilities to log and analyze data, update applications, and extend commands to in-vehicle software.
The challenges the automotive sector faces can be quantified. A modern vehicle contains upwards of 70 electronic control units (ECUs), most of which are connected to one or more sensors. Not only is it now possible to exactly measure many aspects of vehicle performance, but new options become available. Using LIDAR (light detection and ranging), for example, vehicles are achieving higher levels of autonomy; this leads to a data stream from such demanding applications that may reach 25 GB per hour. For the in-vehicle processing of data, 100 million lines of software code may be present — more than a fighter jet. This in-vehicle code will have to be maintained with updates and new functionalities.
Access to the data will allow manufacturers to gain valuable insights into operational details of their vehicles. The use of this data can help to reduce costs and risks, increase ROI, support ESG initiatives, and provide valuable insights to develop innovative solutions and shorten the time to value for Electric Vehicle innovations.
Sibros’ Deep Connected Platform (DCP) makes it possible for these manufacturers to build and launch new connected vehicle use cases from production to post-sale at scale by connecting and managing all software and data throughout every life cycle stage. A key component of this platform is the Sibros Deep Logger that provides capabilities like the following:
- Full configurability of what to record, when to record it, and how fast to record it.
- High resolution timestamps of all Controller Area Network (CAN) messages.
- Dynamic application of live log configurations to receive new data points without deploying new software.
For example, properly analyzed engine data enables true predictive maintenance for the first time, which creates the option to repair or replace components before failure happens. Another example would be the evaluation of data regarding the use of certain in-car features with the goal to redesign its interior.
Two other components of the DCP are software updates and remote commands to ECUs. The DCP on Google Cloud enables seamless integration with any vehicle architecture and provides OEMs and suppliers with the platform to manage connected vehicle data at rest and in transit using a proven and secure way on a global scale.
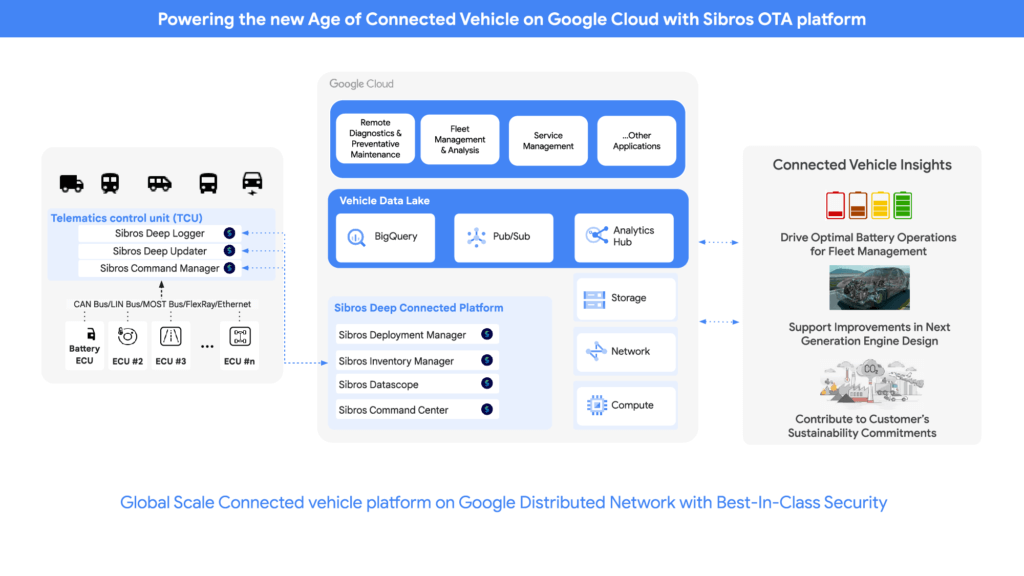
OEMs can pull data through APIs provided by Sibros into Google Data Cloud (including BigQuery) to gain access to the rich information data sets provided by the DCP within their environment and blend this data with their first party data sets to provide value insights for their business. Some of the Connected Vehicle insights that DCP information enables are:
- Damage prevention, improved operation, or development of the next generation of engines with insights from complex analyses that could consider parameters like model, engine type, mileage, overall speed, temperature, air pressure, load, services, and more.
- The combination of electric vehicle battery usage data like charging cycles, engine performance, and battery age with contributing factors as the use of the air conditioning to determine if such factors contribute to hazardous battery conditions and for improved battery development.
- Cross-organization collaboration in R&D by the provision of information on all these metrics and more from real-world driving, like engine knock data and even tire pressure.
- Google Cloud’s unified data cloud offering provides a complete platform for building data-driven applications like those from Sibros — from simplified data ingestion, processing, and storage to powerful analytics, AI, ML, and data sharing capabilities — integrated with Google Cloud. With a diverse partner ecosystem and support for multi-cloud, open-source tools and APIs, Google Cloud provides Sibros the portability and the extensibility they need to avoid data lock-in.
“Software has an ever increasing importance in the automotive world, even more so with electric vehicles and new mobility services. Google Cloud is partnering with Sibros to bring their award winning Deep Connected Platform to deliver high frequency, low latency over-the-air software updates, data logging & diagnostics capabilities to our automotive customers, leveraging the security and scale of Google Cloud. This is revolutionizing everything from development cycles to business models and customer relationships.” — Matthias Breunig, Director, Global Automotive Solutions, Google Cloud
Through Built with BigQuery, Google Cloud is helping tech companies like Sibros build innovative applications on Google’s Data Cloud with simplified access to technology, helpful and dedicated engineering support, and joint go-to-market programs.
“Sibros is looking forward to partnering with Google Cloud, which will enable vehicle manufacturers and suppliers to reach the next level in their use of data. Sibros solutions for Deep Data Logging and Updating on the Google Data Cloud, combined with Google BigQuery, will help them to mitigate risks, reduce costs, add innovative products, and introduce value-added use cases.” — Xiaojian Huang, Chief Digital Officer, Software, Sibros
Sibros and Google Cloud are driving Connected Mobility transformation to help our customers accelerate R&D innovation, power efficient operations, and unlock software-defined vehicle use cases with a full stack connected vehicle platform. Click here to learn more about Sibros on Google Cloud.
More Relevant Stories for Your Company
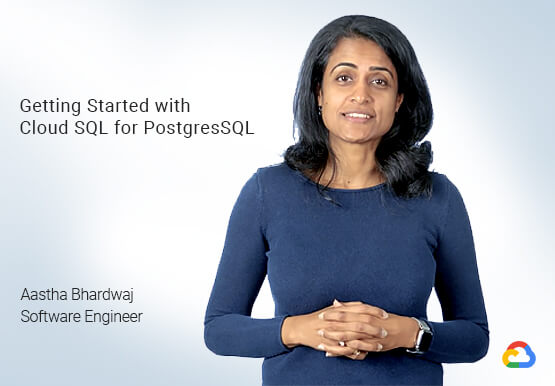
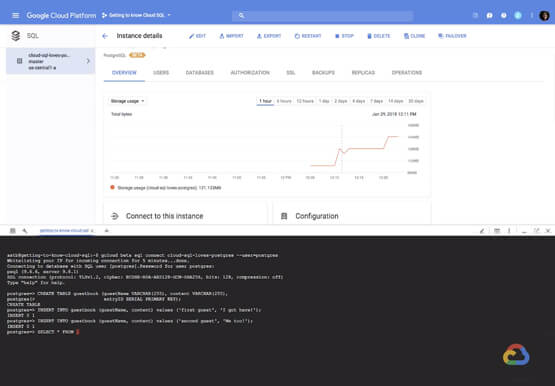

How to Create, Manage and Run SQL Instances in Google Cloud SQL
Database admins and application developers can easily create a database on Google Cloud SQL, which helps manage mundane administrative tasks so that they can focus on what matters the most. From MySQL to Postgres databases, they can spin up an instance in just a few simple steps. An instance can

5 Best Practices for Cloud Cost Optimization
When customers migrate to Google Cloud Platform (GCP), their first step is often to adopt Compute Engine, which makes it easy to procure and set up virtual machines (VMs) in the cloud that provide large amounts of computing power. Launched in 2012, Compute Engine offers multiple machine types, many innovative features, and is available in

Cloud IoT Core Helps Businesses Leverage their IoT Data to Build a Competitive Edge
The ability to gain real-time insights from IoT data can redefine competitiveness for businesses. Intelligence allows connected devices and assets to interact efficiently with applications and with human beings in an intuitive and non-disruptive way. After your IoT project is up and running, many devices will be producing lots of

Neo4J & Google Cloud: Graph Data in Cloud to Address Challenges in FinServ Industry
Over the last decade, financial service organizations have been adopting a cloud-first mindset. According to InformationWeek, lower costs and enhanced scalability were the biggest drivers for cloud adoption in financial services, and cloud-native applications allow access to the latest technology and talent, enabling adopters to rebuild transaction processing systems capable of
