





4551
Of your peers have already watched this video.
3:30 Minutes
The most insightful time you'll spend today!
Strategies for Migrating to the Cloud
What are the technologies that are helping enterprises scale, adapt, and modernize? Are there any strategies that enterprises can adopt for moving to the cloud?
What this webinar to find out the different migration patterns to the cloud and learn how enterprises can choose the right strategies based on their business and technical environments, and the tooling that can help them get there.
4 Steps to a Successful Cloud Migration

3955
Of your peers have already read this article.
2:00 Minutes
The most insightful time you'll spend today!
Digital transformation and migration to the cloud are top priorities for a lot of enterprises. At Google Cloud, we’re working hard to make this journey easier. For example, we recently launched Migrate for Compute Engine and Migrate for Anthos to simplify cloud migration and modernization. These services have helped customers like Cardinal Health perform successful, large-scale migrations to GCP.
But we understand that the migration journey can be daunting. To make things easier, we developed a whitepaper on application migration featuring investigative processes and advice to help you design an effective migration and modernization strategy. This guide outlines the four basic steps you need to follow to migrate successfully and efficiently:
- Build an inventory of your applications and infrastructure: Understanding how many items, such as applications and hardware appliances, exist in your current environment is an important first step.
- Categorize your applications: Analyze the characteristics of all of your applications and evaluate them across two dimensions: migration to cloud, and modernization.
- Decide whether or not to migrate an application to the cloud: Not all applications should move to the cloud quite yet. The whitepaper lists the questions to ask to determine whether or not to migrate a given application.
- Pick your migration strategy: For the applications you decided to migrate, decide on your ideal strategy—pure lift and shift, containers, cloud managed services, or a combination thereof.
There’s a lot to consider when you start thinking about digital transformation, and every cloud modernization project has its nuances and unique considerations. The secret to success is understanding the advantages and disadvantages of the options at your disposal, and weighing them against what you want to transform and why. To learn how to migrate and modernize your applications with Google Cloud, download this whitepaper.
Regulatory-induced Challenges Create Hurdles to Cloud Adoption for Financial Services Firms

3344
Of your peers have already read this article.
2:30 Minutes
The most insightful time you'll spend today!
The financial services industry is evolving at a rapid pace, with shifting consumer expectations, new technologies, and developing regulatory requirements. Financial services firms need the right technology to help them stay agile and prepare for the future.
The cloud is a key point of leverage for firms looking to improve performance across a broad range of activities. Moving to the public cloud can advance operational resiliency, improve staff productivity, increase regulatory compliance and enhance business model innovation.
However, there are a number of financial services companies that are still hesitant in their cloud journeys. The barriers to adoption vary, from the complexity of legacy systems, to trust and skills gaps, regulatory uncertainty, and fragmentation of compliance requirements. Although many companies have embraced the benefits of cloud technology, more robust cloud adoption—especially around core back-office functions—will require additional facilitation, including through regulatory harmonization and streamlining.
A new comprehensive study on cloud adoption in financial services
To better understand the challenges and opportunities of cloud adoption in financial services Google Cloud, together with the Harris Poll, surveyed more than 1,300 leaders from the financial services industry across the United States, Canada, France, Germany, United Kingdom, Hong Kong, Japan, Singapore and Australia.
There were five noteworthy takeaways from the study:
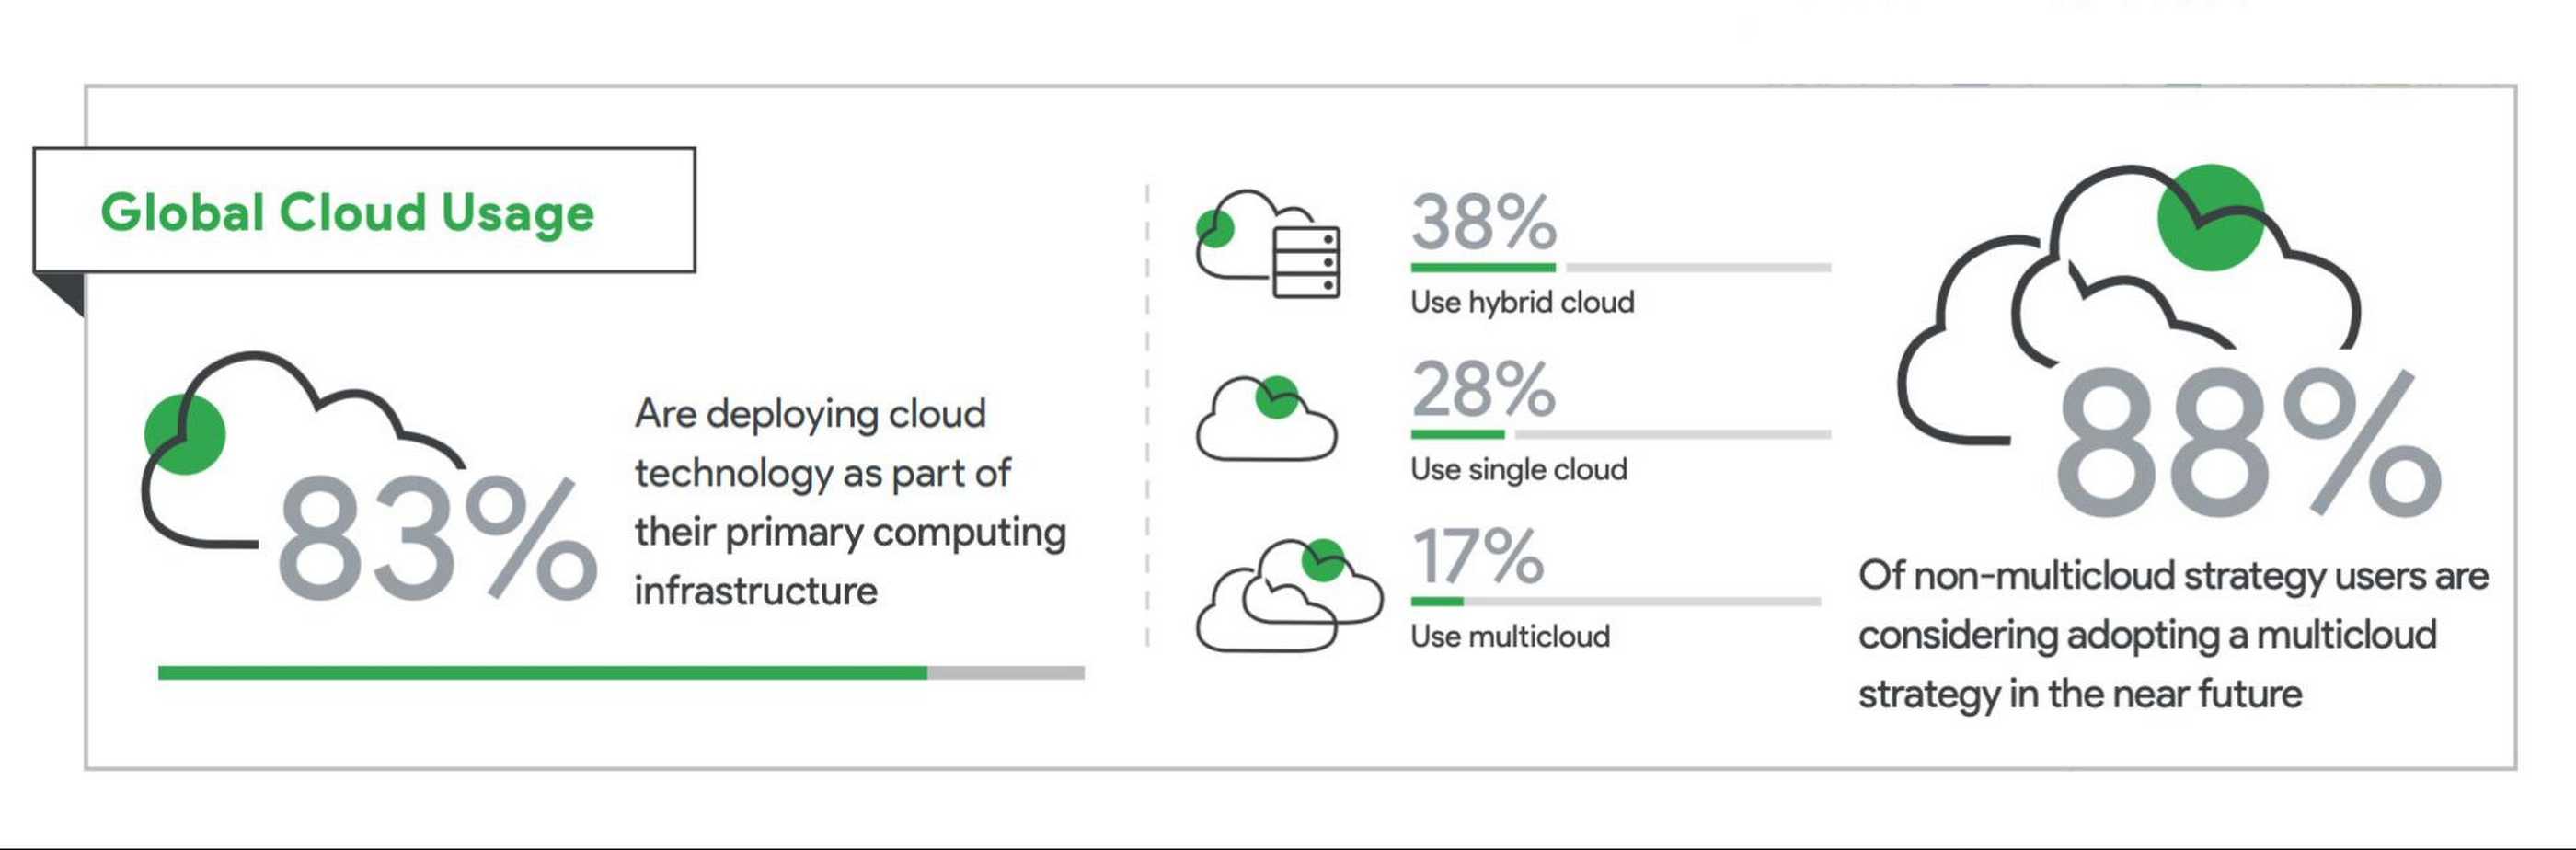
1. A vast majority of financial services companies are already using some form of public cloud. A large number of surveyed financial services companies (83%) report they are deploying cloud technology as part of their primary computing infrastructures. Of those using cloud technology, the most popular architecture of choice is hybrid cloud (38%), followed by single cloud (28%), and multicloud (17%). Notably, of respondents without a multicloud deployment, 88% reported they are considering adopting a multicloud strategy in the next 12 months.
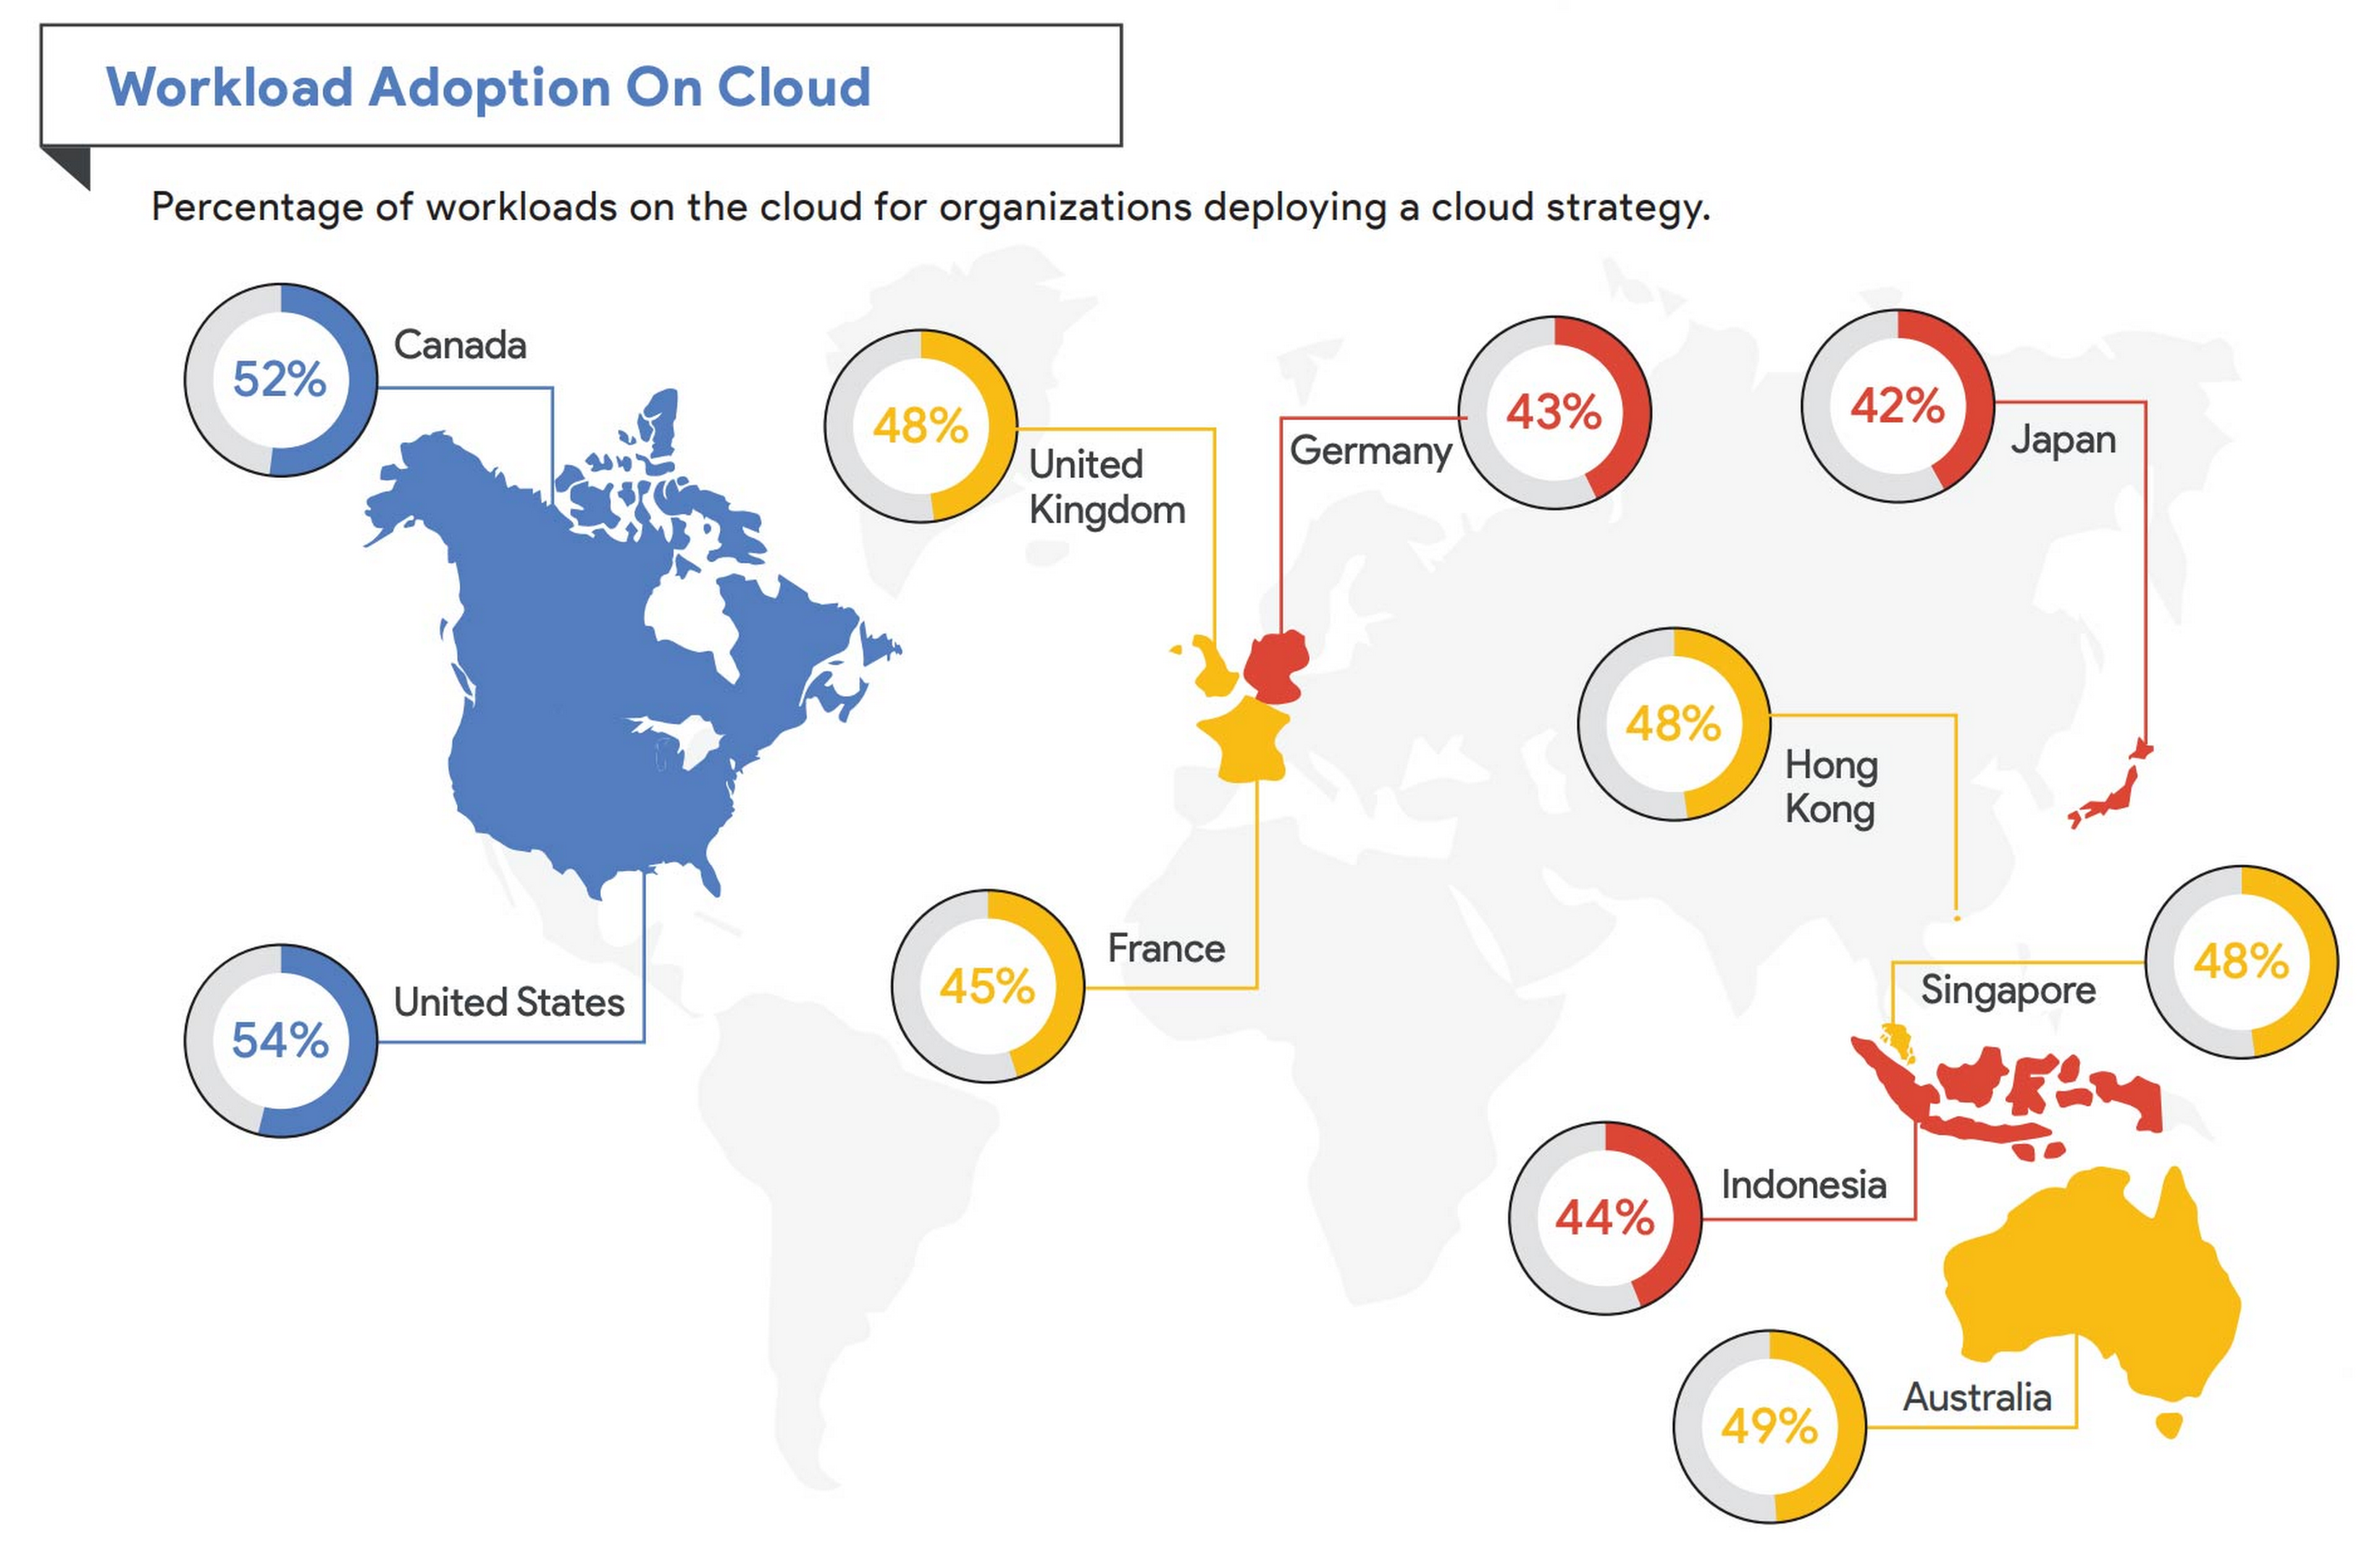
2. Financial services institutions in North America are leading in cloud adoption. Of the financial services companies who are implementing a cloud strategy, the highest levels of cloud workload adoption were reported in North America, with institutions in the U.S. (54%) and Canada (52%) leading the way. The lowest level of cloud adoption was reported in Japan (42%).
3. As financial services companies continue to use the cloud, more core functionalities can and will be migrated. While many financial services companies have migrated substantial workloads to the cloud, the industry is far from full adoption when it comes to core, back-office workloads. Of financial services companies currently using a majority cloud strategy in the United States, for example, only half (54%) of their workloads are fully deployed in the cloud. Data and IT security (74%), regulatory reporting (57%), and fraud detection and prevention (57%) rank among the highest workload adoption. Core underwriting activity (40%) and data reconciliation (48%) ranked lowest. Across Europe, cloud usage for core activities like underwriting also scored low with the UK listing only 30% adoption.
4. Among respondents, there is a very strong positive perception of the potential for cloud technology to assist in business operations and regulatory compliance. Nearly all respondents (>88%) agreed that cloud adoption can:
- help adapt to changing customer behaviors and expectations,
- enhance operational resilience,
- support the creation of innovative new products and services,
- enhance financial services institutions’ data security capabilities, and
- better connect siloed legacy software infrastructure within financial services institutions.
5. Certain regulator-induced challenges, including the complexity of sectorial compliance frameworks and fragmentation, create hurdles to cloud adoption for financial services companies. While 88% of respondents had a positive view of current regulatory efforts to provide guidance and clarity for cloud implementation, the results showed that more needs to be done to facilitate adoption. Most respondents (84%) agree that regulatory reviews and approvals take too long because of regulatory fragmentation across regulatory bodies. And 78% say that regulatory uncertainty over the use of public cloud prevents their organizations from adopting cloud technologies that would otherwise provide benefit to them. Additionally, a third of all on-premises respondents (38%) say that the large investment of resources for the regulatory approval process is a reason why they’re not using cloud services.
“While many banks have already deployed hybrid cloud environments, others are still in various stages of planning and deploying,” said Jerry Silva, research vice president for IDC Financial Insights. “Clearly, hybrid infrastructure is a reality, and financial institutions must focus not only on leveraging the modern infrastructure model to gain efficiencies, resilience and agility, but also on taking the necessary steps to manage such environments, including the security and compliance of cloud services.”
Future recommendations for financial services regulators
Financial services firms should continue to maximize the potential of technology by migrating more core workloads to the cloud, and actively considering multicloud and hybrid-cloud strategies. Such strategies enhance resiliency of existing IT infrastructure and reduce concerns over vendor lock-in.
The research also points to steps that regulators could take to provide additional clarity and guidance, such as aligning regulatory reviews across agencies to avoid fragmentation; developing regulatory “safe harbors” for cloud adopters based on adherence to accepted standards and best practices; training regulatory staff on emerging tech; and advancing data reporting requirements via cloud and related technologies.
In the past few years, many regulators across the globe have taken a robust approach to rationalizing rules and guidance to cloud adoption in the financial sector, which has helped significantly stimulate adoption. But further assurances and harmonization of best practices around supervision is needed to advance risk-based and secure digital innovation.
At Google Cloud, we’re committed to working with financial services customers and regulators to provide them with controls and assurances on risk management, data locality, transparency, and compliance. We are constantly engaging with regulators to share information, respond to their considerations and concerns, and address questions in the interest of transparency and building trust.
To learn more about these findings and more, download our infographic and our full report.
Research methodology
The survey was conducted online by the Harris Poll on behalf of Google Cloud, from December 7, 2020, to January 4, 2021, among 1,363 senior executives in France (n=113), Germany (n=178), the UK (n=192), Hong Kong (n=99), Indonesia (n=100), Japan (n=142), Singapore (n=71), Australia (n=134), Canada (134), and the United States (n=200) who are employed full-time, part-time, or self-employed whose main functional role is in risk/compliance or IT at a company in the banking, finance, or financial services industry with a title of director level or higher. The data in each country were weighted by the number of employees to bring them into line with actual company size proportions in the population. A global post-weight was applied to ensure equal weight of each country in the global total.
10171
Of your peers have already watched this video.
1:00 Minutes
The most insightful time you'll spend today!
Predict User Churn on Gaming Apps with Google Analytics Data using BigQuery ML
User retention can be a major challenge for mobile game developers. According to the Mobile Gaming Industry Analysis in 2019, most mobile games only see a 25% retention rate for users after the first day. To retain a larger percentage of users after their first use of an app, developers can take steps to motivate and incentivize certain users to return. But to do so, developers need to identify the propensity of any specific user returning after the first 24 hours.
In this blog post, we will discuss how you can use BigQuery ML to run propensity models on Google Analytics 4 data from your gaming app to determine the likelihood of specific users returning to your app.
You can also use the same end-to-end solution approach in other types of apps using Google Analytics for Firebase as well as apps and websites using Google Analytics 4. To try out the steps in this blogpost or to implement the solution for your own data, you can use this Jupyter Notebook.
Using this blog post and the accompanying Jupyter Notebook, you’ll learn how to:
- Explore the BigQuery export dataset for Google Analytics 4
- Prepare the training data using demographic and behavioural attributes
- Train propensity models using BigQuery ML
- Evaluate BigQuery ML models
- Make predictions using the BigQuery ML models
- Implement model insights in practical implementations
Google Analytics 4 (GA4) properties unify app and website measurement on a single platform and are now default in Google Analytics. Any business that wants to measure their website, app, or both, can use GA4 for a more complete view of how customers engage with their business. With the launch of Google Analytics 4, BigQuery export of Google Analytics data is now available to all users. If you are already using a Google Analytics 4 property, you can follow this guide to set up exporting your GA data to BigQuery.
Once you have set up the BigQuery export, you can explore the data in BigQuery. Google Analytics 4 uses an event-based measurement model. Each row in the data is an event with additional parameters and properties. The Schema for BigQuery Export can help you to understand the structure of the data.
In this blogpost, we use the public sample export data from an actual mobile game app called “Flood It!” (Android, iOS) to build a churn prediction model. But you can use data from your own app or website.
Here’s what the data looks like. Each row in the dataset is a unique event, which can contain nested fields for event parameters.
SELECT *FROM `firebase-public-project.analytics_153293282.events_*`TABLESAMPLE SYSTEM (1 PERCENT)

This dataset contains 5.7M events from over 15k users.
SELECTCOUNT(DISTINCT user_pseudo_id) as count_distinct_users,COUNT(event_timestamp) as count_eventsFROM`firebase-public-project.analytics_153293282.events_*

Our goal is to use BigQuery ML on the sample app dataset to predict propensity to user churn or not churn based on users’ demographics and activities within the first 24 hours of app installation.

In the following sections, we’ll cover how to:
- Pre-process the raw event data from GA4
- Identify users & the label feature
- Process demographic features
- Process behavioral features
- Train classification model using BigQuery ML
- Evaluate the model using BigQueryML
- Make predictions using BigQuery ML
- Utilize predictions for activation
Pre-process the raw event data
You cannot simply use raw event data to train a machine learning model as it would not be in the right shape and format to use as training data. So in this section, we’ll go through how to pre-process the raw data into an appropriate format to use as training data for classification models.
This is what the training data should look like for our use case at the end of this section:

Notice that in this training data, each row represents a unique user with a distinct user ID (user_pseudo_id).
Identify users & the label feature
We first filtered the dataset to remove users who were unlikely to return the app anyway. We defined these ‘bounced’ users as ones who spent less than 10 mins with the app. Then we labeled all remaining users:
- churned: No event data for the user after 24 hours of first engaging with the app.
- returned: The user has at least one event record after 24 hours of first engaging with the app.
For your use case, you can have a different definition of bounce and churning. Also you can even try to predict something else other than churning, e.g.:
- whether a user is likely to spend money on in-game currency
- likelihood of completing n-number of game levels
- likelihood of spending n amount of time in-game etc.
In such cases, label each record accordingly so that whatever you are trying to predict can be identified from the label column.
From our dataset, we found that ~41% users (5,557) bounced. However, from the remaining users (8,031), ~23% (1,883) churned after 24 hours:
SELECTbounced,churned,COUNT(churned) as count_usersFROMbqmlga4.returningusersGROUP BY 1,2ORDER BY bounced

To create these bounced and churned columns, we used the following snippet of SQL code.
...#churned = 1 if last_touch within 24 hr of app installation, else 0IF (user_last_engagement < TIMESTAMP_ADD(user_first_engagement,INTERVAL 24 HOUR),1,0 ) AS churned,#bounced = 1 if last_touch within 10 min, else 0IF (user_last_engagement <= TIMESTAMP_ADD(user_first_engagement,INTERVAL 10 MINUTE),1,0 ) AS bounced,...
You can view the Jupyter Notebook for the full query used for materializing the bounced and churned labels.
Process demographic features
Next, we added features both for demographic data and for behavioral data spanning across multiple columns. Having a combination of both demographic data and behavioral data helps to create a more predictive model.
We used the following fields for each user as demographic features:
geo.countrydevice.operating_systemdevice.language
A user might have multiple unique values in these fields — for example if a user uses the app from two different devices. To simplify, we used the values from the very first user engagement event.
CREATE OR REPLACE VIEW bqmlga4.user_demographics AS (WITH first_values AS (SELECTuser_pseudo_id,geo.country as country,device.operating_system as operating_system,device.language as language,ROW_NUMBER() OVER (PARTITION BY user_pseudo_id ORDER BY event_timestamp DESC) AS row_numFROM `firebase-public-project.analytics_153293282.events_*`WHERE event_name="user_engagement")SELECT * EXCEPT (row_num)FROM first_valuesWHERE row_num = 1 #first engagement);
Process behavioral features
There is additional demographic information present in the GA4 export dataset, e.g. app_info, device, event_params, geo etc. You may also send demographic information to Google Analytics through each hit via user_properties. Furthermore, if you have first-party data on your own system, you can join that with the GA4 export data based on user_ids.
To extract user behavior from the data, we looked into the user’s activities within the first 24 hours of first user engagement. In addition to the events automatically collected by Google Analytics, there are also the recommended events for games that can be explored to analyze user behavior. For our use case, to predict user churn, we counted the number of times the follow events were collected for a user within 24 hours of first user engagement:
user_engagementlevel_start_quickplaylevel_end_quickplaylevel_complete_quickplaylevel_reset_quickplaypost_scorespend_virtual_currencyad_rewardchallenge_a_friendcompleted_5_levelsuse_extra_steps
The following query shows how these features were calculated:
WITHevents_first24hr AS (SELECTe.*FROM`firebase-public-project.analytics_153293282.events_*` eJOINbqmlga4.returningusers rONe.user_pseudo_id = r.user_pseudo_idWHERETIMESTAMP_MICROS(e.event_timestamp) <= r.ts_24hr_after_first_engagement)SELECTuser_pseudo_id,SUM(IF(event_name = 'user_engagement', 1, 0)) AS cnt_user_engagement,# ... repeated for all behavior data ...SUM(IF(event_name = 'use_extra_steps', 1, 0)) AS cnt_use_extra_steps,FROMevents_first24hrGROUP BY1
View the notebook for the query used to aggregate and extract the behavioral data. You can use different sets of events for your use case. To view the complete list of events, use the following query:
SELECTevent_name,COUNT(event_name) as event_countFROM`firebase-public-project.analytics_153293282.events_*`GROUP BY 1ORDER BYevent_count DESC
After this we combined the features to ensure our training dataset reflects the intended structure. We had the following columns in our table:
- User ID:
user_pseudo_id
- Label:
churned
- Demographic features
countrydevice_osdevice_language
- Behavioral features
cnt_user_engagementcnt_level_start_quickplaycnt_level_end_quickplaycnt_level_complete_quickplaycnt_level_reset_quickplaycnt_post_scorecnt_spend_virtual_currencycnt_ad_rewardcnt_challenge_a_friendcnt_completed_5_levelscnt_use_extra_stepsuser_first_engagement
At this point, the dataset was ready to train the classification machine learning model in BigQuery ML. Once trained, the model will output a propensity score between churn (churned=1) or return (churned=0) indicating the probability of a user churning based on the training data.
Train classification model
When using the CREATE MODEL statement, BigQuery ML automatically splits the data between training and test. Thus the model can be evaluated immediately after training (see the documentation for more information).
For the ML model, we can choose among the following classification algorithms where each type has its own pros and cons:

Often logistic regression is used as a starting point because it is the fastest to train. The query below shows how we trained the logistic regression classification models in BigQuery ML.
CREATE OR REPLACE MODEL bqmlga4.churn_logregTRANSFORM(EXTRACT(MONTH from user_first_engagement) as month,EXTRACT(DAYOFYEAR from user_first_engagement) as julianday,EXTRACT(DAYOFWEEK from user_first_engagement) as dayofweek,EXTRACT(HOUR from user_first_engagement) as hour,* EXCEPT(user_first_engagement, user_pseudo_id))OPTIONS(MODEL_TYPE="LOGISTIC_REG",INPUT_LABEL_COLS=["churned"]) ASSELECT*FROMbqmlga4.train
We extracted month, julianday, and dayofweek from datetimes/timestamps as one simple example of additional feature preprocessing before training. Using TRANSFORM() in your CREATE MODEL query allows the model to remember the extracted values. Thus, when making predictions using the model later on, these values won’t have to be extracted again. View the notebook for the example queries to train other types of models (XGBoost, deep neural network, AutoML Tables).
Evaluate model
Once the model finished training, we ran ML.EVALUATE to generate precision, recall, accuracy and f1_score for the model:
SELECT*FROMML.EVALUATE(MODEL bqmlga4.churn_logreg)

The optional THRESHOLD parameter can be used to modify the default classification threshold of 0.5. For more information on these metrics, you can read through the definitions on precision and recall, accuracy, f1-score, log_loss and roc_auc. Comparing the resulting evaluation metrics can help to decide among multiple models.Furthermore, we used a confusion matrix to inspect how well the model predicted the labels, compared to the actual labels. The confusion matrix is created using the default threshold of 0.5, which you may want to adjust to optimize for recall, precision, or a balance (more information here).
SELECTexpected_label,_0 AS predicted_0,_1 AS predicted_1FROMML.CONFUSION_MATRIX(MODEL bqmlga4.churn_logreg)

This table can be interpreted in the following way:

Make predictions using BigQuery ML
Once the ideal model was available, we ran ML.PREDICT to make predictions. For propensity modeling, the most important output is the probability of a behavior occurring. The following query returns the probability that the user will return after 24 hrs. The higher the probability and closer it is to 1, the more likely the user is predicted to return, and the closer it is to 0, the more likely the user is predicted to churn.
SELECTuser_pseudo_id,returned,predicted_returned,predicted_returned_probs[OFFSET(0)].prob as probability_returnedFROMML.PREDICT(MODEL bqmlga4.churn_logreg,(SELECT * FROM bqmlga4.train)) #can be replaced with a proper test dataset
Utilize predictions for activation
Once the model predictions are available for your users, you can activate this insight in different ways. In our analysis, we used user_pseudo_id as the user identifier. However, ideally, your app should send back the user_id from your app to Google Analytics. In addition to using first-party data for model predictions, this will also let you join back the predictions from the model into your own data.
- You can import the model predictions back into Google Analytics as a user attribute. This can be done using the Data Import feature for Google Analytics 4. Based on the prediction values you can Create and edit audiences and also do Audience targeting. For example, an audience can be users with prediction probability between 0.4 and 0.7, to represent users who are predicted to be “on the fence” between churning and returning.
- For Firebase Apps, you can use the Import segments feature. You can tailor user experience by targeting your identified users through Firebase services such as Remote Config, Cloud Messaging, and In-App Messaging. This will involve importing the segment data from BigQuery into Firebase. After that you can send notifications to the users, configure the app for them, or follow the user journeys across devices.
- Run targeted marketing campaigns via CRMs like Salesforce, e.g. send out reminder emails.
You can find all of the code used in this blogpost in the Github repository:
What’s next?
Continuous model evaluation and re-training
As you collect more data from your users, you may want to regularly evaluate your model on fresh data and re-train the model if you notice that the model quality is decaying.
Continuous evaluation—the process of ensuring a production machine learning model is still performing well on new data—is an essential part in any ML workflow. Performing continuous evaluation can help you catch model drift, a phenomenon that occurs when the data used to train your model no longer reflects the current environment.
To learn more about how to do continuous model evaluation and re-train models, you can read the blogpost: Continuous model evaluation with BigQuery ML, Stored Procedures, and Cloud Scheduler
More resources
If you’d like to learn more about any of the topics covered in this post, check out these resources:
- BigQuery export of Google Analytics data
- BigQuery ML quickstart
- Events automatically collected by Google Analytics 4
- Qwiklabs: Create ML models with BigQuery ML
Or learn more about how you can use BigQuery ML to easily build other machine learning solutions:
- How to build demand forecasting models with BigQuery ML
- How to build a recommendation system on e-commerce data using BigQuery ML
Let us know what you thought of this post, and if you have topics you’d like to see covered in the future! You can find us on Twitter at @polonglin and @_mkazi_.Thanks to reviewers: Abhishek Kashyap, Breen Baker, David Sabater Dinter.
Marxent Leverages Google Cloud to Elevate Customer Journeys on Retail Apps with 3D Shopping Experiences

3335
Of your peers have already read this article.
3:00 Minutes
The most insightful time you'll spend today!
As ecommerce for home goods exploded in popularity during COVID, furniture and DIY retailers looked to find new ways to grow online transaction sizes to in-store levels. Shopping for furniture and home improvement projects has always been challenging online. Furniture, kitchen cabinets, fixtures, and appliances become a part of daily life, are challenging to return, and have a low purchase frequency. Once a shopper makes a decision, they tend to live with it for many years. These are visual, tactile, decisions that require measurements, style choices, budgeting, an understanding of available products, and an involved consideration processes. During the pandemic, retailers turned to 3D to enhance these virtual shopping experiences.
Inspiration and visualization cultivate confidence
Our 3D Room Commerce company, Marxent offers 3D visualization and configuration solutions that help retailers sell complex, configurable products online through consumer-facing 3D design and visualization apps. The Marxent 3D Room Planner with HD Renders helps shoppers to visualize how furniture or kitchen cabinet configurations will look in the specific floorplan of their home. Founded in 2011, Marxent envisions a world where buying a dining table or remodeling an entire kitchen is as easy as buying a car from Carvana or ordering dinner through Bite Squad. Our 3D apps create a streamlined inspiration to transaction to advocacy model that cultivates shopper confidence and allows retailers to sell the whole room, not just individual items.
Using Google Cloud as a foundation, we help some of the largest retail and home goods companies in the world provide exceptional customer journeys. We trust Google Cloud because our clients trust us to make it faster and easier for shoppers to buy semi-custom, configurable projects.
Embracing the power of 3D to super-charge ecommerce
It’s inarguable: e-commerce is on the rise. More people than ever before are shopping online for furniture, kitchen cabinets, decking, and other large-scale configurable products.
Customers who design with a retailer, usually buy from them. When shoppers visit stores and showrooms, they find inspiration in merchandised scenes that illustrate how products like sofas, chairs, rugs and lamps work together to accomplish a look. Skilled sales people make suggestions and offer advice on how to put pieces together. They may even work up a quick floor plan to show how multiple items work together in a room. In store, the inspiration phase is intimately tied to consideration and, ultimately, to driving transactions.
By contrast, online shoppers typically start home projects by seeking inspiration and ideas from Pinterest, Instagram and unbranded online image searches. Once they have formed their style preferences, shoppers keep searching to compare products across multiple retailers, plan their project, and put together a final budget.
To own the whole project sale, retailers need to own the entire inspiration to transaction to advocacy journey. With both online and in-store applications, Retailers leverage Marxent’s 3D Room Planner app to build shopper confidence, capture the whole room sale and win the customer over.
https://youtube.com/watch?v=_svOdVvX5LA%3Fenablejsapi%3D1%26
PRE-RENDERED MID-POLY 3D SCENE

POST-RENDERED MID-POLY 3D SCENE – This is a slightly different angle of the same room that has been rendered into a “Raw Render” (rendered in under 2 minutes).

Through Marxent’s 3D Room Commerce solution, users experience a cyclical inspiration to transaction to advocacy journey. It starts with shoppers viewing inspirational images and media online. Using Marxent’s applications, they can design directly from inspirational images to create a custom, configured space without any product catalog knowledge. Shoppers can visualize the products they love together and in the context of their own floor plan instead of navigating product pages and wondering if items will work together.
Then, they can add the whole room to a shopping cart with a single click. While this virtual experience does lead to a transaction, it also allows users to save, collaborate on, and share the spaces they’ve created. They become advocates by sharing their projects on social media, starting the inspirational content cycle again.
Putting an end to manual operations
To deliver renders at scale, Marxent needed to update their cloud render solution. Initially, our 3D Art team operated a manual on-premise render fleet. However, this required many hours of manual setup, configuration, and operation. We also had to manage expensive graphics servers—bare metal, CPUs, GPUs, RAM, HDD, and more. The only solution was to automate the 3D rendering process and empower end-users to rapidly create their own 3D room renders.
When we were evaluating new solutions, we saw distinct advantages in the Google Cloud Platform that would help them safely and securely scale their business, while strengthening their partnerships with end customers. For example, in moving to Google Cloud, we could automate and scale our rendering process without having to manage fleets of physical servers. We also viewed the platform as an asset due to Google’s secure-by-design infrastructure, agility, data analytics capabilities, and potential for joining the Marketplace.
Creating magical customer experiences that inspire purchase
To provide our customers and shoppers with contextual experiences, Marxent’s applications use mid-poly 3D models that balance speed and realism. These models provide a latency-free, real-time design experience that can be rendered into scenes that are realistic enough to be perceived as photos on social media.
The complex process of rendering these images requires a combination of efficiency, speed, analytics, and consistent performance that Google Cloud provides. When configured with powerful and speedy gaming GPUs, Marxent can provide fast rendering that meets customers and shopper demands. Here’s a look at our HD Renders application.

Before a user can request an HD Render, they must create a room in the Marxent 3D Room Planner. Once requested, Marxent pulls the saved project from the database and kicks off the process with Cloud Pub/Sub. The project loads into a gaming GPU, using the same platform code running when the user first creates the room in the application. It boots up the app in the cloud to load the room.
The code then scours the space and prepares it for rendering, adjusting texture formats, and adding in lighting. After going through the render engine, the project automatically uploads to Cloud Storage. Finally, the user receives a link to the final product. Throughout, Cloud Pub/Sub handles messages ensuring the right event processes are happening, such as rendering success or failure.
Using this process, it’s possible to create dozens of images out of a single scene, trading products in and out of a floor plan by leveraging a complete catalog of content geometries and covers, textures, and finishes.
Utilizing Google Cloud throughout the buying journey
Today, Marxent’s applications power world-class retailers with AR, VR, and 3D commerce experiences. We use cutting-edge graphics hardware to create renderings in less than 2 minutes per screenshot, often much faster. We’re also saving money as we no longer have to manage expensive servers or purchase expensive hardware upfront. Our clients are happier because we have passed on the cost savings to them while now having limitless scaling capabilities to meet demand.
By partnering with Google Cloud, Marxent can confidently offer our customers secure applications built on infrastructure with advanced security tools that support compliance and data confidentiality. Backed by a globally consistent platform, we can also help brands build reliable purchasing experiences across customer touchpoints—without fear of downtime during peak sales periods. This strategic partnership has allowed us to provide a best-in-breed, customer-first experience that our customers demand while providing the reliability that our partners expect.
With customers demanding seamless shopping experiences, Marxent’s 3D technologies open doors to new, easier, more convenient, and more satisfying shopping experiences that empower consumers to buy the right products the first time.
If you want to learn more about how Google Cloud can help your startup, visit our Startup Program application page here and sign up for our monthly startup newsletter to get a peek at our community activities, digital events, special offers, and more.

3585
Of your peers have already downloaded this article
3:30 Minutes
The most insightful time you'll spend today!
Defending the world’s largest network against persistent and constantly evolving cyber threats has driven Google to architect, automate, and develop advanced tools to help keep it ahead. Understanding how Google has built and evolved it’s defenses can help you make smart architectural decisions of your own as you move forward.
- At Google every minute:
- 10 million spam messages are prevented from reaching Gmail customers.
- 694,000 indexed Web pages are scanned for harmful software.
- 7,000 deceitful URLs, executables, and browser extensions that may carry viruses, unwanted content, or phishing attempts are spotted and stopped.
- 6000 instances of unwanted software and nearly 1,000 instances of suspected malware are reported to Chrome users.
- 2 phishing sites and 1 malware site are found and labeled.
Download this e-book to know more about Google’s security at scale.
More Relevant Stories for Your Company

Strengthening Operational Resilience Migrating to Google Cloud
Operational resilience continues to be a key focus for financial services firms. Regulators from around the world are refocusing supervisory approaches on operational resilience to support the soundness of financial firms and the stability of the financial ecosystem. Our new white paper discusses the continuing importance of operational resilience to

Google Cloud & Optiva Partnership Cements the Future of Telecom for Driving Strong Customer Experience
Editor’s note: Coming out of Mobile World Congress 2022, we are excited to share key learnings from our partner ecosystem on how to leverage advancements in 5G technologies to power customer experiences that seamlessly blend our physical and virtual world into one. The original version of this blog was published

EyecareLive Sees a Brighter Future in the Cloud with Enhanced Support
EyecareLive transforms the healthcare ecosystem with Enhanced Support, a support service from the Google Cloud Customer Care portfolio. Telemedicine is now mainstream. It exploded during the COVID-19 pandemic. A 2022 survey by Jones Lang Lasalle (registration required) found that 38% of U.S. patients were using some form of telemedicine. This

Three German Retail Firms Choose Google Cloud to Migrate SAP Workloads for Business Transformation
The retail industry is rapidly evolving, with customers demanding exceptional digital experiences, and retailers adjusting their businesses to be more efficient. With many retailers relying on SAP for critical business functions like digital transactions, finance, supply chains and more, this shift has led them to look for ways to modernize
