





4490
Of your peers have already watched this video.
4:00 Minutes
The most insightful time you'll spend today!
How to Create, Manage and Run SQL Instances in Google Cloud SQL
Database admins and application developers can easily create a database on Google Cloud SQL, which helps manage mundane administrative tasks so that they can focus on what matters the most. From MySQL to Postgres databases, they can spin up an instance in just a few simple steps.
An instance can easily be created in just a few clicks by navigating to Cloud SQL in the GCP console, selecting the database of choice, and naming it and setting a password. Users can configure options like instance size, the number of cores, the amount of memory, and storage amount and type, from the same place. In addition, users can also isolate the database from failures by selecting the high availability option.
Once they click on create, the database instance spins up in just a few minutes. Once the instance is created, all the users would have to do is to connect to the database. Users can connect using Google App Engine, Compute Engine, or Container Engine or from anywhere else by authorizing the IP address or by using the Cloud SQL Proxy.
In just a few clicks and in a matter of minutes, users can easily spin up a database instance and manage routine administrative tasks.
The Fantastic Story of How BMG Enables a Micropayments Strategy So Music Artists Get Paid

7426
Of your peers have already read this article.
3:30 Minutes
The most insightful time you'll spend today!
The music industry is rapidly changing. Only 20 years ago, the availability of music and the infrastructure that was required to make an album a sales success were incredibly complex and expensive. With the decline of physical sales and a fundamental shift to digital, music streaming now accounts for more than half of all sales globally.
At the same time, technology has democratized music-making; in many ways, it has made the musical landscape more diverse. Artists can upload their music with the click of a button. But while it’s easier for creators to share their songs with audiences, getting paid has become more fragmented.
Although music is booming, people no longer buy it outright. Instead, listeners download music digitally or subscribe to streaming services to have their libraries with them at all times. To monetize digital content effectively, artists need to know when, where, and how often their songs are played on each service. To help them navigate this complicated royalties landscape and maximize their profits, Berlin-based international music company BMG provides customized, transparent, and fair services to songwriters and artists.
With publishing and recording divisions under one roof, the subsidiary of international media giant Bertelsmann works with both emerging artists and established stars, including John Legend, Kylie Minogue, Mick Jagger, and Keith Richards. With the MyBMG web and mobile application, clients can view and analyze their royalty details in real time and collect payment. When a new record is released, BMG uses data to maximize its impact and revenue for its creators.
“We make sure that everyone who uses our clients’ music knows who needs to be paid the associated royalties, then we collect these royalties and share them out quickly and transparently,” explains Sebastian Hentzschel, Chief Information Officer at BMG. “When our artists release new music, we make sure that it’s marketed and promoted effectively around the world.”
“We needed a scalable solution for our royalty workloads that was intuitive for our developers. We also wanted a partner, not a client-vendor relationship. With autoscaling via BigQuery, excellent customer support, and a clean and simple user interface, Google Cloud ticks every box for us.”
—Gaurav Mittal, Vice President Group Technology, BMG
Getting up to speed with a new way of paying artists
In this digital world, artists aren’t just paid every time a fan buys an album—they’re paid a small amount, or royalty, for each song downloaded or streamed by a listener. So, when the industry shifted to digital, the volume of data that BMG needed to handle grew exponentially. “One CD sale is equivalent to about 1,500 streamed songs or plays,” says Gaurav Mittal, Vice President Group Technology at BMG. “That means IT departments have to process 1,500 times the amount of data to calculate payments for artists, and this makes scalable micropayment processing very important.”
Until 2019, BMG’s infrastructure was entirely hosted on-premises. Hardware limitations made it challenging to scale on-demand, making it harder to handle the data peaks that royalty processing can bring. “With our on-premises infrastructure, we were going to hit a ceiling in a few years,” says Gaurav. “We still managed to process royalty payments for our clients, but it was increasingly time consuming and expensive. To keep focusing on our clients, rather than our infrastructure, we decided to migrate to Google Cloud.”
From the outset, Gaurav and his team had a clear vision for the partnership: “Most importantly, we needed a scalable solution for our royalty workloads that was intuitive for our developers. We also wanted a partner, not a client-vendor relationship,” he says. “With autoscaling via BigQuery, excellent customer support, and a clean and simple user interface, Google Cloud ticks every box for us.”
Keeping artists happy with business-as-usual payouts during migration
To move applications to the cloud while keeping payment cycles on track for its artists, BMG teamed up with Google Cloud partner Rackspace Technology. “We selected Rackspace Technology because it combines strong technical muscle and a global footprint, with the customer service of a local boutique firm,“ shares Gaurav.
BMG’s own technology team put together the outline for the Google Cloud architecture, which they passed on to Rackspace Technology for optimizations and the ultimate stamp of approval. Whenever Gaurav and his developers needed support, Rackspace Technology was ready to go. “So far, we’ve migrated 17 applications successfully, and Rackspace Technology has been 100% spot-on with each suggestion,” says Gaurav. “I can’t recall a single flaw in a Rackspace Technology-approved architecture, and that really says something.”
When BMG began its migration in August 2019, the team developed an ambitious two-year plan. Only 14 months later, however, the project is more than 75% complete. Among the solutions that BMG is using today are Cloud Storage to securely store 130 TB of data, and Cloud SQL as its standard database technology. The web applications run on Compute Engine, App Engine, and Google Kubernetes Engine.
“After successfully moving a few applications, it was clear that with the strong teamwork of BMG and Rackspace Technology, together with the ease of use of Google Cloud, we could speed up the project without sacrificing quality,” says Gaurav. “We’re set to complete our migration six months before schedule, helping us to quickly move out of our hybrid environment.”
“Our income-tracking teams are very savvy on the data, and the simplicity of Google Cloud empowers them to self-serve analytics, rather than wait for IT. Our teams are much more productive.”
—Gaurav Mittal, Vice President Group Technology at BMG
Royalty reporting and processing with BigQuery and Dataproc
So far, all of BMG’s critical workloads are up and running on Google Cloud. Royalty calculations, for example, which require incredible processing power and the collection of many micropayments to ensure full and timely payout, run entirely on Dataproc with output stored on BigQuery for downstream integration and reporting.
Enabling more harmonious workflows through self-serve analytics
As the new beating heart of BMG’s royalty reporting, BigQuery changed the rhythm of collaboration company-wide. In the past, income tracking teams had to contact IT departments if they needed deeper data insights for their work. By integrating Data Catalog with BigQuery, BMG has made the data more accessible to all teams. This helps them detect missing income and new revenue streams independently, maximizing profits for artists.
“Our income-tracking teams are very savvy on the data, and the simplicity of Google Cloud empowers them to self-serve analytics, rather than wait for IT,” says Gaurav. “Our teams are much more productive.”
“Google Cloud enables us to be more client focused and deliver better features faster. We believe it’s just the beginning. We offer rights and royalty services for music publishing, recorded music, neighboring rights, and books. Without scalability limitations, it’s absolutely conceivable to offer our platform as a service to other companies or industries, such as gaming. Google Cloud has opened a world of possibilities.”
—Sebastian Hentzschel, Chief Information Officer, BMG
With a leaner IT environment, BMG can focus its effort on the needs of its clients. Beyond improvements in royalty processing, it can concentrate on app development, releasing new features and enhancements more frequently. By hosting applications on Google Kubernetes Engine, App Engine, and Compute Engine, BMG has built a CI/CD pipeline with automated deployments and testing to significantly speed up workflows.
“In our old system, it could take several weeks to set up an environment,” says Gaurav. “With Google Kubernetes Engine, any of our developers can complete the process in a few clicks. Having that autonomy makes our developers more motivated and self-driven.”
“Google Cloud enables us to be more client focused and deliver better features faster,” adds Sebastian. “We believe it’s just the beginning. We offer rights and royalty services for music publishing, recorded music, neighboring rights, and books. Without scalability limitations, it’s absolutely conceivable to offer our platform as a service to other companies or industries, such as gaming. Google Cloud has opened a world of possibilities.”
With the migration almost complete, BMG is looking forward to its next technology project. It plans to leverage AutoML to further scale and automate royalty tracking with machine learning. On the marketing side, advanced analytics will help BMG determine the effectiveness of promotional campaigns around the world, further increasing profits for artists. By connecting Google Data Studio to BigQuery, BMG will increase the quality of its analyses, helping musicians better understand the reach of their music around the world.
In the end, Gaurav shares, helping musicians is what it all comes down to. “We’re a new kind of music company because we build our services around our artist, songwriter, and publisher clients, not the other way around,” he says. “Google Cloud is helping us maintain strong relationships with our clients, and that’s music to our ears.”
Analytics Hub for Secure Data Sharing and Analytics Unlocks True Data Value and Insights

6729
Of your peers have already read this article.
2:30 Minutes
The most insightful time you'll spend today!
Customers tell us that sharing and exchanging data with other organizations is a critical element of their analytics strategy, but it’s hamstrung by unreliable data and processes, and only getting harder with security threats and privacy regulations on the rise.
Furthermore, traditional data sharing techniques use batch data pipelines that are expensive to run, create late arriving data, and can break with any changes to the source data. They also create multiple copies of data, which brings unnecessary costs and can bypass data governance processes. These techniques do not offer features for data monetization, such as managing subscriptions and entitlements. Altogether, these challenges mean that organizations are unable to realize the full potential of transforming their business with shared data.
To address these limitations, we are introducing Analytics Hub, a new fully managed service, available in Q3, in preview, that helps you unlock the value of data sharing, leading to new insights and increased business value. With Analytics Hub you get:
- A rich data ecosystem by publishing and subscribing to analytics-ready datasets.
- Control and monitoring over how your data is being used, because data is shared in one place.
- A self-service way to access valuable and trusted data assets, including data provided by Google. For example, a unique dataset from Google Search Trends will be available, that you can query and combine with your own data.
- An easy way to monetize your data assets without the overhead of building and managing the infrastructure.
Built on a decade of cross-organizational sharing
While Analytics Hub is a new service, it builds on BigQuery, Google’s petabyte-scale, serverless cloud data warehouse. BigQuery’s unique architecture provides separation between compute and storage, enabling data publishers to share data with as many subscribers as you want without having to make multiple copies of your data. With BigQuery, there are no servers to deploy or manage, which means that data consumers get immediate value from shared data. Data can be provided and consumed in real-time using the streaming capabilities of BigQuery and you can leverage the built in machine learning, geospatial, and natural language capabilities of BigQuery or take advantage of the native business intelligence support with tools like Looker, Google Sheets, and Data Studio.
BigQuery has had cross-organizational, in-place data sharing capabilities since it was introduced in 2010. We took a look at usage metrics in BigQuery and found that over a 7 day period in April, we had over 3,000 different organizations sharing over 200 petabytes of data. These numbers don’t include data sharing between departments within the same organization.
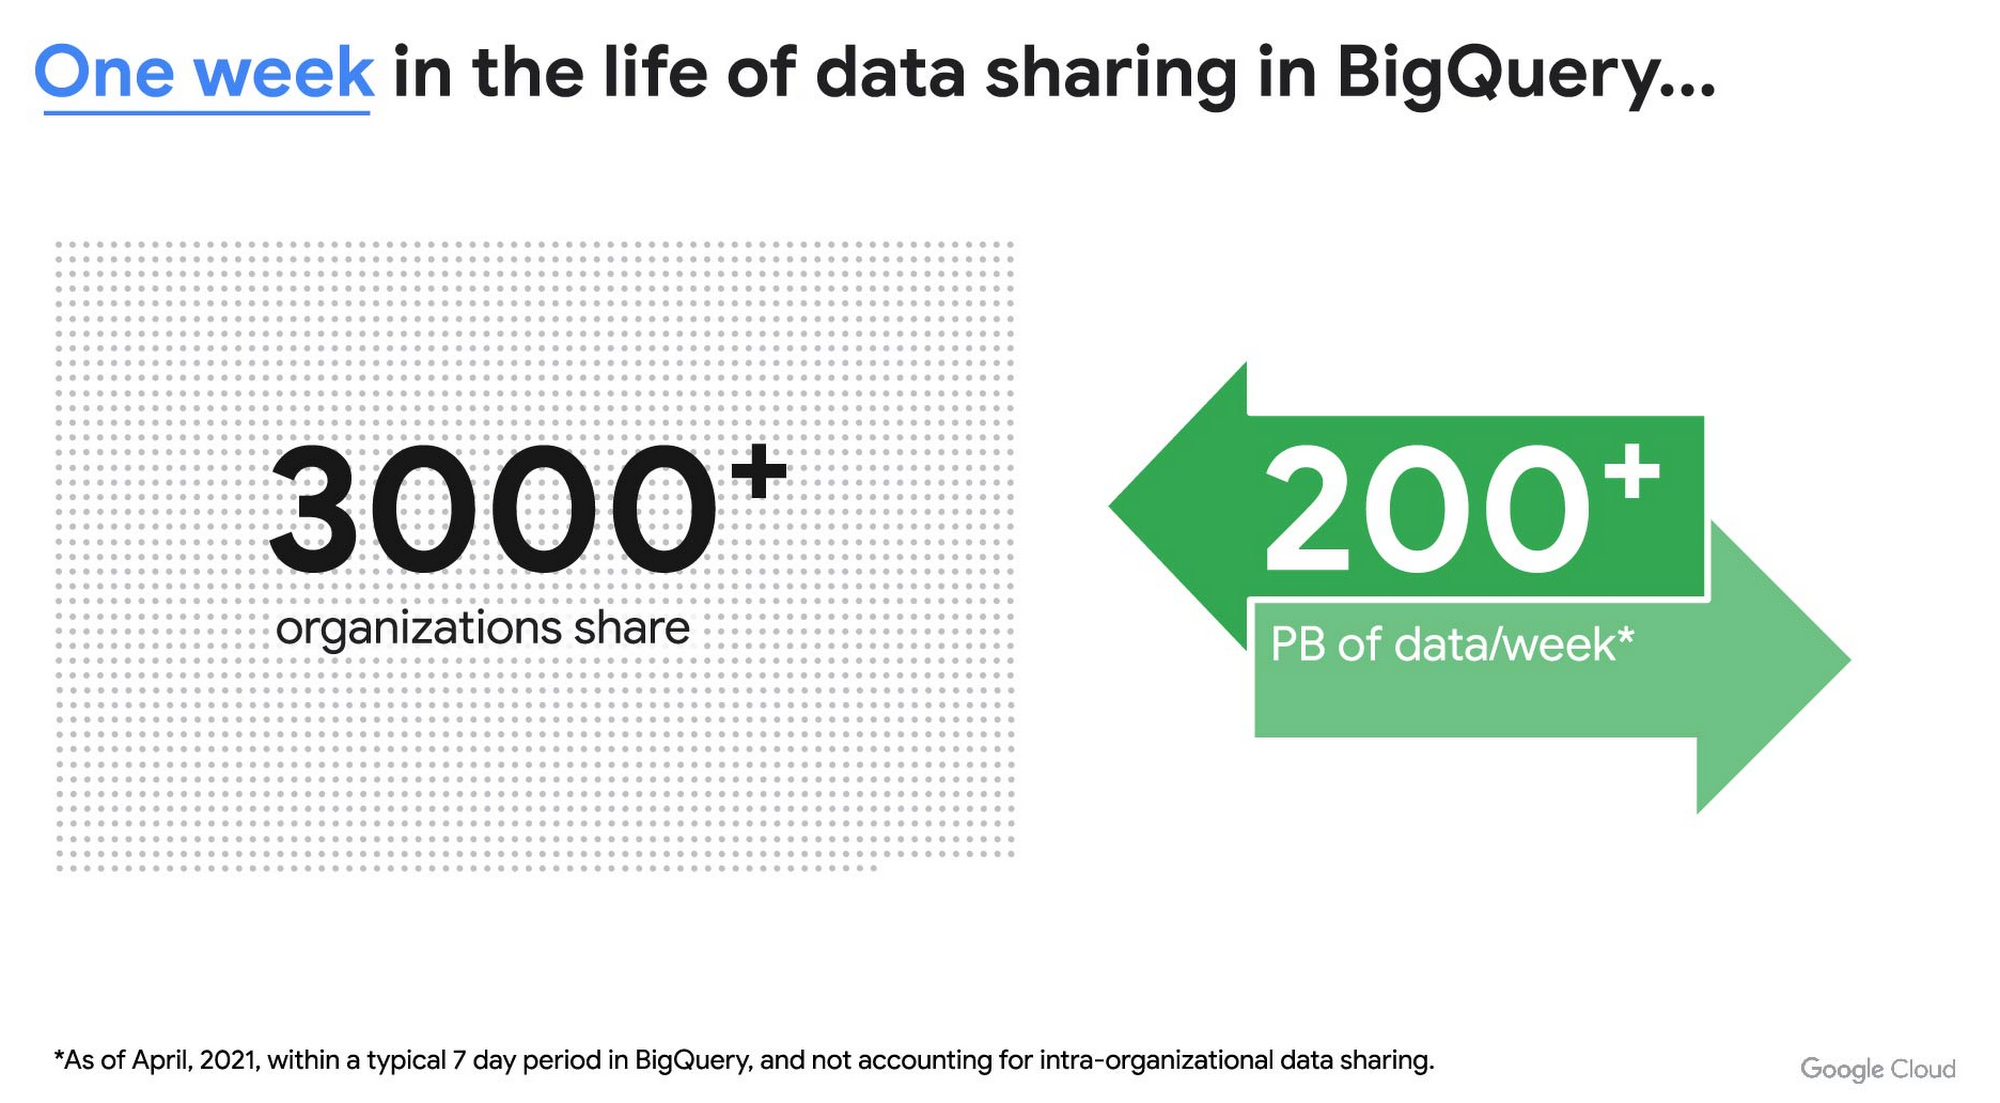
As you can see, data sharing in BigQuery is already popular. But we want to make it easier and even more scalable.
Raising the bar on data sharing
To make data sharing easier and more scalable in BigQuery, Analytics Hub introduces the concepts of shared datasets and exchanges. As a data publisher, you create shared datasets that contain the views of data that you want to deliver to your subscribers. Next, you create exchanges, which are used to organize and secure shared datasets. By default, exchanges are completely private, which means that only the users and groups that you give access to can view or subscribe to the data. You can also create internal exchanges or leverage public exchanges provided by Google. Finally, you publish shared datasets into an exchange to make them available to subscribers.
Data subscribers search through the datasets that are available across all exchanges for which they have access and subscribe to relevant datasets. This creates a linked dataset in their project that they can query and join with their own data. Subscribers pay for the queries that they run against the data while the publisher pays for the storage of the data. Data providers can add new data, new tables, or new columns to the shared dataset and these will be immediately available to subscribers. In addition, the publisher can track subscribers, disable subscriptions, and see aggregated usage information for the shared data.
Analytics Hub makes it easy for you to publish, discover, and subscribe to valuable datasets that you can combine with your own data to derive unique insights. Here are some types of data that will be available through Analytics Hub:
- Public datasets: Easy access to the existing repository of over 200 public datasets, including data about weather and climate, cryptocurrency, healthcare and life sciences, and transportation.
- Google datasets: Unique, freely-available datasets from Google. One example of this is the COVID-19 community mobility dataset. Another example is the forthcoming Google Trends dataset, which will provide the top 25 search terms and top 25 rising search terms over a 5 year window in 210 distinct locations in the US. Trends data can be used by everyone in the organization to gain insights into what customers care about.
- Commercial (paid for) datasets: We are working with leading commercial data providers to bring their data products to Analytics Hub. If you are interested in delivering your data via Analytics Hub, we’re also introducing Data Gravity, an initiative that provides storage benefits and new distribution paths for data published through Analytics Hub.
- Internal datasets: We know that data sharing can be challenging in larger organizations. Analytics Hub can be used for internal data, for example, to share standardized customer demographics with your sales engineering and data science teams.
Customers and partners using Analytics Hub

“Google Search Trends data has always been an important tool for our WPP agency data teams. At WPP we believe that data variety is a superpower which is why we are excited to use the new Trends dataset availability within BigQuery, plus the launch of Analytics Hub. The best creativity in the world is informed by data insights, and influenced by what people search for, so the operational efficiencies we’ll gain via the Analytics Hub and the insights we can drive with Trends data are just phenomenal.”
—Di Mayze Global Head of Data and AI, WPP

“Equifax Ignite is our shared data analytics environment within our Equifax data fabric. We are excited to partner with Google to leverage Analytics Hub and BigQuery to deliver data to over 400 statisticians and data modelers as well as securely sharing data with our partner financial institutions.”
—Kumar Menon, SVP Data Fabric and Decision Science, Equifax

“The flow of data and insights between our teams at Deloitte and our clients is paramount for building truly transformational data cultures. With its purpose-built architecture for secure data exchanges and sharing analytics resources, Google Cloud’s Analytics Hub can help provide significant operational efficiencies for how Deloitte teams support our clients’ data-driven initiatives within their industry ecosystems. It will also help minimize the worries about scale, privacy and security, or the administrative burden associated with each.”
—Navin Warerkar, Managing Director, Deloitte Consulting LLP, and US Google Cloud Data & Analytics GTM Lead

“Crux Informatics is proud to partner with Google to support the launch of Analytics Hub, removing friction for those who need access to analytics-ready data. With thousands of datasets from over 140 sources, Crux Informatics will accelerate access to data on Analytics Hub and together provide a more efficient and cost effective solution to deliver datasets in Google Cloud’s ecosystem.”
—Will Freiberg, CEO, Crux Informatics
Next steps for Analytics Hub
This is just the beginning for Analytics Hub. As we get to preview and general availability, we will be adding additional capabilities, including workflows for publishing and subscribing, publishing analytics assets (Looker Blocks, Data Studio reports, Connected Google Sheets) along with the shared data, the ability for data publishers to specify query restrictions on the usage of their data, and making it easy for data publishers to create sandbox environments for subscribers to work with their data, even if they are not yet on Google Cloud. We will provide features in Analytics Hub for monetization of data, including managing subscriptions, data entitlements, and billing.
Please sign up for the preview, which is scheduled to be available in the third quarter of 2021. In the meantime, you can learn more about BigQuery and how to leverage its built-in data sharing capabilities. Please go to g.co/cloud/analytics-hub to register your interest in Analytics Hub.
6070
Of your peers have already watched this video.
48:30 Minutes
The most insightful time you'll spend today!
Can Your Data Warehouse Handle a 100-Trillion Row Query?
Today’s enterprise demands from data go far beyond the capabilities of traditional data warehousing and for many leaders, the need to digitally transform their businesses is a key driver for data analytics spending.
Businesses want to make real-time decisions from fresh information as well as make future predictions from their data in order to remain competitive.
In this video, Jordan Tigani, Director of Product Management, Google BigQuery reveals the power of Google Cloud’s modern data warehouse, BigQuery, that helps businesses make informed decisions quickly.
In addition, he talks about how big Google BigQuery can get. He shares examples of how one customer ran a query against a giant table of 100 trillion rows. “I think it was something like 19 petabytes of data scanned. It took about took about 20 minutes. It used 39,000 slots, which is about 20,000 cores,” says Tigani.
He also shares examples of how businesses, such as online retailer, Zulily generate real business benefits from being able to query large datasets faster, and more easily than ever–without having to invest time managing infrastructure.
Finally, Amir Aryanpour, Technical Architect, Channel 4, talks abouut how connecting connecting Google BigQuery to other solutions with the Google Cloud Platform, including storage, data visualisation, and a sentiment analysis engine, among others, helped the company.
Quantum Metric Increases Business 10-fold

9248
Of your peers have already read this article.
5:30 Minutes
The most insightful time you'll spend today!
At Quantum Metric, we’re in the business of bringing our customers business insights that are based on customer experience data and analytics for mid-market and Fortune 500 companies.
Our software, powered by big data, machine intelligence, and Google Cloud, helps our customers identify, quantify, prioritize and measure opportunities to improve digital experiences.
As companies move to a more agile product lifecycle, including continuous deployment and continuous integration, they’re finding that it’s critical to receive perpetual quantified feedback and insights from their data in real time to understand where the largest opportunities exist.
Each year, billions of customer interactions are captured through browsers or mobile apps on PCs, tablets, and mobile devices. This data, fed into the Quantum Metric platform, can show if a customer had a password problem they couldn’t solve or struggled when trying to purchase something and abandoned their cart.
It also can show if the customer tried in vain to complete an online change to their service provider’s subscription, to reach tech support, or couldn’t find the size or color they were looking for while shopping online.
Most importantly, the Quantum Metric platform quantifies the business value of the issue, helping organizations prioritize where they can make the largest impact to their business.
Success overwhelms our initial architecture
Initially, the Quantum Metric experience analytics software ran on a MySQL open source relational database management system (RDBMS). The MySQL RDBMS worked great for simple queries, when there was a specific question to ask of the data.
Soon, though, we knew we needed to offer more advanced data science capabilities. Our bigger customers wanted to ask questions across very large data sets—days, weeks, months, and years worth of data. They wanted to pose iterative questions using complex filters to answer their most challenging business questions.
With more complex queries across more data, response times from our RDBMS went from 100 to 500 milliseconds to as long as 20 minutes.
That delay was slowing down our ability and time to insights, which also reduced the value we could provide to our customers, since iterative exploration and analysis requires real-time query responses. Because of the need for real-time responses, there were certain questions that we just weren’t able to ask of the data. It became clear that we needed a much more robust data warehouse solution.
There were also operational challenges with MySQL and massive-scale data ingestion. We spent a lot of time into the wee hours of the night and morning handling errors and recovering databases.
We tried to address these challenges by sharding, partitioning, and indexing the data to optimize for the types of questions customers were asking. But the problems were escalating and happening more often, from once a month across the customer base to monthly for at least 20 different customers.
We could tune the platform for today and tomorrow’s workload, with good guesses at where indexes could be used, but we simply couldn’t continue to horizontally scale MySQL in a cost-efficient and operationally efficient manner.
Speed breeds innovation
Once we started exploring options that could better scale with our business, we looked at NoSQL technologies like Cassandra (a partitioned row-store database), MySQL’s Column Store (a columnar store database), and Vertica (a columnar store database)—each with unique ways of handling data storage and accessibility.
But with high volumes of complex queries across large data stores, all of these solutions began to fail, bogged down with multiple, simultaneous users. We could have solved the problems with more raw compute and storage, but it would have been prohibitively expensive to run and require a large team to operate.
We then decided to try BigQuery, and it was transformative.
We connected our front end to BigQuery via APIs. Once data is 15 minutes old, it is automatically extracted, loaded, and transformed (ETL) to BigQuery.
We continuously update the legacy MySQL RDBMS so its data is integrated with BigQuery data when queries require real-time data. Most query response times are within 100-200 milliseconds, matching what we initially experienced with MySQL.
When traffic from our customers scales up, we can now scale on-demand to accommodate it, thanks to BigQuery’s hundreds of thousands of CPUs. Our customers no longer run into slow response times, and we’ve gained confidence that we can offer them—and their users—advanced insights and better experiences without delay.
More importantly, with this scale of query power, we were able to build data science algorithms into the platform, which iteratively query BigQuery based on the results, and help quantify the impact of a specific issue to a specific segment of users. Adding these capabilities was possible because of the massive scale of BigQuery.
In addition to new insights and fast response times, we wanted our customers to be able to ask complex questions using very simple language.
For example: “Show me high-loyalty customers, located in specific geographic areas, who visited the web site at least five times, based on specific campaigns, and never booked a seat on a flight.”
This was exactly the kind of query that was used by a major U.S. airline to understand the multi-million dollar impact of a failure affecting their most valuable customers: their high-loyalty members.
And this was all done while maintaining the highest standard of care of customer data and privacy by default, using multiple layers of encryption of data in transit, at rest, and a unique military-grade encryption approach. This approach encrypts PII, including even session cookies, with a RSA-2048 key available only to a select few and used for use cases such as fraud analysis.
It’s no exaggeration to say that BigQuery has totally transformed our business. It provides the petabyte scale and speed we were missing, in addition to taking care of operational maintenance, a task that was burying our team with MySQL.
We’re now able to support some of the largest companies in the world that require real-time, petabyte-scale analytics. That lets them serve more customers faster with higher quality, and take advantage of BigQuery’s power and scale to innovate.
There are other cloud solutions that can address petabyte analytics, but the most unique value proposition of BigQuery was its on-demand scaling and operational management, with extremely cost-effective pay-as-you-go billing. While today we are at a scale where we have round-the-clock querying needs, our early days had very sporadic query loads where we needed instant scale, then a long lull of nothing. The unique business model of BigQuery’s pay-by-bytes-scanned allowed us to have access to a massive-scale querying platform without breaking the bank.
Using BigQuery powers better customer experience and reduces purchasing friction
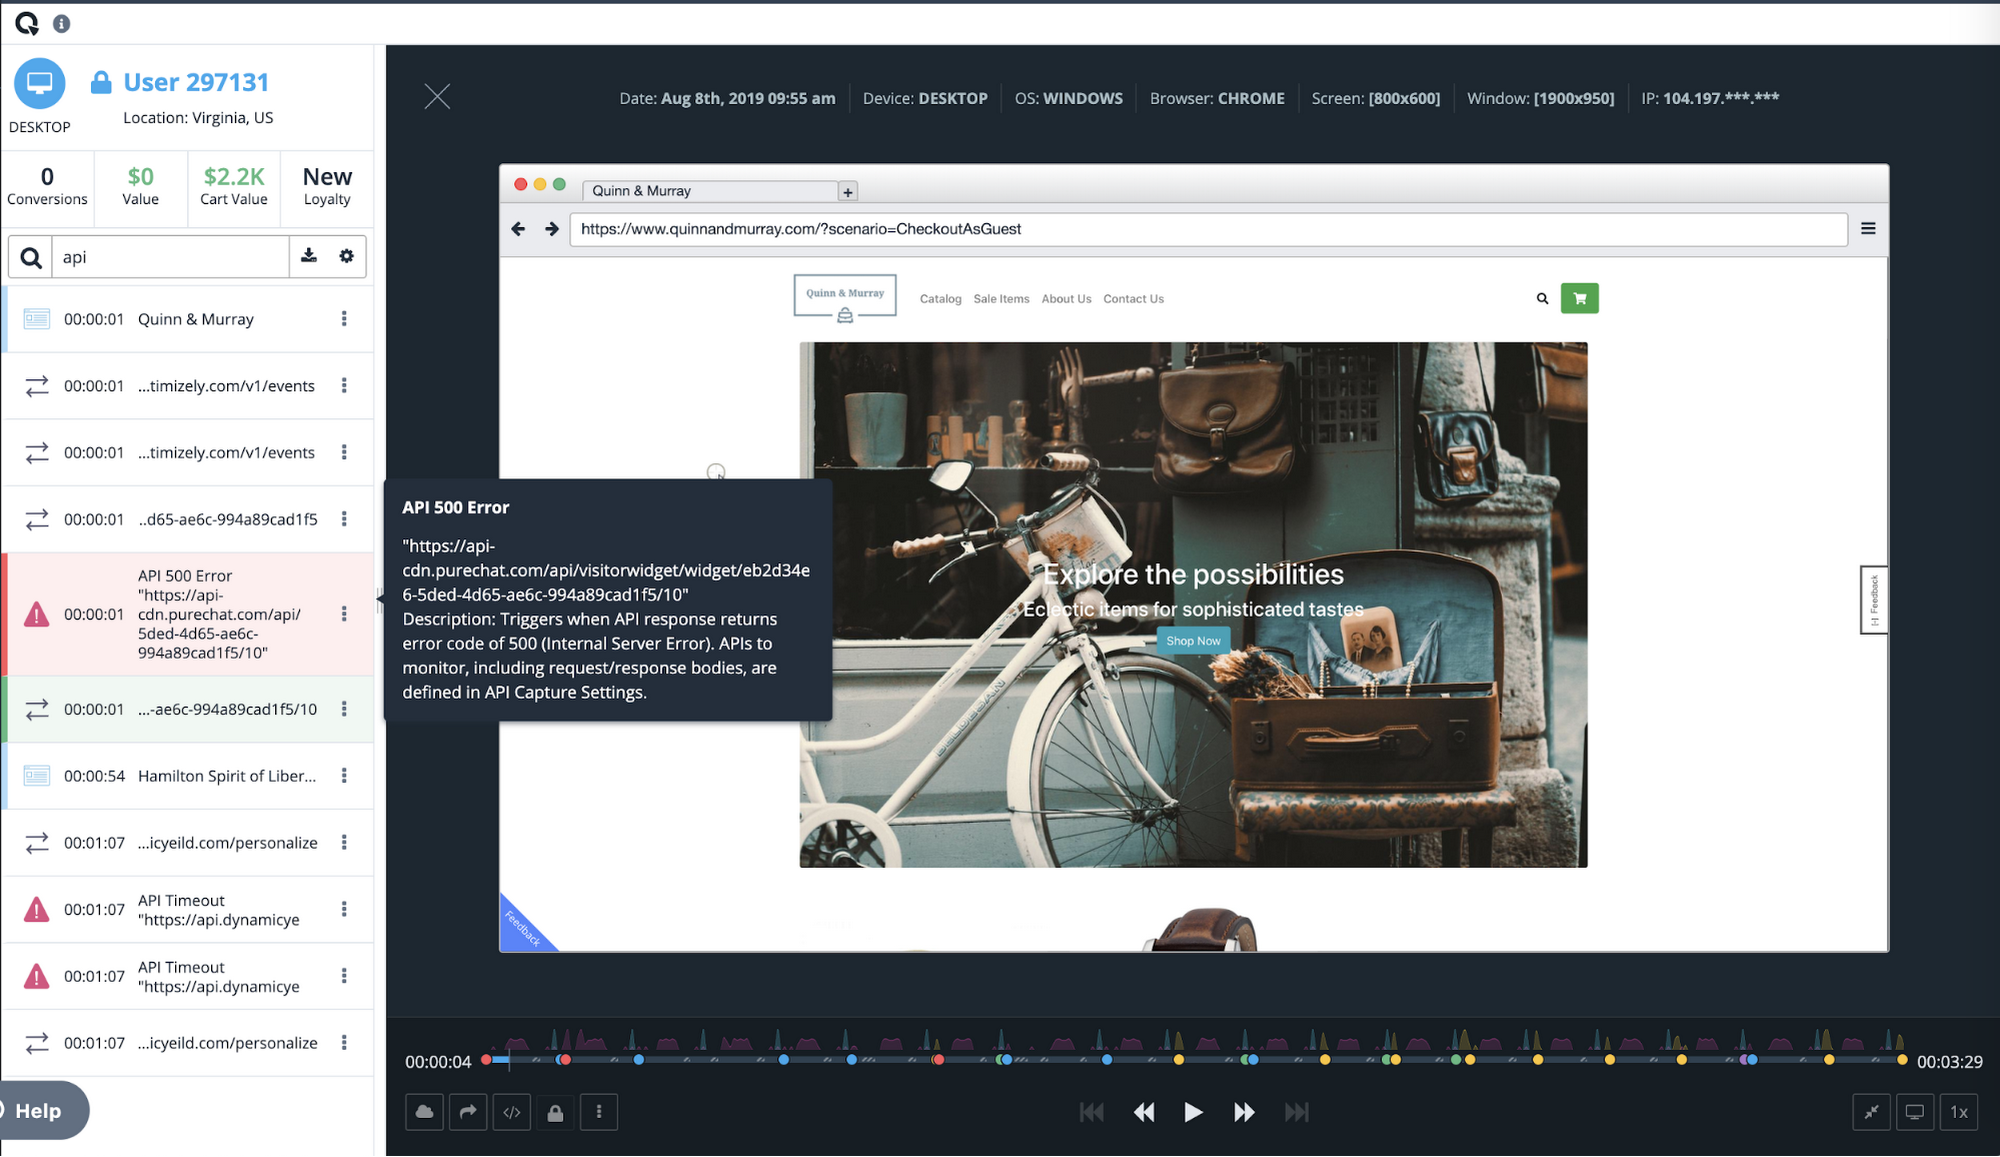
Among the many features of Quantum Metric is the ability to replay online customer sessions. In the example below from a mobile e-commerce site, each action is displayed chronologically. Why did this customer’s transaction fail?
Diving deeper, the session replay shows that the user tried to change the item quantity in the checkout cart, which resulted in a failed API call. Powered by BigQuery, Quantum Metric can then show how many other end users had this issue, with a simple click of “Show More Errors Like This.”
With BigQuery’s massive scale, Quantum Metric will then quantify the impact of that issue, so companies can prioritize which issues need attention immediately. If this is the issue that’s impacting the business the most, our customer can use a single click to open a Jira ticket, forwarding the discovery to their product and engineering teams. Those teams can then re-engineer the experience in near-real time, addressing the failed API call and cutting out the frustrating time it takes for engineers to reproduce the issue.
Once we had a powerful back end in BigQuery, we realized that Quantum Metric’s platform could be used to ask complex questions from vast datasets. We built some of the processes that data scientists use to formulate those queries right into our product.
For example, we added one series of processes to our platform to help customers understand whether a suspect issue is really impacting end-user experience. Is it something that should be prioritized and fixed? Does this really affect the user experience? Does it have financial impact? These and other questions can be pre-defined as a complex query in Quantum Metric to let our customer quickly gain insight on how an issue is impacting the business. Customers were blown away when they heard this was possible. It was the holy grail for what they were looking for in data science. It really sets us apart from our competition.
Today, with every company heavily dependent on data, those companies that can uncover and act on insights fastest are the ones that will succeed. BigQuery gives us the data warehouse platform we need to provide our customers with fast, reliable technology tools. It frees us from having to deal with the minutiae of technology infrastructure operations, so we can focus on finding and extracting the magic in customer data. With the power and scale of BigQuery, combined with the real-time capture of every user experience with 100% fidelity, we’re able to offer a self-service analytics platform that provides insights into digital journey friction points and acts as the indisputable arbitrator of truth.
Data to Business Outcomes with Google’s Data Analytics Design Pattern

6722
Of your peers have already read this article.
1:30 Minutes
The most insightful time you'll spend today!
Companies today are inundated with vast amounts of data from various sources. This overwhelming amount of data is meant to benefit the company, but often leaves data teams feeling overwhelmed, which can create data bottlenecks and result in a slow time to value. In fact, only twenty seven percent of companies agree that data and analytics projects produce insights and recommendations that are highly actionable (Accenture). This means that nearly 3 in 4 companies are not unlocking value in their data, which poses a huge challenge for organizations trying to move the needle and drive real business results. We at Google Cloud, however, saw opportunity in this challenge, which is why we created Data Analytics Design Patterns: cross-product technical solutions designed to accelerate a customer’s path to value realization with their data. These industry solutions bring together product capabilities alongside design methodology, open source deployable code, data models, and reference architectures to accelerate your business outcomes.

With Data Analytics Design Patterns, you get access to more than 30 ready-to-deploy data analytics solutions. Design patterns leverage the best of Google and our rich partner ecosystem, including Technology Partners & System Integrators. In this blog, we will cover 3 examples on how a design pattern can be applied to unlock the value of data:
- Improve mobile app experience with Unified App Analytics
- Maximize digital shop’s revenue with Price Optimization
- Protect internal systems from security and malware threat with Anomaly Detection
Unified App Analytics
If mobile apps are part of your go-to-market strategy, you have several data sources that can provide invaluable customer insights. In addition to tools such as CRM (e.g. Salesforce) and customer care (e.g. Zendesk), you likely use Google Analytics to log app events and Firebase Crashlytics to gather data about app errors. But can you easily combine back-end server data with app front-end data to unlock customer insights?
The Unified App Analytics design pattern makes it easy to plug all the disparate data sources into a single warehouse (BigQuery) and start analyzing it with a Business Intelligence tool (Looker). Once you have a complete and real time view of your customer experience with your app, you can take action. For example, if you notice an increase in app errors, you can quickly combine your Crashlytics data with your CRM data to narrow down the crashes with the highest revenue impact and prioritize their resolution. Further, you can automate your issue resolution workflow by creating a rule for any future crash that impacts a subset of VIP customers.

With the Unified App Analytics design pattern, you’ll gain access to valuable insights about your user experience with your app so you can inform your future app strategy. For example, NPR, an American media company, increased user engagement by showing content that better mapped to listener interests and behaviors.
Price Optimization
In a competitive and hectic global marketplace, strategic pricing matters more than ever, but often projects are consumed by the tedium of standardizing, cleaning, and preparing data—from transactions, inventory, demand, among other sources.
Price Optimization solution allows retailers to build a data driven pricing model. The solution consists of three main components:
- Dataprep by Trifacta: integrates different data sources into a single Common Data Model (CDM). Dataprep is an intelligent data service for visually exploring, cleaning, and preparing structured and unstructured data for analysis, reporting, and machine learning.
- BigQuery: allows you to create and store pricing models in a consistent and scalable way as a serverless Cloud Data Warehouse service
- Looker dashboards: surface insights and enable business teams to take action with enterprise ready BI platform
With the Price Optimization design pattern from Google Cloud and our partner Trifacta, you’ll be able to rapidly unify multiple data sources and create a real-time and ML-powered analysis, leveraging predictive models to estimate future sales. For example, PDPAOLA, an online jewelry company, doubled sales with dynamic pricing adjustments enabled by a single data view.

Anomaly Detection
Organizations need to anticipate and act on risks and opportunities to stay competitive in a digitally transforming society. Anomaly detection helps organizations identify and respond to data points and data trends in high velocity, high volume data sets that deviate from historical standards and expected behaviors, allowing them to take action on changing user needs, mitigate malicious actors and behaviors, and prevent unnecessary costs and monetary losses.
The Anomaly Detection design pattern uses Google Pub/Sub, BigQuery, Dataflow, and Looker to:
- Stream events in real time
- Process the events, extract useful data points, train the detection algorithm of choice
- Apply the detection algorithm in near-real time to the events to detect anomalies
- Update dashboards and/or send alerts
The challenge of finding the important insights and anomalies in vast amounts of data applies to organizations across all industries and lines of business, but is especially important to protecting the security of an organization. For example, TELUS, a national communications company, modernized their security analytics platform leveraging this pattern, allowing them to detect anomalies in near real time to detect and mitigate suspicious activity.
Get started
Turn your data into business outcomes with Google Cloud and our broad partner ecosystem by deploying Data Analytics Design Patterns at your organization. There are more than 30 Data Analytics Design Patterns ready for you to use. We have more than 200+ more ideas in the pipeline, so be sure to check in regularly as new patterns will be added soon.
To dive deeper and find out more about how Data Analytics Design Patterns can help your organization accelerate use cases and create faster time to value, check out this video.
More Relevant Stories for Your Company

How BigQuery’s Unique Features Support Your Data at Petabyte-scale
Organizations rely on data warehouses to aggregate data from disparate sources, process it, and make it available for data analysis in support of strategic decision-making. BigQuery is the Google Cloud enterprise data warehouse designed to help organizations to run large scale analytics with ease and quickly unlock actionable insights. You

How Kinguin Notched Up Shopping Experience with Google Recommendations AI
Over 2.14 billion people worldwide are expected to buy online this year, according to Statista. Online retail sales will account for 22% of all purchases by 2023. But in a competitive retail landscape, positive interactions can mean the difference between a sale and an abandoned shopping cart. One of the leading global
Unlocking Data Value: Latest Data Platforms and Announcements at the Next 21
Today at Google Cloud Next we are announcing innovations that will enable data teams to simplify how they work with data and derive value from it faster. These new solutions will help organizations build modern data architectures with real-time analytics to power innovative, mission-critical, data-driven applications. Too often, even the best minds

Guide for Measuring Cloud Spanner Performance for Your Custom Workload
Database migration to a new database platform or technology can be daunting for various reasons. One of the common concerns is database performance. It is hard to evaluate database performance early in the evaluation cycle without performing actual data migration and application changes. This becomes even more important in the
