





6405
Of your peers have already watched this video.
2:00 Minutes
The most insightful time you'll spend today!
CCAI Insights: Answer Customers’ Queries & Understand Them Better with Conversation Data
With CCAI Insights, businesses can drive contact center efficiency, solve customer problems and leverage data from customer interactions to understand them better!
CCAI Insights, a core piece of the Google Cloud’s Contact Center AI product suite is built to help contact center management dive into data to adjust business needs, preempt problems with timely analysis of customer conversations and keep agents prepared. Additionally, businesses can automatically feed data into Insights from other areas of CCAI like Dialogflow CX or another product sources. Watch the video to find out more benefits and capabilities of CCAI Insights in elevating CX.
AirAsia Leverages Google Cloud to Enhance Pricing, Revenue, and Customer Experience

1117
Of your peers have already read this article.
5:30 Minutes
The most insightful time you'll spend today!
With Google Cloud, AirAsia is now a “data first” business that can capture, analyze, and report on rising volumes of data to address complex problems and increase revenue streams. The airline is also using AI-powered chatbots to streamline internal operations and provide a faster, more efficient service.
Google Cloud results
- Increases employee survey response rates by 30% and improved safety, scheduling, and employee orientation
- Enables movement towards a zero trust security model while reducing administration load on IT team
- Increases business agility by deploying faster and more frequently

Become a digital airline powered by data and machine learning
AirAsia’s vision is simple: allow everyone to fly. Founded in 2001, the airline and sister company AirAsia X have grown to service 150+ destinations in 25 markets, using 274 aircraft to operate 11,000+ weekly flights from 23 hubs across the region. While the airline is known as a provider of low-cost airfares to locations across Asia, this is only one part of its value proposition. AirAsia also aims to deliver innovative, personalized products and services that meet the needs of each of its passengers.
Technology is key to AirAsia’s success and, with strong support from Group Chief Executive Officer Tony Fernandes, in 2016 the airline began a five-year program to become a data-first business and a digital airline.
“We wanted to better ensure we were using data correctly to become more agile, efficient, and customer oriented,” says Lye Kong Wei, Chief of Data Science, Group Head at AirAsia.
AirAsia needed technologies and services that could capture, process, analyze, and report on data, while delivering value for money and meeting its speed and availability requirements. The airline also wanted to minimize infrastructure management and system administration demands on its technology team.
Google Cloud the best fit
AirAsia realized only a cloud service could meet its needs and began evaluating the market. The airline then conducted a proof of concept and found Google Cloud was the best fit for its business. It was already familiar with Google Cloud, having deployed Google Workspace collaboration and productivity applications to its workforce in all countries except China. According to Kong Wei, products such as Forms, Docs, Sheets, and Gmail delivered a considerable improvement in collaboration between various departments, as well as streamlining and automating a range of processes.
The business was particularly excited by the potential of the BigQuery analytics data warehouse to power its digital transformation. “We knew data was a big part of making decisions in the future,” says Kong Wei. “So we needed a platform that could scale to meet our growing appetite for it. Google Cloud—in particular BigQuery—was ideal for this task.”
The AirAsia technology team was impressed by the ease and flexibility with which it could extract, transform, and load customer data from its systems, websites, and mobile applications into BigQuery for analysis. Data, reports, and dashboards were delivered and visualized through Looker Studio.
BigQuery also scaled seamlessly to support data growth and, as a managed service, required minimal administration from the airline’s technology team. “In addition, with BigQuery, we could process queries and requests much faster than previously and tackle more complex problems,” says Kong Wei. “As a result, we could be more innovative about realizing opportunities,” he adds, citing the benefits of being able to view and understand historical measures of booking curves—a measure of how long it took customers to book before a flight. This improves the airline’s ability to manage revenues.
A broad ecosystem
BigQuery and Looker Studio are just two components of a broad ecosystem—powered largely by Google Cloud services—deployed by AirAsia. Pub/Sub provides a scalable message queue that enables AirAsia developers to integrate systems hosted on Google Cloud or externally. Apache Airflow enables the business to create, schedule, and monitor workflows, while Cloud Composer manages the dependencies of PHP and related libraries. App Engine allows AirAsia personnel to develop and host web applications. “Thanks to App Engine, we’ve easily been able to create new applications, services, and APIs powered by the data we have been collecting,” says Kong Wei.
AirAsia is also running the middleware for its APIs in a managed Google Kubernetes Engine environment for increased scalability, resource optimization, and reliability, while Cloud Storage provides storage for data from a range of systems and sources. Dataflow enables the business to transform and process data in stream and batch modes from its website search page as customers look for flights.
Faster deployment and testing
The stability of Google Cloud service means AirAsia has a reliable base from which to launch new products and features. “If we have consistent reliability from our core systems—and Google Cloud incorporates monitoring tools such Cloud Monitoring that enable us to identify issues quickly—developers and product engineers can focus on turning ideas into reality,” says Kong Wei. “With a minimal number of people involved, we can very quickly transform an idea or thought process into a deliverable. Prior to Google Cloud, bringing those ideas to fruition would have been impossible.”
Robust security
AirAsia is also relying on Security Health Analytics, a product that integrates with Security Command Center, to identify misconfigurations and compliance violations in its Google Cloud resources and take action. Security Health Analytics ensures the airline’s budgets go to keeping customers’ travel costs low rather than recovering from security breaches.
The product enables AirAsia to check that resources are configured properly and are compliant with CIS benchmarks as its critical workloads run in Google Kubernetes Engine and App Engine.
“Being able to go to the new Security Health Analytics dashboard eliminates the guesswork of what we have running and if it is secure,” says Muhammad Faeez Bin Azmi, Information Security and Automation Solution Architect. “Now anyone on our team, even non-security professionals, can go to this dashboard and see a list of the misconfigured assets and compliance violations across all of our Google Cloud resources. We can also see the severity of misconfigurations, which helps us prioritize our response.”
“Security Health Analytics has really helped us reduce the amount of time we spend trying to figure out what’s wrong with our resources. It’s allowed us to use our time more effectively to identify and resolve more security issues than we could before.”
A new identity solution
AirAsia had also used a legacy on-premises directory for many years. However, as the company grew and expanded to new markets and regions, it had to manage multiple servers across a number of on-premises data centers and the public cloud, which proved costly and time-consuming.
Its Allstars—the airline’s name for its employees—needed to easily access a number of legacy on-premises apps in addition to a growing number of SaaS apps. As a business, it also needed a more seamless integration between its HR system of record and its identity solution for user provisioning and life cycle management. Solving these challenges with its existing on-premises directory was simply not feasible.
AirAsia brought up its identity concerns with the Google Cloud team, and after a number of conversations, decided to deploy Cloud Identity, Google’s cloud-based Identity and Access Management solution, to help address the identity challenges it was facing.
The airline chose Cloud Identity for a number of reasons—first, it was eager to move to the cloud as quickly as possible. Moving identity management to the cloud was a key enabler of this and the airline’s broader digital transformation. Managing identities from the cloud also enabled the airline to have a single identity and set of credentials for each employee, which they could use to access all the applications they need to be productive, both in the cloud and on-premises.
In addition, deploying Cloud Identity was a key step towards enabling the zero trust security model, which the airline felt was the best approach to strengthen its security posture and fight modern threats. Cloud Identity also integrated seamlessly with its existing technologies, which include not only Google Cloud products like Google Workspace and Chrome OS but also third-party tools like Citrix, Papercut, and others.
And finally, Cloud Identity offered significant cost and resource savings. With Cloud Identity in place, AirAsia’s IT department could spend less time worrying about managing multiple on-premises directory servers and and could instead focus on delivering value to Allstar employees.
Machine learning employed to increase ancillary revenue
In March 2018, AirAsia established the groundwork to use machine learning to optimize pricing for a range of services and began by using AI Platform to sort and predict demand for ancillary services such as baggage, seats, and meals. “By using AI Platform, we can sort based on data about history to predict the future,” says Kong Wei.
Dialogflow in wide use
With Google Cloud well established within the business, AirAsia is using Dialogflow, a voice and conversational interface development suite (and one of the core components of Contact Center AI) that enables businesses to create engaging AI powered voice- and text-based interfaces such as chatbots and voice apps—to streamline operations and reduce costs
“Tony Fernandes, our Group Chief Executive Officer, motivated us to create a range of metrics that would enable us to respond more quickly and efficiently to customers,” says Yuashini Vellasamy, Product Manager at AirAsia.
This resulted in the initial deployment of Dialogflow in AirAsia’s operational areas, from crew scheduling to internal business tasks.
With Dialogflow, AirAsia is able to provide pilots, crew, catering, and other teams with flight times, capacity and any other relevant information about their assignments. Another bot accepts medical certificates and updates from pilots and crew members unable to make rostered assignments and switches those assignments to other pilots and crews. “This improves our on-time performance and operational efficiency, as we are able to optimize the creation of crew schedules,” says Vellasamy.
AirAsia also uses Dialogflow to power a “safety bot” for airport ground staff. “We tried a lot of tools to encourage staff to advise us when they saw a safety issue—but employee usage was low,” says Vellasamy. “However, when we set up the safety bot, which asks users just four questions about an issue they have observed, we saw an increase in employee interaction, which helps ensure proper safety measures.
Beyond crew optimization and overall safety, AirAsia’s HR department in Asia uses a Dialogflow-powered bot to run a post-orientation engagement program for new employees. The bot follows up with employees about issues from parking to AirAsia’s onboarding buddy program, saving HR employees time from scheduling one-on-one meetings. Dialogflow also powered an employee satisfaction survey of 3,000 team members, resulting in a 30% increase in response rate compared to the previous year.
One of Dialogflow’s benefits is its language coverage, which the airline’s marketing team uses to target customers and prospects across a region with diverse languages and cultures. “For weekly campaigns and promotions, our sales and marketing teams simply update the campaign materials and the changes are reflected automatically in Dialogflow and consequently to users,” says Vellasamy. “This enables us to quickly scale and reach our customers globally.”
An upward trajectory
AirAsia is poised to reap further benefits from Google Cloud as its deployment matures. “On the data side, we’re more advanced, while on the application and programming side we have a long way to go,” says Kong Wei. “We’re on a trajectory upwards—we’re looking at a lot of new ideas and how to embrace and deploy them so we can further our data-first and digital airline agendas.”
10158
Of your peers have already watched this video.
1:00 Minutes
The most insightful time you'll spend today!
Predict User Churn on Gaming Apps with Google Analytics Data using BigQuery ML
User retention can be a major challenge for mobile game developers. According to the Mobile Gaming Industry Analysis in 2019, most mobile games only see a 25% retention rate for users after the first day. To retain a larger percentage of users after their first use of an app, developers can take steps to motivate and incentivize certain users to return. But to do so, developers need to identify the propensity of any specific user returning after the first 24 hours.
In this blog post, we will discuss how you can use BigQuery ML to run propensity models on Google Analytics 4 data from your gaming app to determine the likelihood of specific users returning to your app.
You can also use the same end-to-end solution approach in other types of apps using Google Analytics for Firebase as well as apps and websites using Google Analytics 4. To try out the steps in this blogpost or to implement the solution for your own data, you can use this Jupyter Notebook.
Using this blog post and the accompanying Jupyter Notebook, you’ll learn how to:
- Explore the BigQuery export dataset for Google Analytics 4
- Prepare the training data using demographic and behavioural attributes
- Train propensity models using BigQuery ML
- Evaluate BigQuery ML models
- Make predictions using the BigQuery ML models
- Implement model insights in practical implementations
Google Analytics 4 (GA4) properties unify app and website measurement on a single platform and are now default in Google Analytics. Any business that wants to measure their website, app, or both, can use GA4 for a more complete view of how customers engage with their business. With the launch of Google Analytics 4, BigQuery export of Google Analytics data is now available to all users. If you are already using a Google Analytics 4 property, you can follow this guide to set up exporting your GA data to BigQuery.
Once you have set up the BigQuery export, you can explore the data in BigQuery. Google Analytics 4 uses an event-based measurement model. Each row in the data is an event with additional parameters and properties. The Schema for BigQuery Export can help you to understand the structure of the data.
In this blogpost, we use the public sample export data from an actual mobile game app called “Flood It!” (Android, iOS) to build a churn prediction model. But you can use data from your own app or website.
Here’s what the data looks like. Each row in the dataset is a unique event, which can contain nested fields for event parameters.
SELECT *FROM `firebase-public-project.analytics_153293282.events_*`TABLESAMPLE SYSTEM (1 PERCENT)

This dataset contains 5.7M events from over 15k users.
SELECTCOUNT(DISTINCT user_pseudo_id) as count_distinct_users,COUNT(event_timestamp) as count_eventsFROM`firebase-public-project.analytics_153293282.events_*

Our goal is to use BigQuery ML on the sample app dataset to predict propensity to user churn or not churn based on users’ demographics and activities within the first 24 hours of app installation.

In the following sections, we’ll cover how to:
- Pre-process the raw event data from GA4
- Identify users & the label feature
- Process demographic features
- Process behavioral features
- Train classification model using BigQuery ML
- Evaluate the model using BigQueryML
- Make predictions using BigQuery ML
- Utilize predictions for activation
Pre-process the raw event data
You cannot simply use raw event data to train a machine learning model as it would not be in the right shape and format to use as training data. So in this section, we’ll go through how to pre-process the raw data into an appropriate format to use as training data for classification models.
This is what the training data should look like for our use case at the end of this section:

Notice that in this training data, each row represents a unique user with a distinct user ID (user_pseudo_id).
Identify users & the label feature
We first filtered the dataset to remove users who were unlikely to return the app anyway. We defined these ‘bounced’ users as ones who spent less than 10 mins with the app. Then we labeled all remaining users:
- churned: No event data for the user after 24 hours of first engaging with the app.
- returned: The user has at least one event record after 24 hours of first engaging with the app.
For your use case, you can have a different definition of bounce and churning. Also you can even try to predict something else other than churning, e.g.:
- whether a user is likely to spend money on in-game currency
- likelihood of completing n-number of game levels
- likelihood of spending n amount of time in-game etc.
In such cases, label each record accordingly so that whatever you are trying to predict can be identified from the label column.
From our dataset, we found that ~41% users (5,557) bounced. However, from the remaining users (8,031), ~23% (1,883) churned after 24 hours:
SELECTbounced,churned,COUNT(churned) as count_usersFROMbqmlga4.returningusersGROUP BY 1,2ORDER BY bounced

To create these bounced and churned columns, we used the following snippet of SQL code.
...#churned = 1 if last_touch within 24 hr of app installation, else 0IF (user_last_engagement < TIMESTAMP_ADD(user_first_engagement,INTERVAL 24 HOUR),1,0 ) AS churned,#bounced = 1 if last_touch within 10 min, else 0IF (user_last_engagement <= TIMESTAMP_ADD(user_first_engagement,INTERVAL 10 MINUTE),1,0 ) AS bounced,...
You can view the Jupyter Notebook for the full query used for materializing the bounced and churned labels.
Process demographic features
Next, we added features both for demographic data and for behavioral data spanning across multiple columns. Having a combination of both demographic data and behavioral data helps to create a more predictive model.
We used the following fields for each user as demographic features:
geo.countrydevice.operating_systemdevice.language
A user might have multiple unique values in these fields — for example if a user uses the app from two different devices. To simplify, we used the values from the very first user engagement event.
CREATE OR REPLACE VIEW bqmlga4.user_demographics AS (WITH first_values AS (SELECTuser_pseudo_id,geo.country as country,device.operating_system as operating_system,device.language as language,ROW_NUMBER() OVER (PARTITION BY user_pseudo_id ORDER BY event_timestamp DESC) AS row_numFROM `firebase-public-project.analytics_153293282.events_*`WHERE event_name="user_engagement")SELECT * EXCEPT (row_num)FROM first_valuesWHERE row_num = 1 #first engagement);
Process behavioral features
There is additional demographic information present in the GA4 export dataset, e.g. app_info, device, event_params, geo etc. You may also send demographic information to Google Analytics through each hit via user_properties. Furthermore, if you have first-party data on your own system, you can join that with the GA4 export data based on user_ids.
To extract user behavior from the data, we looked into the user’s activities within the first 24 hours of first user engagement. In addition to the events automatically collected by Google Analytics, there are also the recommended events for games that can be explored to analyze user behavior. For our use case, to predict user churn, we counted the number of times the follow events were collected for a user within 24 hours of first user engagement:
user_engagementlevel_start_quickplaylevel_end_quickplaylevel_complete_quickplaylevel_reset_quickplaypost_scorespend_virtual_currencyad_rewardchallenge_a_friendcompleted_5_levelsuse_extra_steps
The following query shows how these features were calculated:
WITHevents_first24hr AS (SELECTe.*FROM`firebase-public-project.analytics_153293282.events_*` eJOINbqmlga4.returningusers rONe.user_pseudo_id = r.user_pseudo_idWHERETIMESTAMP_MICROS(e.event_timestamp) <= r.ts_24hr_after_first_engagement)SELECTuser_pseudo_id,SUM(IF(event_name = 'user_engagement', 1, 0)) AS cnt_user_engagement,# ... repeated for all behavior data ...SUM(IF(event_name = 'use_extra_steps', 1, 0)) AS cnt_use_extra_steps,FROMevents_first24hrGROUP BY1
View the notebook for the query used to aggregate and extract the behavioral data. You can use different sets of events for your use case. To view the complete list of events, use the following query:
SELECTevent_name,COUNT(event_name) as event_countFROM`firebase-public-project.analytics_153293282.events_*`GROUP BY 1ORDER BYevent_count DESC
After this we combined the features to ensure our training dataset reflects the intended structure. We had the following columns in our table:
- User ID:
user_pseudo_id
- Label:
churned
- Demographic features
countrydevice_osdevice_language
- Behavioral features
cnt_user_engagementcnt_level_start_quickplaycnt_level_end_quickplaycnt_level_complete_quickplaycnt_level_reset_quickplaycnt_post_scorecnt_spend_virtual_currencycnt_ad_rewardcnt_challenge_a_friendcnt_completed_5_levelscnt_use_extra_stepsuser_first_engagement
At this point, the dataset was ready to train the classification machine learning model in BigQuery ML. Once trained, the model will output a propensity score between churn (churned=1) or return (churned=0) indicating the probability of a user churning based on the training data.
Train classification model
When using the CREATE MODEL statement, BigQuery ML automatically splits the data between training and test. Thus the model can be evaluated immediately after training (see the documentation for more information).
For the ML model, we can choose among the following classification algorithms where each type has its own pros and cons:

Often logistic regression is used as a starting point because it is the fastest to train. The query below shows how we trained the logistic regression classification models in BigQuery ML.
CREATE OR REPLACE MODEL bqmlga4.churn_logregTRANSFORM(EXTRACT(MONTH from user_first_engagement) as month,EXTRACT(DAYOFYEAR from user_first_engagement) as julianday,EXTRACT(DAYOFWEEK from user_first_engagement) as dayofweek,EXTRACT(HOUR from user_first_engagement) as hour,* EXCEPT(user_first_engagement, user_pseudo_id))OPTIONS(MODEL_TYPE="LOGISTIC_REG",INPUT_LABEL_COLS=["churned"]) ASSELECT*FROMbqmlga4.train
We extracted month, julianday, and dayofweek from datetimes/timestamps as one simple example of additional feature preprocessing before training. Using TRANSFORM() in your CREATE MODEL query allows the model to remember the extracted values. Thus, when making predictions using the model later on, these values won’t have to be extracted again. View the notebook for the example queries to train other types of models (XGBoost, deep neural network, AutoML Tables).
Evaluate model
Once the model finished training, we ran ML.EVALUATE to generate precision, recall, accuracy and f1_score for the model:
SELECT*FROMML.EVALUATE(MODEL bqmlga4.churn_logreg)

The optional THRESHOLD parameter can be used to modify the default classification threshold of 0.5. For more information on these metrics, you can read through the definitions on precision and recall, accuracy, f1-score, log_loss and roc_auc. Comparing the resulting evaluation metrics can help to decide among multiple models.Furthermore, we used a confusion matrix to inspect how well the model predicted the labels, compared to the actual labels. The confusion matrix is created using the default threshold of 0.5, which you may want to adjust to optimize for recall, precision, or a balance (more information here).
SELECTexpected_label,_0 AS predicted_0,_1 AS predicted_1FROMML.CONFUSION_MATRIX(MODEL bqmlga4.churn_logreg)

This table can be interpreted in the following way:

Make predictions using BigQuery ML
Once the ideal model was available, we ran ML.PREDICT to make predictions. For propensity modeling, the most important output is the probability of a behavior occurring. The following query returns the probability that the user will return after 24 hrs. The higher the probability and closer it is to 1, the more likely the user is predicted to return, and the closer it is to 0, the more likely the user is predicted to churn.
SELECTuser_pseudo_id,returned,predicted_returned,predicted_returned_probs[OFFSET(0)].prob as probability_returnedFROMML.PREDICT(MODEL bqmlga4.churn_logreg,(SELECT * FROM bqmlga4.train)) #can be replaced with a proper test dataset
Utilize predictions for activation
Once the model predictions are available for your users, you can activate this insight in different ways. In our analysis, we used user_pseudo_id as the user identifier. However, ideally, your app should send back the user_id from your app to Google Analytics. In addition to using first-party data for model predictions, this will also let you join back the predictions from the model into your own data.
- You can import the model predictions back into Google Analytics as a user attribute. This can be done using the Data Import feature for Google Analytics 4. Based on the prediction values you can Create and edit audiences and also do Audience targeting. For example, an audience can be users with prediction probability between 0.4 and 0.7, to represent users who are predicted to be “on the fence” between churning and returning.
- For Firebase Apps, you can use the Import segments feature. You can tailor user experience by targeting your identified users through Firebase services such as Remote Config, Cloud Messaging, and In-App Messaging. This will involve importing the segment data from BigQuery into Firebase. After that you can send notifications to the users, configure the app for them, or follow the user journeys across devices.
- Run targeted marketing campaigns via CRMs like Salesforce, e.g. send out reminder emails.
You can find all of the code used in this blogpost in the Github repository:
What’s next?
Continuous model evaluation and re-training
As you collect more data from your users, you may want to regularly evaluate your model on fresh data and re-train the model if you notice that the model quality is decaying.
Continuous evaluation—the process of ensuring a production machine learning model is still performing well on new data—is an essential part in any ML workflow. Performing continuous evaluation can help you catch model drift, a phenomenon that occurs when the data used to train your model no longer reflects the current environment.
To learn more about how to do continuous model evaluation and re-train models, you can read the blogpost: Continuous model evaluation with BigQuery ML, Stored Procedures, and Cloud Scheduler
More resources
If you’d like to learn more about any of the topics covered in this post, check out these resources:
- BigQuery export of Google Analytics data
- BigQuery ML quickstart
- Events automatically collected by Google Analytics 4
- Qwiklabs: Create ML models with BigQuery ML
Or learn more about how you can use BigQuery ML to easily build other machine learning solutions:
- How to build demand forecasting models with BigQuery ML
- How to build a recommendation system on e-commerce data using BigQuery ML
Let us know what you thought of this post, and if you have topics you’d like to see covered in the future! You can find us on Twitter at @polonglin and @_mkazi_.Thanks to reviewers: Abhishek Kashyap, Breen Baker, David Sabater Dinter.
Leverage the Power of Looker to Extract Data Value at Web Scale

4442
Of your peers have already read this article.
3:00 Minutes
The most insightful time you'll spend today!
Data science can be applied to business problems to improve practices and help to strengthen customer satisfaction. In this blog, we address how the addition of Looker extends the value of your Google Cloud investments to help you understand your customer journey, unlock value from first-party data, and optimize existing cloud infrastructure.
Data is a powerful tool
While everyone doesn’t need to understand the nuts and bolts of data technologies, most people do care about the value data can create for them — how it can help them do their jobs better. Within the data space, we are seeing a trend of ongoing failure to make data accessible to “humans” – the industry still hasn’t figured out how to put data into the hands of people when and where they need it, how they need it.
What if everyone in your organization could analyze data at scale, and make more-informed, fact-based decisions? Data and insights derived from data are valuable but only if your users see it. We think Looker helps solve that.
Solutions tell a larger story of how it all fits together
Across all verticals and industries, businesses benefit from knowing and understanding their customers better. Many business goals are to increase revenue by improving product recommendations and pricing optimization, improving the user experience through targeted marketing and personalization, and reducing churn while improving retention rates. To help reach these goals, key strategies should focus on understanding customer needs, their motivations, likes and dislikes, and using all available data – in other words, put yourself in the shoes of your customer.
Our goal with Looker solutions is to offer the right level of out-of-box support that allows customers to get to value quickly, while maintaining the necessary flexibility. We aim to offer a library of data-driven solutions that accelerate data projects. Many solutions include Looker Blocks (pre-built pieces of code that accelerate data exploration environments) and Actions (custom integrations) that get customers up and running quickly and lets you build business-friendly access points for Google Cloud functionality like BQML, App Engine and Cloud Functions.
Below, you’ll find a sampling of the newest Looker solutions.
Listening to customers by looking at the data
Looker’s solution for Contact Center AI (CCAI), helps businesses gain a deeper understanding and appreciation of their customers’ full journey by unlocking insights from all their company’s first-party data. Call centers can converse naturally with customers and deliver outstanding experiences by leveraging artificial intelligence. CCAI‘s newest product —CCAI Insights — reviews conversations support agents are having, finding and annotating the data with the important information, and identifying the calls that need review. We’ve partnered with the product teams at CCAI to build Looker’s Block for CCAI Insights, which sets you on the path to integrating the advanced insights into your first-party data in Looker, overlaying business data with the customer experience.

Businesses can better understand contact center experiences and take immediate action when necessary to make sure the most valuable customers receive the best service.
Realizing full business value of First-Party data
Looker for Google Marketing Platform (GMP) provides marketers the power to unlock the value of their company’s first-party data to more effectively target audiences. The Looker Blocks and Actions for GMP offer interactive data exploration, slices of data with built-in ML predictions and activation paths back to the GMP. This strategic solution continues to evolve with the Looker Action for Google Ads (Customer Match), the Looker Action for Google Analytics (Data Import) and the Looker Block for Google Analytics 4 (GA4).
- The Looker Action for Customer Match allows marketers to send segments and audiences based on first-party data directly into Google Ads. Reach users cross-device and across the web’s most powerful channels such as Display, Video, YouTube, and Gmail. The entire process is performed within a single screen in Looker, and is able to be completed in a few minutes by a non-technical user.
- The Looker Action for Data Import can be used to enhance user segmentation and remarketing audiences in Google Analytics by taking advantage of user information accessible in Looker, such as in CRM systems or transactional data warehouses.
- The Looker Block for Google Analytics 4 (GA4) expands the solution’s support with out-of-the-box dashboards and pre-baked BigQuery ML models for the newest version of Google Analytics.The Looker Block offers up reports with flexible configuration capabilities to unlock custom insights beyond the standard GA reporting. Customize audience segments, define custom goals to track and share these reports with teams who do not have access to the GA console.
From clinical notes to patient insights at scale
Taking a look at the Healthcare vertical, the Looker Healthcare NLP API Block serves as a critical bridge between existing care systems and applications hosted on Google Cloud providing a managed solution for storing and accessing healthcare data in Google Cloud. The Healthcare NLP API uses natural language models to extract healthcare information from medical text, rapidly unlocking insights from unstructured medical text and providing medical providers with simplified access to intelligent insights. Healthcare providers, payers, and pharma companies can quickly understand the context and relationships of medical concepts within the text, such as medications, procedures, conditions, clinical history, and begin to link this to other clinical data sources for downstream AI/ML.
Specifically, the natural language processing (NLP) Patient View (pictured below) allows you to review a single selected patient of interest, surfacing their clinical notes history over time. It informs clinical diagnosis with family history insights, which is not currently captured in claims, and captures additional procedure coding for revenue cycle purposes.

The dashboard below shows the NLP Term View which allows users to focus on chosen medical terms across the entire patient population in the dataset so they can start to view trends and patterns across groups of patients.

This data can be used to:
- Enhance patient matching for clinical trials
- Identify re-purposed medications
- Drive advancements for research in cancer and rare diseases
- Identify how social determinants of health impact access to care
Managing Costs Across Clouds
Effective cloud cost management is important for reasons beyond cost control — it provides you the ability to reduce waste and predictably forecast both costs and resource needs. Looker’s solution for Cloud Cost Management offers quick access to necessary reporting and clear insights into cloud expenditures and utilization.
This solution brings together billing data from different cloud providers in a phased approach: get up and running quickly with Blocks optimized for where the data is today (Google Cloud, AWS or Azure) as you work towards more sophisticated analysis for cross-platform planning and even cloud spend optimization with the mapping of tags, labels and cost centers across clouds.
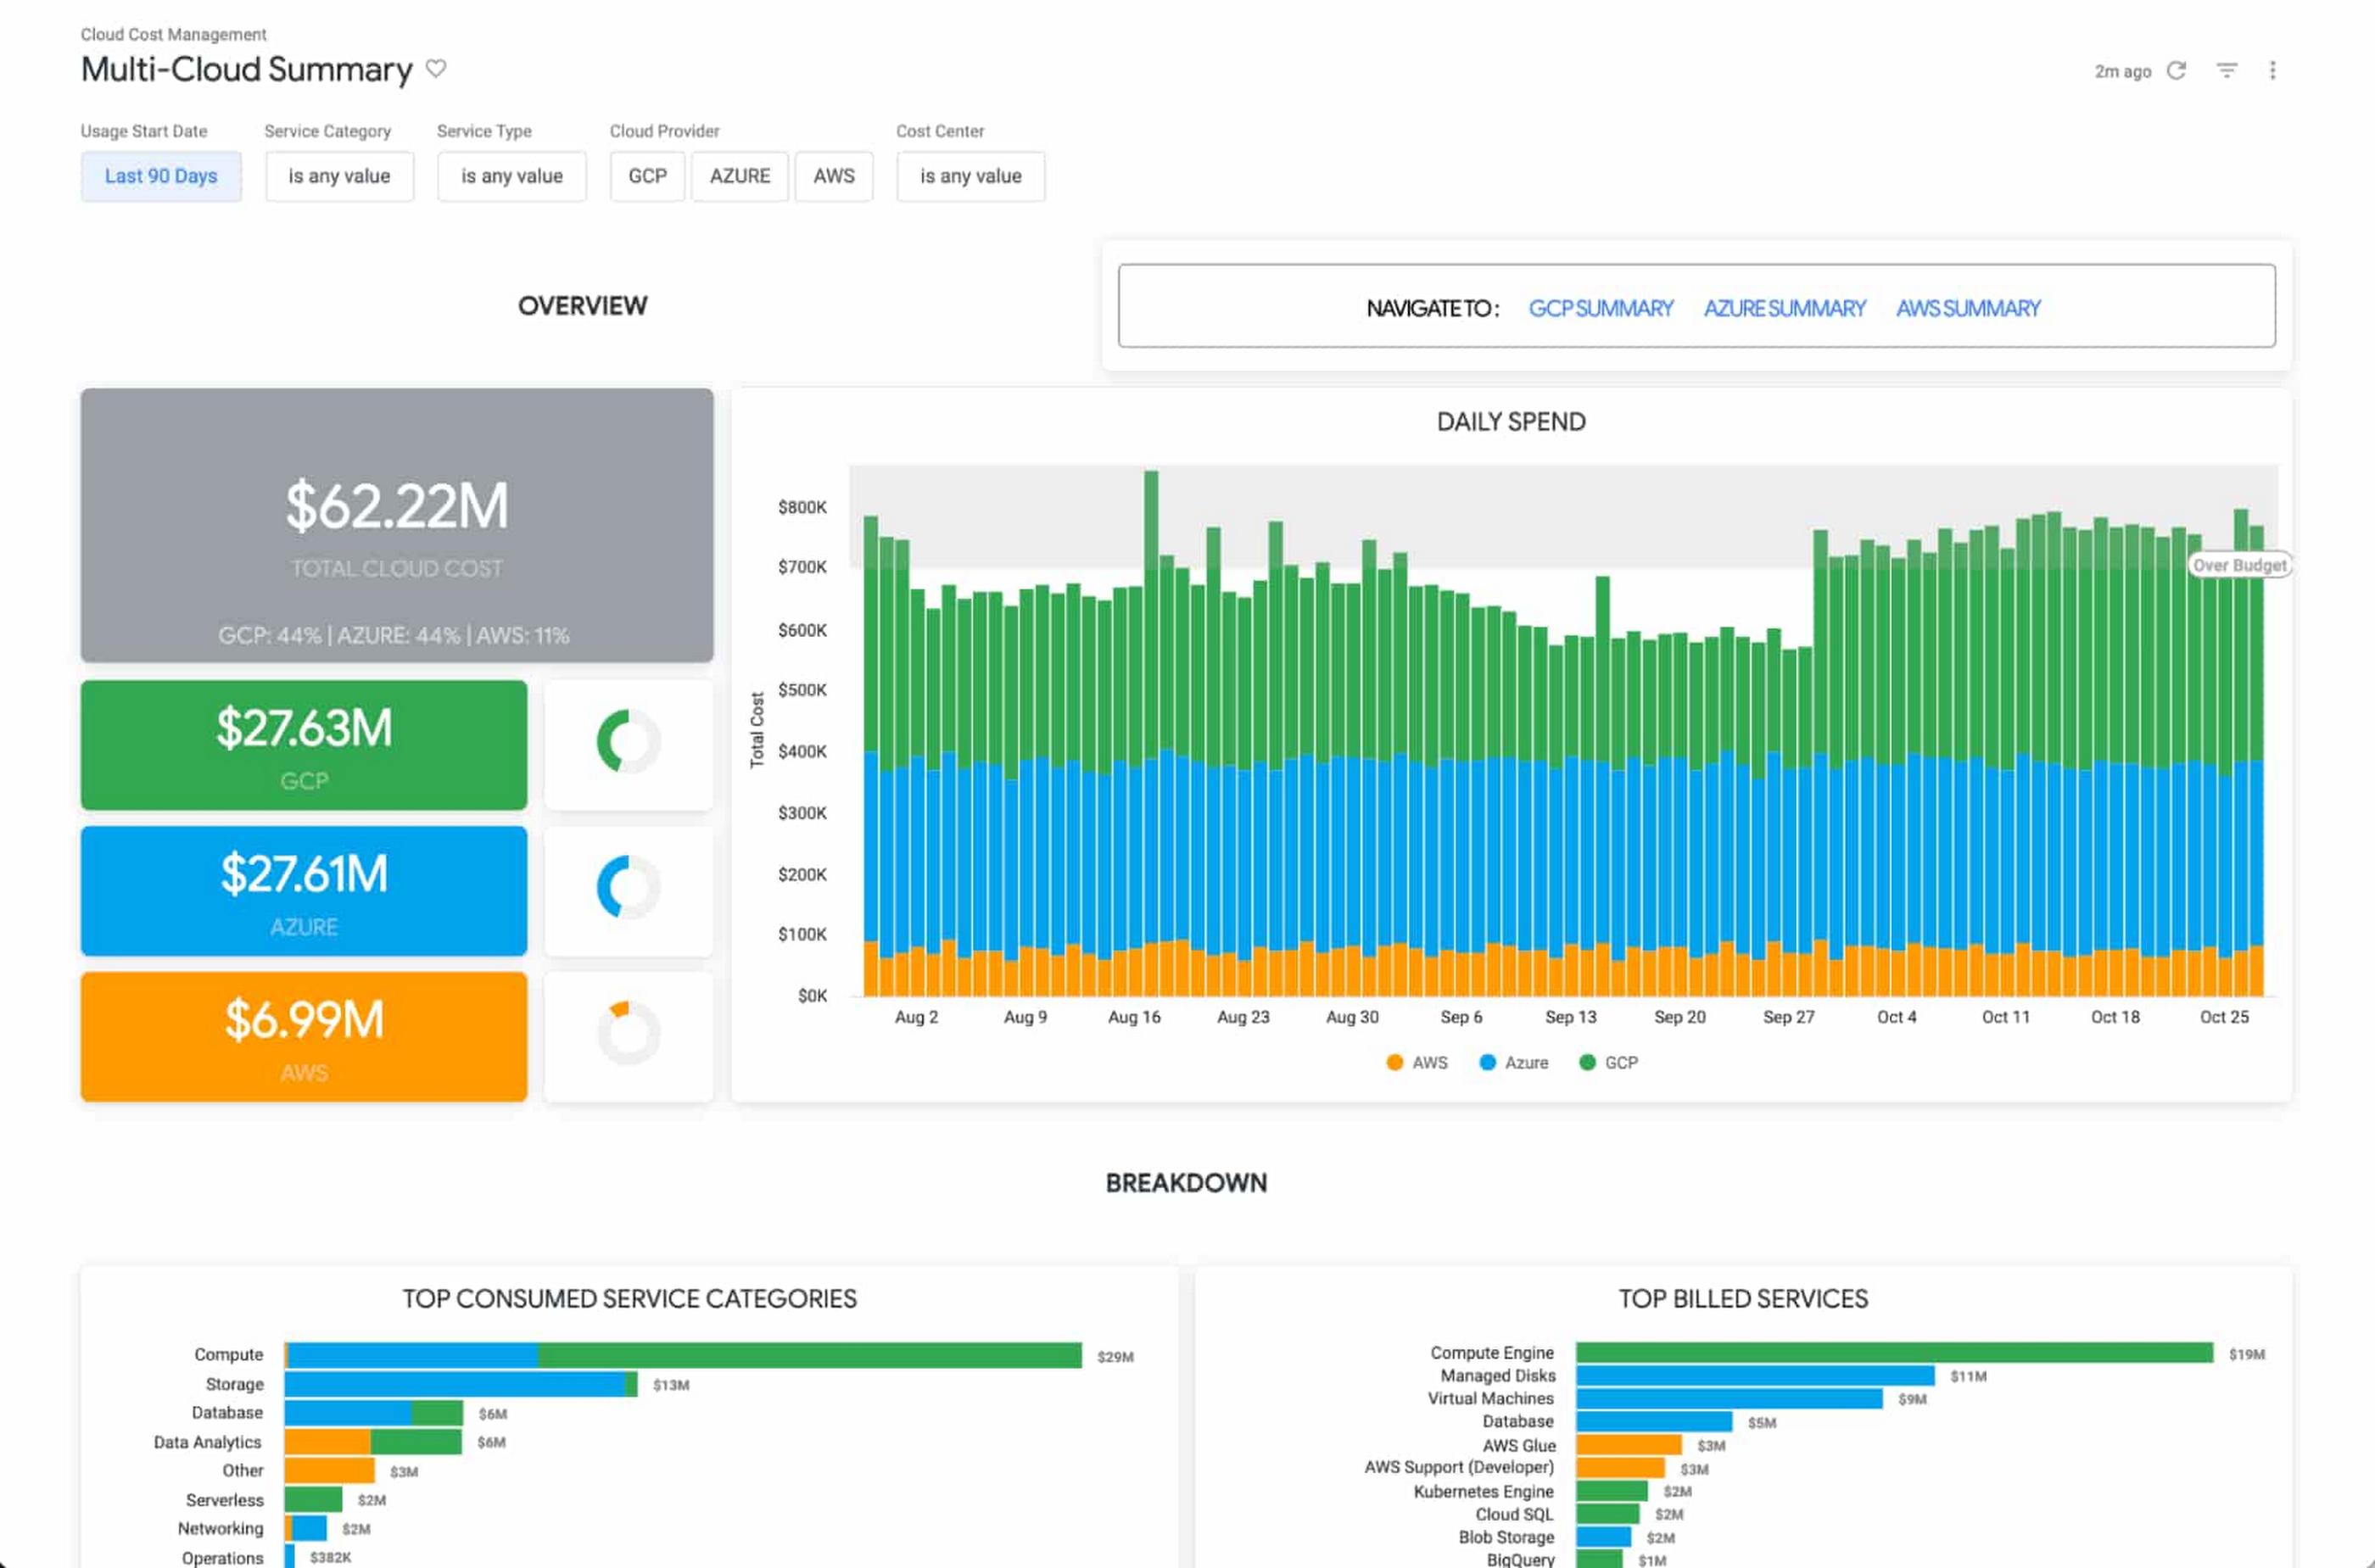
The Looker Cloud Cost Management solution provides operational teams struggling to monitor, understand, and manage the costs and needs associated with their cloud technology with a comprehensive view into what, where and why they are spending money.
Making better decisions with Looker-powered data
Leading companies are discovering ways to get value from all of that data beyond displaying it in a report or a dashboard. They want to enable everyone to make better decisions but that’s only going to happen if everyone can ask questions of the data, and get reliable, correct answers without using outdated or incomplete data and without waiting for it. People and systems need to have data available to them in the way that makes the most sense for them at that moment.
It’s clear that successful data-driven organizations will lead their respective segments not because they use data to create reports, but because they use it to power data experiences tailored to every part of the business, including employees, customers, operational workflows, products and services.
As people’s way of experiencing data has evolved, more than ever before, dashboards alone are not enough. You can use data as fuel for data-driven business workflows, and to power digital experiences that improve customer engagement, conversions, and advocacy.
From Nov. 9 – 11th, Looker is hosting its annual conference JOIN, where we’ll be showing new features, including how we help to:
- Build data experiences at the speed of business
- Accelerate the business value with packaged experiences
- Unleash more insights for more people in the right way – Deliver data experiences at scale
There is no cost to attend JOIN. Register here and learn how Looker helps organizations build and deliver custom data-driven experiences that goes beyond just reports and dashboards, scales and grows with your business, allows developers to build innovative data products faster, and ensures data reaches everyone.
Guide for Measuring Cloud Spanner Performance for Your Custom Workload

4832
Of your peers have already read this article.
3:00 Minutes
The most insightful time you'll spend today!
Database migration to a new database platform or technology can be daunting for various reasons. One of the common concerns is database performance. It is hard to evaluate database performance early in the evaluation cycle without performing actual data migration and application changes. This becomes even more important in the case of Cloud Spanner where modernization is required at both the database and application layers.
The traditional approach to evaluate database performance is to deploy the application and database together, migrate historical data to the new database and then simulate load tests by running an application on the new database. Doing all this for an early performance evaluation of Cloud Spanner may feel like a lot of effort.
In this post, we will explore a middle ground to performance testing using JMeter. Performance test Cloud Spanner for a custom workload before making application code changes and executing data migration. More detailed step-by-step guide is published here.
Goals
- Estimate the number of Cloud Spanner nodes needed (and get a cost estimate).
- Performance test the most frequently used set of queries and transactions.
- Demonstrate the ability to scale horizontally.
- Better understand the optimizations needed for schema and sql queries.
- Determine latency of DML operations.
Limitations
- You cannot test using non-java client libraries.
- It is more complex to test non-jdbc compliant features like mutations, parallel reads etc.
Preparing for performance tests
- Identify top SQL queries, latency, frequency / hour and avg number of rows returned or updated for each. This information will also serve as a baseline for the current system.
- Determine Cloud Spanner region / multi-region deployment. Ideally, load should be generated from the Cloud Spanner instance’s leader region for minimum latency and best performance. Read Demystifying Cloud Spanner multi-region configurations for more details on various configurations of Cloud Spanner.
- Estimate the number of Cloud Spanner nodes required for a given workload based on (step 1). It is recommended to have a minimum of 2 nodes for linear scaling.
Note: Peak performance numbers of regional performance and multi regional performance are published. It is based on a 1KB single row transaction with no secondary indexes. - Request quota for Cloud Spanner nodes on a given region / multi-region. It can take up to 1 business day.
Setting up Cloud Spanner
Creating the schema for Cloud Spanner
You can use the following tools to generate a schema for Cloud Spanner if you are migrating from the following source databases. Alternatively, you can model the schema manually. Schema design has a huge performance impact, hence it is recommended to review the schema very carefully.
| Source | Target | Tool(s) | |
| 1. | MySQL / MariaDB | Cloud Spanner | HarbourBridgeStriim |
| 2. | Postgresql | Cloud Spanner | HarbourBridgeStriim |
| 3. | Oracle | Cloud Spanner | Striim |
| 4. | SQL Server | Cloud Spanner | Striim |
Note: Manual review and tuning of schema will be needed to optimize and mitigate potential hotspots. You will need to keep in mind schema design best practices when modeling your schema.
Populating seed data into Cloud Spanner
Performance of a database depends on the amount of data present. Existing data (and indexes) determines how much data is scanned on select queries and therefore performance. Hence, it is important to seed data into Cloud Spanner before performance testing.
For most realistic results, data should be migrated from an existing production source. Sometimes you cannot do that due to schema changes. One way is to utilize a custom ETL job to export and transform data and then import into Cloud Spanner. Another alternative could be to mock seed data using JMeter(More details in later sections).
JMeter performance tests
Writing Tests
JMeter will interact with Cloud Spanner just like your application. It will perform DML operations the same way as your application does. Hence, tests need to simulate production like transactions. For example if a transaction is made up of insert and/or update statements in several tables within transaction boundaries then JMeter should mimic the same.
JMeter has the following hierarchy:
Test Plan > Thread Group(s) > Sampler(s) (aka test)
Test plan is a top level component. It can contain global properties and libraries (like jdbc driver etc).
Thread Group(s) are representative of a database transaction. It contains one or more sampler(s). All the samplers within a thread group execute serially.
Sampler(s) should represent a single DML call. If your transaction needs to have multiple dml calls, you should create multiple samplers. Typically you will use JDBC Sampler for database calls. You can also use JSR 223 Sampler as described here, in case you need to use mutations or parallel reads etc. Results from one sampler can be passed to the next, as in real world application.
Executing tests and collecting results
JMeter tests should be executed as physically close to Cloud Spanner instances as possible to minimize network latency. Therefore it is best to execute them from Compute Engine (via private service connect) from the same region as the Cloud Spanner instance. In-case of multi region Cloud Spanner, GCE instances should be created in the Leader Region of the Cloud Spanner instance for lowest network latency.
JMeter should be executed via command line, it is a CPU intensive application so make sure you have allocated enough resources on the VM.
Refer to the Cloud Spanner monitoring dashboard to ensure that your Cloud Spanner instance’s CPU utilization is at or below the recommended values. In addition, use introspection tools to investigate performance issues with your database.
You might need to optimize your queries (add indexes) and re-execute tests in multiple waves to tune the performance as needed.
Try it yourself
Follow a detailed step by step tutorial on Measure Cloud Spanner performance test using JMeter to test Cloud Spanner performance yourself.
Home Depot’s Interconnected Retail Experience by Virtue of Google Cloud Migration for SAP Applications

8265
Of your peers have already read this article.
1:30 Minutes
The most insightful time you'll spend today!
With nearly 2,300 stores, The Home Depot is the world’s largest home-improvement chain — a brand that professional contractors and DIYers alike have come to depend on. The home improvement industry continues to experience unprecedented demand and dramatic increases in online ordering accompanied by expanding consumer expectations for things like curbside pickup and same day delivery. The Home Depot’s decision to migrate to cloud-based infrastructure, including the migration of the company’s SAP applications on Google Cloud which began in 2017, has set it up for success in an increasingly digital world, and helped the company adapt to changing market conditions quickly.
Interconnected retail at scale
Building on a strong customer-first philosophy, The Home Depot aims to create what it calls interconnected retail—allowing customers to shop however, whenever, and wherever they want. “So many companies are focused on omni-channel retail,” explains Sam Moses, Vice President of Corporate Systems. “At The Home Depot, we wanted to take it to the next level. Interconnected retail puts the customer at the center of everything and enables them to shop in store, online, or both. Customers can begin a transaction online and continue in-store, or vice-versa.”
To support this strategy, the company’s SAP environment needed to be more agile. Running everything on-premises, from central finance to POS systems, meant that The Home Depot’s IT teams experienced redundancy and repetitive, manual processes. Their data warehouse needed an upgrade to process and analyze growing and increasingly diverse data sets. The Home Depot chose to migrate its SAP environment to Google Cloud to support both the velocity and scale needed for the business as well as critical analytics capabilities needed for its bold digital initiatives. “We chose Google Cloud to support our SAP implementation. Our decision had a lot to do with the relationship between Google Cloud and SAP and also for the applications and services that are offered by Google Cloud, like BigQuery, which are helping to enable data and analytics within our organization,” Moses explains.
After migrating its SAP applications—including S/4HANA, its customer activity repository (CAR), general ledger, e-commerce system, enterprise data warehouse and more to Google Cloud, the company now has the speed, scale and flexibility to tackle enormous spikes in the business, all while staying fully available for their customers. Additionally, The Home Depot was able to transform its financial systems and make them more agile to deliver critical information across multiple business functions in real time.
Maximizing data insights to support customer experiences
By migrating to Google Cloud, The Home Depot is leveraging Google Cloud analytics to build the industry’s most efficient supply chain including more robust demand forecasting, supplier lead times, estimated delivery times and more, all while maintaining better security than before. “We experienced unprecedented change in our customers’ behavior and their buying patterns, which puts a lot of pressure on our supply chain,” explains Moses. “So having the ability to leverage data and analytics gives us insights to know exactly what it is that our customers need.”
The company’s analysts now use BigQuery ML for machine learning directly against the company’s BigQuery data and use AutoML to determine the best model for predictions. The Home Depot’s engineers have also adapted BigQuery to monitor, analyze, and act on application performance data across all its stores and warehouses in real time—capabilities that were not as seamless in the on-premises environment.
With hundreds of projects on Google Cloud, The Home Depot’s cloud journey is well on track, but the company is always looking to the future. “As our customers’ needs have continued to evolve, and as technology has continued to evolve, our relationship with Google will continue to advance — to be able to innovate together, to be able to find new solutions together, to better serve our customers.”
Learn more about how The Home Depot is renovating its retail operation with SAP on Google Cloud.
More Relevant Stories for Your Company

NCR’s Emerald Leverages Google Cloud to Help Grocers Boost Operational Agility
In recent years, the grocery industry has had to shift to facilitate a wider variety of checkout journeys for customers. This has meant ensuring a richer transaction mix, including mobile shopping, online shopping, in-store checkout, cashierless checkout or any combination thereof like buy online, pickup in store (BOPIS). What’s more,

Google Dataflow Named Leader in The 2021 Forrester Wave™: Streaming Analytics
We are excited to announce that Google has been named a Leader in The Forrester Wave™: Streaming Analytics, Q2 2021 report. Thank you to our strong community of customers and partners for working with us to deliver a customer focused product. We believe Forrester’s recognition is an acknowledgement of our leadership
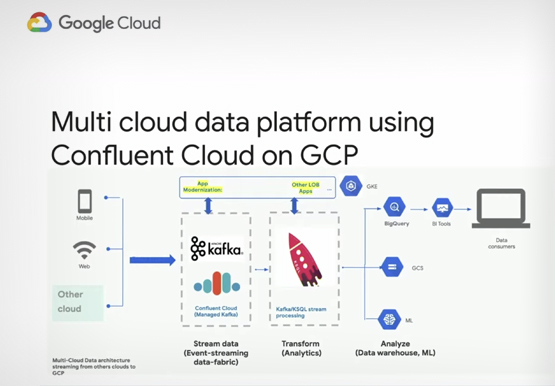

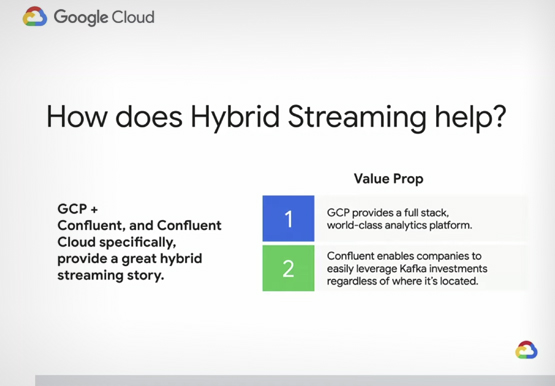

How to Build a Data Pipeline Across Hybrid and Multi-region Infrastructures
Building a data pipeline on Google Cloud is one of the most common things enterprises do. Increasingly, organizations want to build these data pipelines across hybrid infrastructures. Using Apache Kafka as a way to stream data across hybrid and multi-region infrastructures is a common pattern to create a consistent data

The 40 Most Astounding Stories of Tech-Enabled Innovation
These business and technology innovators are leveraging cloud computing, machine learning, APIs, collaborative platforms, among others to advance healthcare, financial services, retail, media and entertainment, manufacturing, and government. They include some of the biggest brands in the world, as well as some you've probably never heard of. But they all
