






7565
Of your peers have already downloaded this article
10:00 Minutes
The most insightful time you'll spend today!
New ways Google Workspace works with tools you already use

4044
Of your peers have already read this article.
6:30 Minutes
The most insightful time you'll spend today!
Looking back on 2020, it’s clear that the ways we work have rapidly transformed—from the rise of remote work and increasingly digitized processes, to balancing time across work and personal responsibilities. But one thing hasn’t changed—businesses still rely on a staggering number of applications to get work done. Working from home and the associated pressures on productivity have only emphasized the need for fewer tools that do more, are easy to use from anywhere, and seamlessly integrate with other software.
Google Workspace helps you get more done—with communication and collaboration tools known and loved by billions of users, thoughtfully connected together. And while billions of users choose our apps, we recognize that they also need to effectively collaborate with partners, customers, and even teammates that might use other tools. In particular, we know that many people work with a mix of Google Workspace and Microsoft applications—for example, while migrating to Google Workspace or collaborating with external vendors or clients. That’s why we make it easy for you to use Google Workspace with Microsoft Office and Office 365, helping you collaborate productively from any device with anyone, regardless of what tools you use.
Save time with helpful intelligence and faster workflows in Google Workspace
Creating and collaborating on content is at the heart of getting work done. When working with content received from customers, partners, or teammates, employees shouldn’t lose time converting files or working in unfamiliar tools.
With Google Drive, you can store and share over 100 different file types and formats, including Microsoft Word, Excel, and PowerPoint files, as well as PDFs, images, and videos. And by using intelligent features like Priority and Quick Access in Drive, you can find files nearly 50% faster.
With Office editing, users can also easily edit Microsoft Office files in Google Docs, Sheets, and Slides without converting them, with the added benefit of layering on Google Workspace’s enhanced collaborative and assistive features. From assigning action items via comment, to writing faster with Smart Compose, to accelerating data entry with Sheets Smart Fill, Office editing brings Google Workspace functionality to your Office files. And we recently extended Office editing to the Docs, Sheets, and Slides mobile apps as well, so you can easily work on Office files on the go.
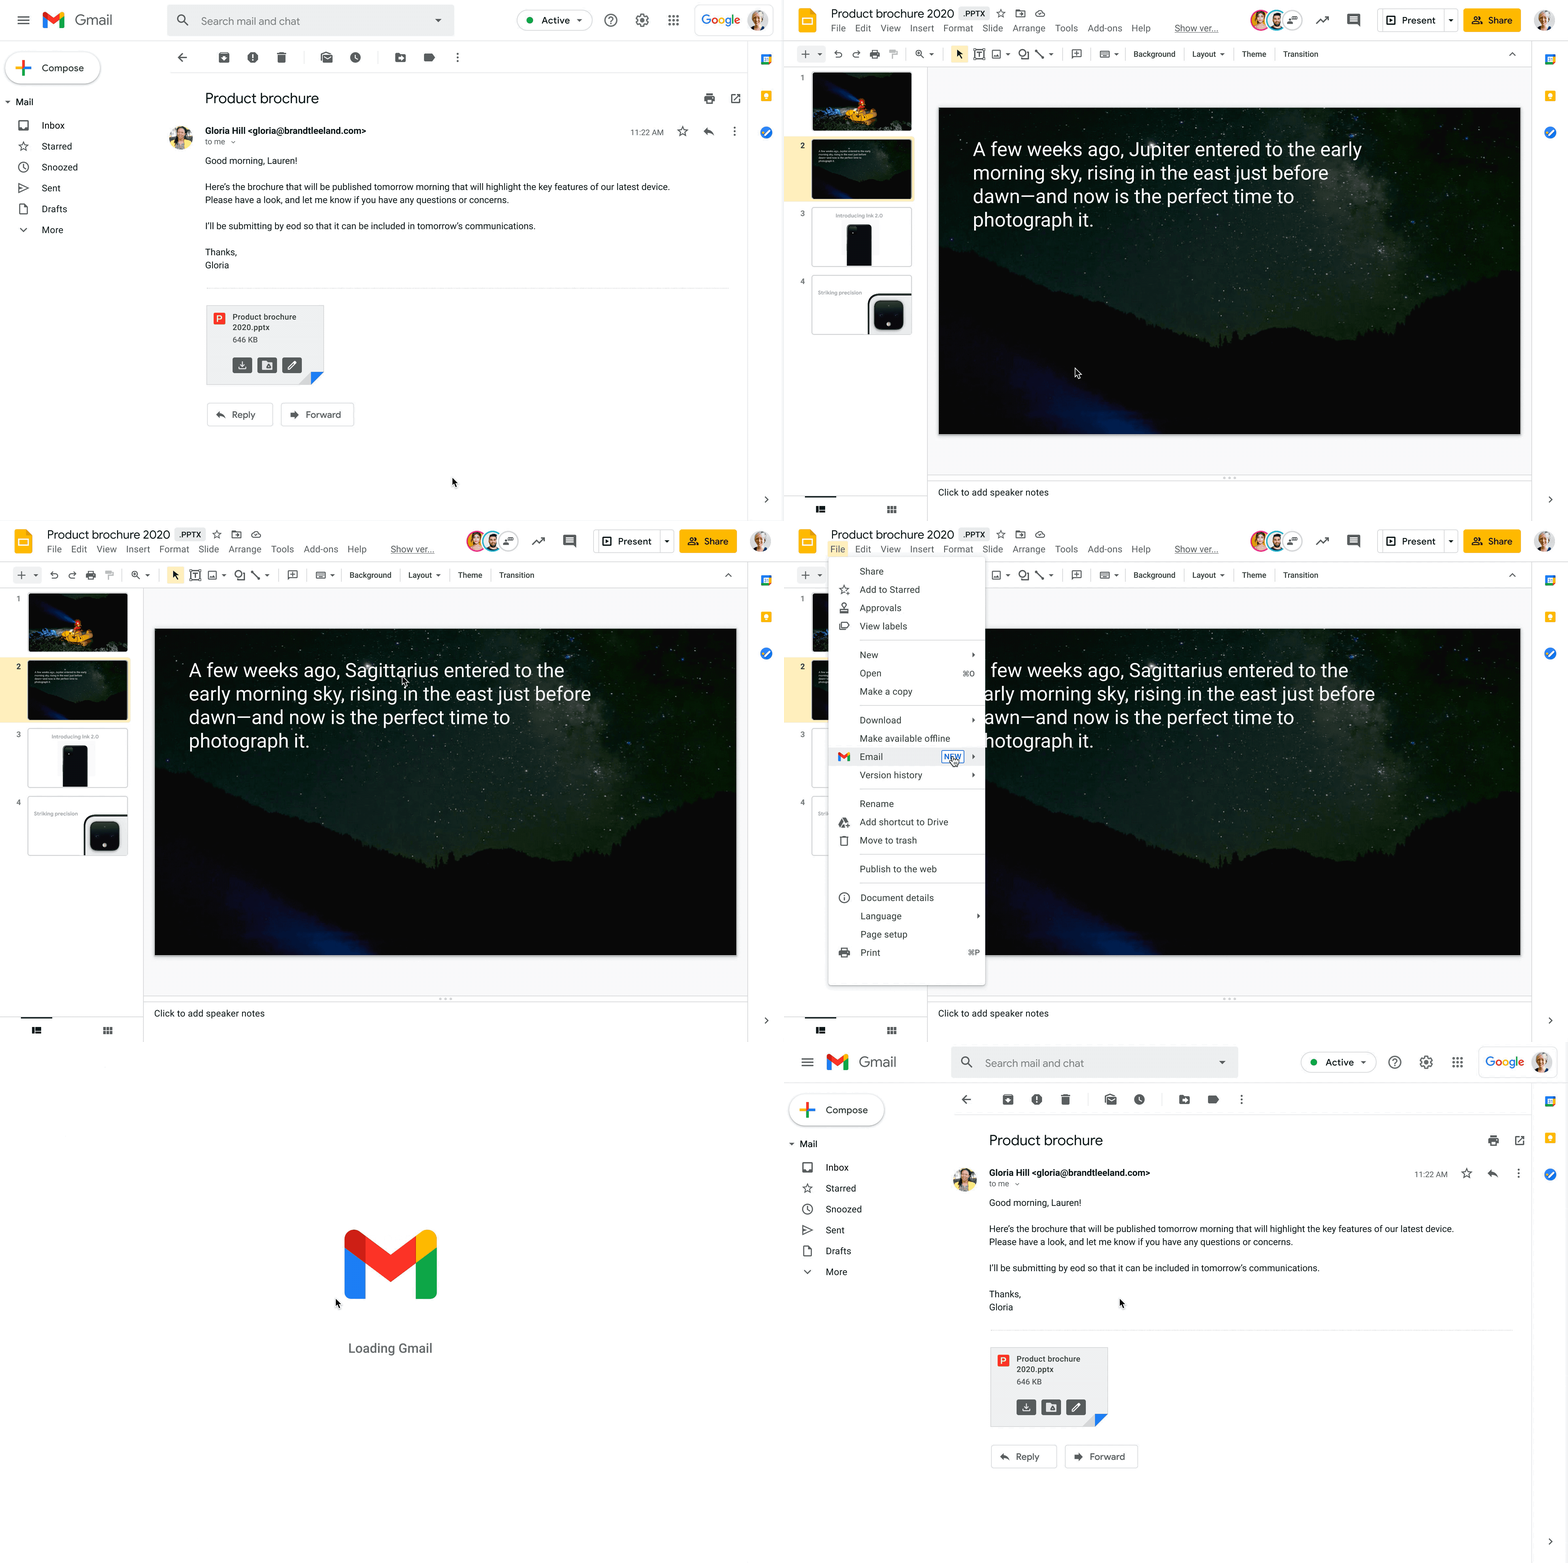
Starting today, you can also open Office files for editing directly from a Gmail attachment, further simplifying your workflows. For example, when you receive a Word document as an email attachment, you can open it and start editing in Docs with a single click while still preserving the Word file format. Then you can respond to the original email thread and include the updated file, right from Docs—saving you time by eliminating steps like downloading the file to edit, or searching for the relevant email to reattach it to.
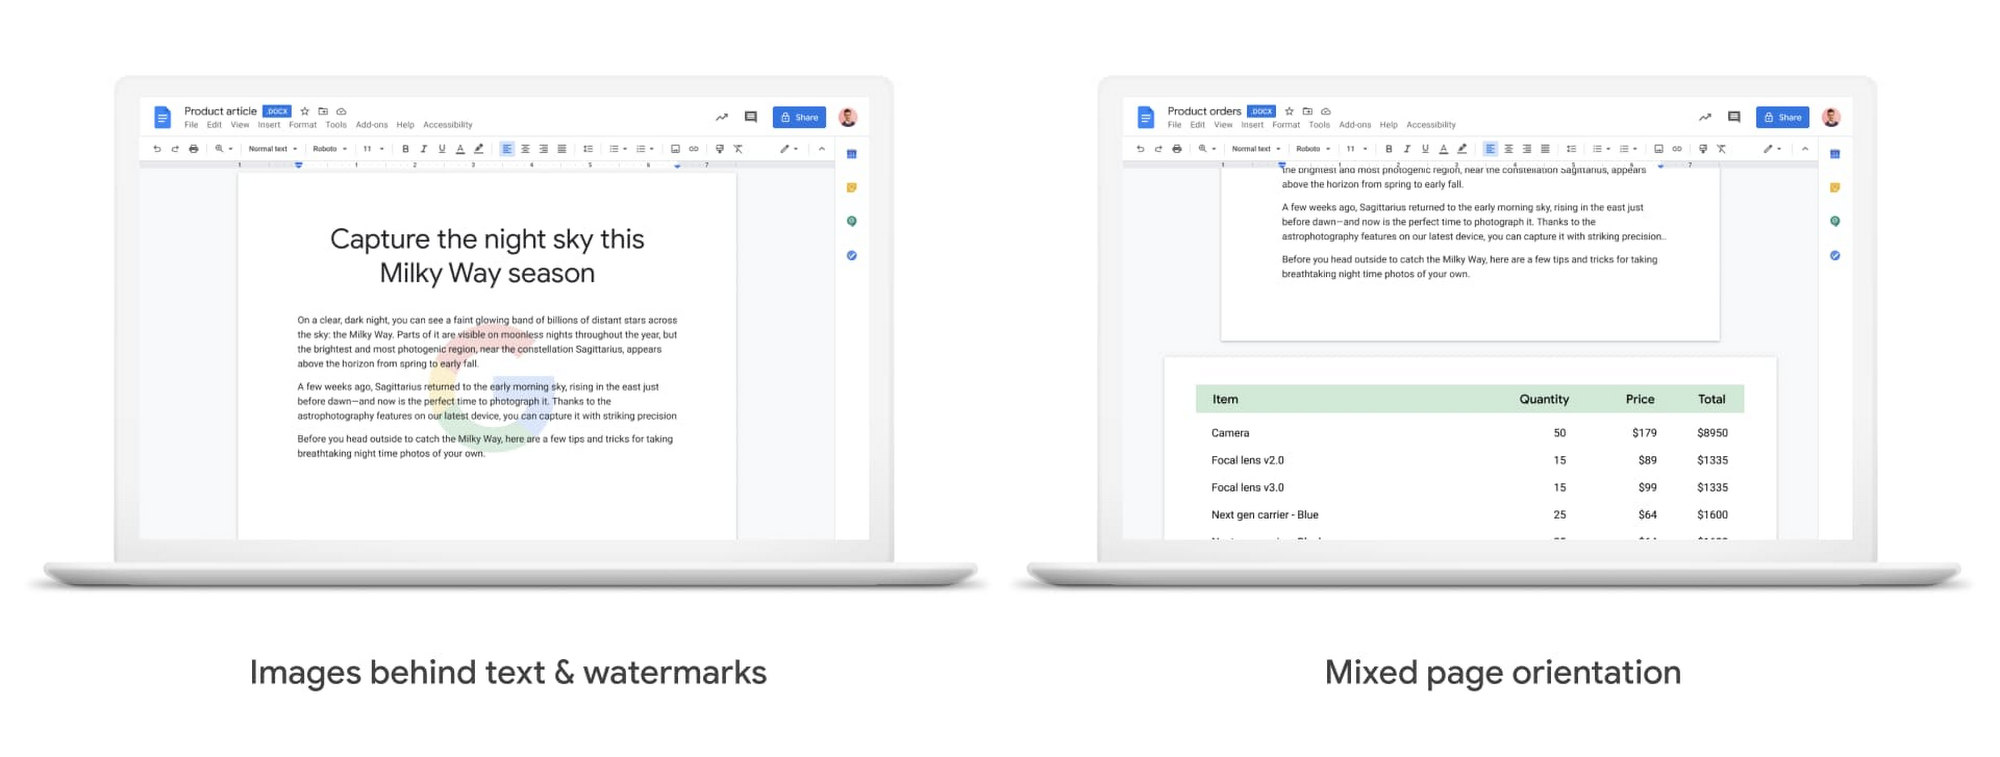
We also know it’s important that your Office files look consistent when opened in Docs, Sheets, and Slides, so we continue to support additional formatting options used in Office files. Today, we’re announcing mixed page orientation support in Docs, so you can create Docs or edit Word files with mixed landscape and portrait pages. And next year, we’ll add support for inserting images behind text and watermarks, to give you further flexibility.
Finally, when it comes to spreadsheets, we know that many organizations maintain both Excel and Sheets, especially when relying heavily on macros that have been built over time to automate processes. In Sheets, it’s easy for anyone to record macros, without having to write any code. And to make it easier for teams to transition from Excel to Sheets or support co-existence of these tools, we have also launched a new Macro Conversion add-on that helps users migrate macros from Excel to Sheets. This way, teams can save time through automation, without having to start from scratch.https://www.youtube.com/embed/CUKAUFoa86M
Stay connected with others, wherever you are
Business growth is fueled by people connecting and generating ideas together, whether they are working from the same office or dispersed around the globe. Google Workspace makes it easy to schedule time and meet with others, helping you maintain a connection with your collaborators and accomplish more together, from any device, anywhere.
To make and maintain these connections, people need an easy way to schedule time with others, regardless of which calendaring system they are using. Some organizations run mixed calendaring environments, for example, during a migration to Google Workspace or merger, where one company is not on Google Workspace. To help in such scenarios, the Google Calendar Interop tool makes it easy for people to schedule and book resources regardless of which system they’re on. With Calendar Interop, teams across systems can see each other’s free/busy status, event details, and book shared resources, so that they don’t need an endless exchange of chats or emails to land on a time that works for both parties.
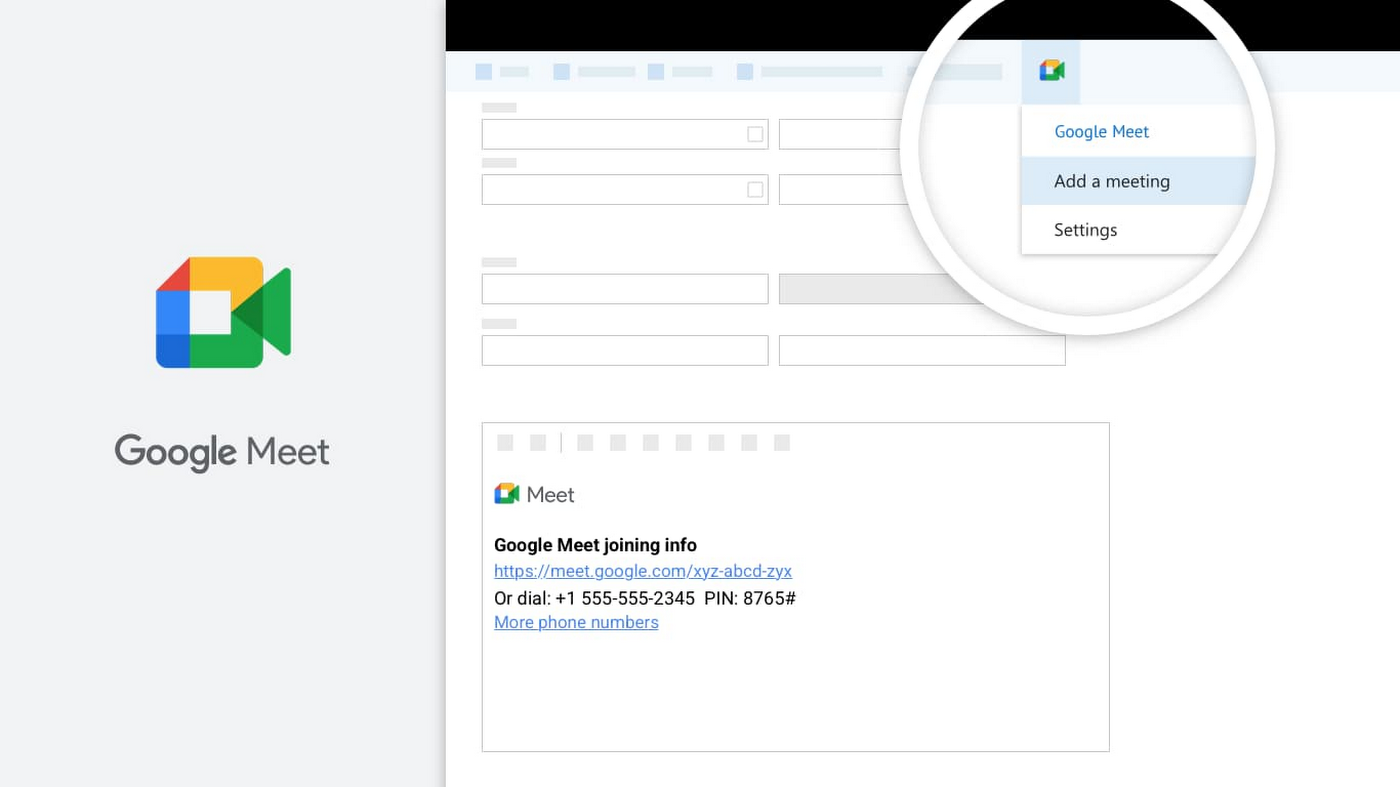
Google Meet is another powerful tool for keeping employees connected, wherever they are. With Meet, it’s easy for teams to connect via secure, enterprise-grade video conferencing from any device—laptop, mobile, or even dial-in via phone. Google Workspace customers can invite anyone to join a Meet call, including people using Outlook who don’t have a Google Account. Or if using Outlook to schedule events, users can easily add Meet video conferencing details using the Google Meet add-in for Microsoft Outlook. With a simple tap of the meeting link in your email or calendar, you can easily connect face-to-face with your collaborators, helping maintain that human connection that drives work forward.
Be productive from anywhere with custom solutions
Often, certain tasks and processes require employees to develop custom applications to manage them. Understanding how to code can be a huge barrier for employees faced with this challenge, but Google Cloud’s AppSheet enables anyone to build applications without having to write code. AppSheet is available to all Google Workspace users and has a number of tight integrations that make it easy to build custom apps on top of Google Workspace apps, like Google Sheets.
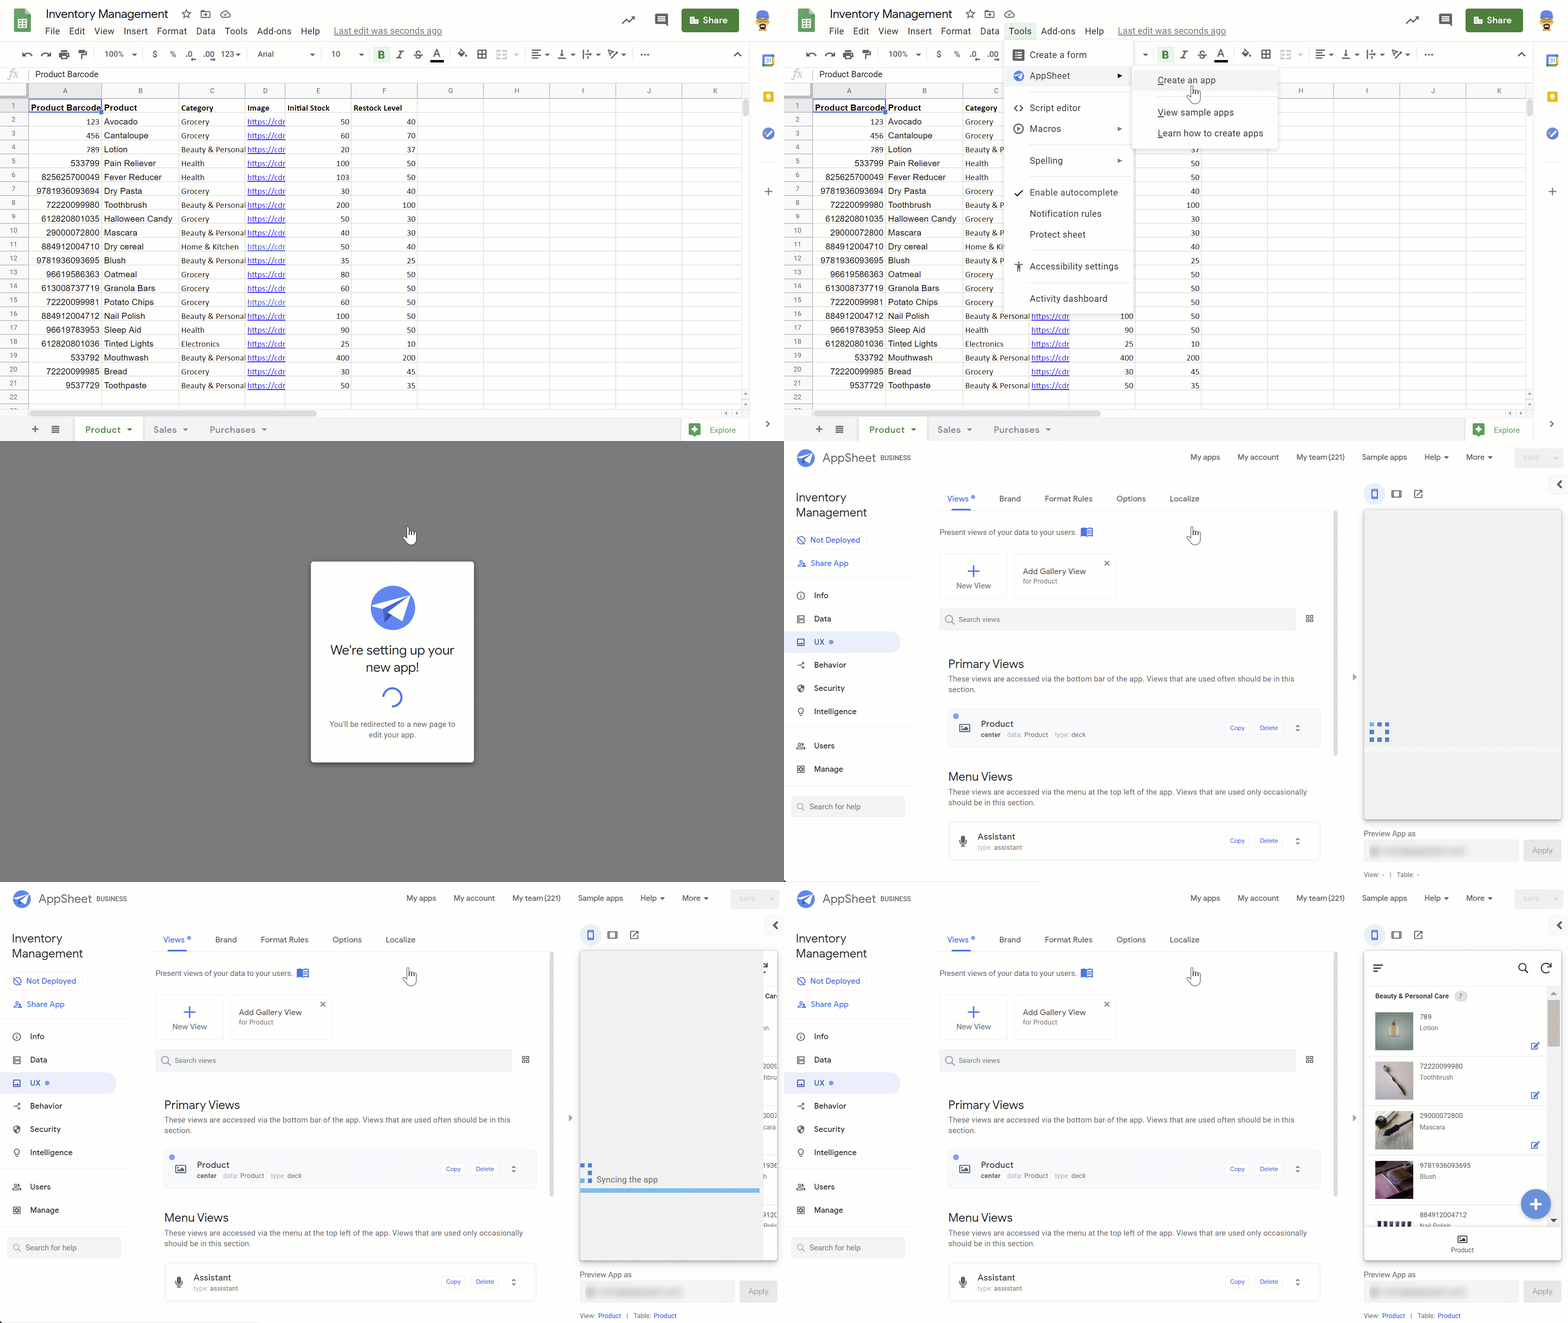
AppSheet is designed to work on any device and can connect to your data and spreadsheets, wherever they live. While AppSheet and Google Workspace are tightly integrated, AppSheet also easily connects to O365 data sources such as Excel spreadsheets stored in OneDrive or SharePoint. AppSheet creates a bridge between environments—custom apps and automations can connect to Google Workspace and Microsoft Office apps simultaneously, so that teams and processes split between environments can be managed more seamlessly. Plus, with AppSheet, even Microsoft users can easily incorporate Google’s leading AI and machine learning capabilities, like optical character recognition and sentiment analysis, into their apps.
Flexibility is important when it comes to effective collaboration, and we’ll continue to invest in the many ways Google Workspace can work seamlessly with the rest of the tools you use—helping you accomplish more, faster. Visit our learning center for more info on topics like working with Office files in our apps, or check out these helpful switching guides if your organization is currently transitioning from Microsoft Office to Google Workspace.
How to Use Data to Tell Compelling Stories and Win New Deals

4510
Of your peers have already read this article.
2:30 Minutes
The most insightful time you'll spend today!
A picture is worth a thousand words–especially at work. The data we present every day is what helps us drive decision-making in the workplace. But understanding how to visualize a story can be difficult if you’re left staring at numbers sitting stagnant in rows or columns within a spreadsheet.
This is where visualization with charts and reports becomes critical. Let’s say your team needs to understand global sales trends. If you have a waterfall chart that shows regional contribution to total revenue or a scatter plot that shows individual salesperson performance, it’s much easier to spot patterns, draw insights, and make informed recommendations. The same goes for analyzing travel expenses.
In Google Sheets, we have several built-in tools that make it easy to create and share useful charts and reports so that you can quickly visualize data (without having to leave the spreadsheet). Follow these tips to showcase your data in Sheets and influence decisions.
1. Pick the most compelling way to visualize your data.
Perhaps just as important as the data you reference is the way in which you present it. Charts are the basic building blocks for data visualization and can take many forms–from bar charts to line graphs to scatter plots. There are more than 30 chart types to choose from in Sheets, and we’re constantly adding more ways to express your data. Here are a few we recommend:
- To draw attention to a key metric or KPI, try the brand new scorecard chart. For example, you can show the total sales number for your organization’s top-selling product, and even call out percentage increase or decrease over time.
- To illustrate how values add to or subtract from a starting value, try a waterfall chart. For example, show how your product sales and restocking efforts led to a net decrease in inventory from last quarter to this quarter.
- To represent different data series using lines and bars, try a combo chart. For example, you can show revenue in bars and profit margins in a line across the same chart, giving you a more complete picture of your organization’s financial health.
If you’re unsure how to best present your data, Google’s built-in machine learning can help you choose the right visualization—Sheets intelligently suggests charts for you. Simply highlight data you would like to visualize, click the chart button, and then select one of the suggested charts. According to our internal data, more than 1.5 million charts are inserted into Sheets each week based on intelligent recommendations.
Note: Once you have a chart inserted into Sheets, you may want to control the look and feel. We recently made it possible to click directly on data labels, chart titles, or legends and drag to reposition them. You can also easily delete these elements using the delete or backspace keys, if you want to make other data points stand out. We’re exploring even more ways to customize charts—stay tuned.
2. Be sure to tell a complete story.
Data really comes to life when you put several charts and tables together into a report or dashboard. Going back to our sales data example, an individual line graph showing revenue over time gives you quick insight into the general sales trend for your organization (hopefully, up and to the right!). But when you surround that line graph with other charts and tables–like a pie chart showing total revenue breakdown by-product, or a stacked bar chart comparing revenue driven by each sales team–you can tell a more complete story.
If you do build reports featuring multiple charts, there are ways that Sheets can help you organize and format them more quickly. Earlier this year, we made it easier to align, size, and position objects within your spreadsheets so you can quickly put several charts together. We also recently added themes, which let you alter the look and feel of an entire spreadsheet—including charts, pivot tables, and cells—to ensure a consistent look and feel across the elements in your report. To apply a preset theme, select Format > Theme and choose the right option. Faster formatting can mean faster reporting.
Active Assist Expands Globally: Unleashing Cloud Optimization Insights Worldwide

1292
Of your peers have already read this article.
3:30 Minutes
The most insightful time you'll spend today!
Active Assist provides insights and recommendations to help Google Cloud customers proactively optimize their cloud environments for cost, security, performance, and sustainability. If you’re like most customers, you’ve likely encountered these insights and recommendations in the console — either in the Recommendations Hub or embedded on a resource page, like IAM or the VM list pages. (Note that for the rest of this post, we’ll use the word “recommendations” to mean “insights and recommendations.”)
We heard from customers who love recommendations that it should be easier to discover and work with these valuable suggestions across an entire organization, so last year we launched the Recommendations BigQuery export feature to Preview. This allows you to automatically export the recommendations to a BigQuery dataset, which you can then investigate with tools like DataStudio or Looker, and integrate with your company’s existing monitoring solutions and workflows.
Many of you have told us how powerful this feature is, so we’ve been working hard on improvements to make it even more useful. We’re happy to announce that BQ Export 1.0 is now in GA, and that BQ Export 2.0 is in Preview, with new support for Billing Account-level recommendations and cost optimization recommendations that include discount information. This post will cover what’s new with Active Assist BQ Export, as well as a couple other new features of Active Assist.
New features to Active Assist BigQuery Export
Before we dive into the details, if you’re new to Recommendations BQ Export check out our handy getting started guide. It covers the permissions you’ll need and how to set up the export, including instructions for using a service account. It also includes some sample queries and instructions for interacting with the data using Google Sheets. You may also want to check out our prior blog post showing how to optimize your cloud spend with BigQuery and Looker.
Now, on to what’s new!
1. Non-project scoped recommendations
You can now see non-project scoped recommendations, such as billing account, organization, and folder-level recommendations in your export to BigQuery. This ensures that in your export, you are able to see the full portfolio of recommendations that are available to you.
2. Custom contract Pricing
If you have any applicable custom contract pricing for your company, your cost-related recommendations now take those into account (based on your historical costs) in the cost saving calculation when you export them to BigQuery. This will ensure that you have the most accurate cost savings data we have for you and your organization to help you make the best judgment and prioritization when choosing to adopt recommendations. However, you must have the correct permissions first in order to see the custom contract pricing. If the user executing the export to BigQuery does not have the correct permissions, you may continue to see list pricing in your estimated savings. Also, note that the console UI and the Recommender API already have this support.
3. Export now available globally
Customers outside of the US can now set up an export of recommendations to a BigQuery dataset.
Improvements to Active Assist discoverability and usability
1. Global Recommender Viewer role: You can now add the global Recommender Viewer role, which gives you view access to all insights and recommendations available to you, simplifying permission management for new recommenders. Newly launched recommendations will also automatically be added as they become generally available.
2. Dismiss recommendations via Recommender API: You can now directly dismiss recommendations via our API, allowing you to focus on the recommendations you care about and work more efficiently.
3. Shareable links: Another feature that quietly launched recently is the availability of shareable URLs that link to recommendation details in the console. You can access these links in the UI from the upper right of the details panel of any recommendation.
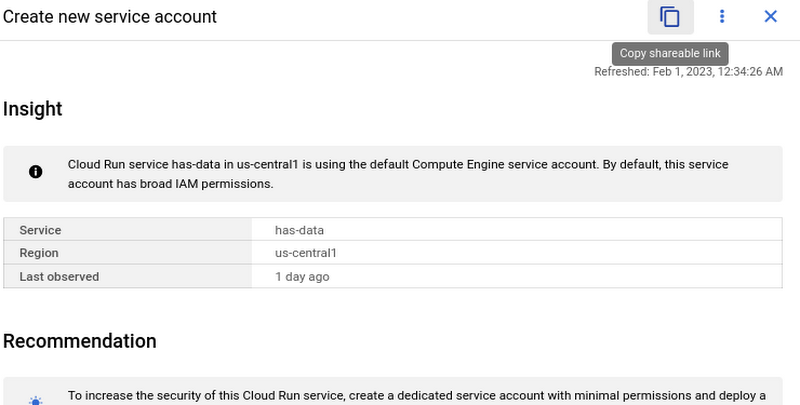
However, these links become even more powerful when combined with Recommendations BigQuery Export. The URLs all have a standard format. This means that within the BigQuery export tables you can easily calculate a new column containing these links using an expression like:
“https://console.cloud.google.com/home/recommendations/view-link/” +
name +
“?project=” +
cloud_entity_id
This example is for project level recommendations (where cloud_entity_type = PROJECT_NUMBER).
For cloud_entity_type = FOLDER, use:
“https://console.cloud.google.com/home/recommendations/view-link/” +
name +
“?folder=” +
cloud_entity_id
For cloud_entity_type = ORGANIZATION, use
“https://console.cloud.google.com/home/recommendations/view-link/” +
name +
“?organizationId=” +
cloud_entity_id
These links can then be embedded in your reports and dashboards, or used by other BigQuery clients.
As a reminder, if you’re interested in setting up reports or dashboards using Recommendations BigQuery Export, take a look at this previous blog post for some great ideas, or you can reference our getting started guide. If you have any feedback, please feel free to reach out to active-assist-feedback@google.com.

6312
Of your peers have already downloaded this article
4:04 Minutes
The most insightful time you'll spend today!
When it comes to data analysis, it’s easy to fall into routine. But no matter how much of a whiz you are at formulas or pivot tables, superb spreadsheet skills only take you so far if you’re working with multiple versions or outdated datasets.
On average, your employees spend up to eight hours each week—an entire work day—searching for and consolidating information.
What if businesses spent their time applying data insights instead of tracking them down?
Working in the cloud means your data can easily stay up to date because information is automatically saved as it’s typed. Multiple team members can collaborate in real-time from their phone, tablet or computer (online and offline) and create a single source of truth for projects, like quarterly budgets.
Powered by Google’s machine intelligence, Sheets does a lot
of the heavy
lifting for you when it comes to data analysis. You can ask a question
about your data and Sheets will return an answer using natural language
processing. Sheets also builds
charts, suggests
formulas and creates
pivot tables for you.
Elevate Your SRE Practice: Streamlining Your SLO Design Process

1489
Of your peers have already read this article.
2:30 Minutes
The most insightful time you'll spend today!
Poll three Site Reliability Engineers with the question “What is SRE?” and you’re likely to get five different answers: an implementation of DevOps, a role, a set of practices, a cultural shift, a snazzy title. While these definitions may not necessarily align with those in the SRE books, there is one throughline differentiating SRE from other ways of working: Service Level Objectives (SLOs). While simple to understand – intentionally! – SLOs are frequently challenging to define in practice. And even though the specifics of an SLO vary across industries and verticals, we have found there are a number of practices and strategies common amongst teams that have successfully implemented SLOs for their workloads.
Bringing together product, development, and SRE teams to achieve a common understanding of the workload in question, and in particular its critical user journeys (CUJ), is a key first step. For many teams this means writing down, often for the first time, detailed sequence or flow diagrams for these CUJs. The maturity of and the relationship between the three “legs of the stool” (development, product, and SRE) will play a role in the level of effort required to complete this first step of the journey. Having a common understanding of your users’ expectations of your workload is a prerequisite to writing effective SLOs.
While modeling user journeys and decomposing them into SLOs is an art and no two applications are alike, there are a few key aspects upon which to anchor your discussion. The main question we recommend you keep top-of-mind when going through this process is “What do my users care about?” Framing your thought process in this way prevents implementation snafus and strategies that don’t approximate user expectations. Other aspects to consider include:
- Are there breakpoints where the user may choose not to take an action?
- Which parts of the interaction are we capable of measuring and which are we not (e.g., third-party dependencies)?
- Which parts of the user journey are common across many user journeys and thus are possible candidates for factoring out as their own CUJ (example: login)?
- Which parts of the journey can be measured in aggregate, and which must be separated because of differences in criticality, request rates, or other factors?
- Which steps of the journey have strict dependencies between one another?
Armed with answers to these questions, a detailed request diagram, and your application code, you’re ready to start putting pen to paper! Before jumping into your monitoring consoles, we recommend writing up an SLO design document which lays out the technical details of your chosen SLOs. We’ve made a template available to you to jump start this process (if you have a Google account, you can make a copy using this link). In it, you’ll find an empty template along with worked examples for reference as you create your own specifications. Whether you use this template or not, we recommend the following as you document your SLOs:
- Be pedantic with technical specifications – they will matter during implementation
- Maintain a section outlining clarifications, caveats, and/or tradeoffs made as a part of the design process
- Consider where you’re measuring – make sure it’s feasible
- Beware of summaries, averages, and other non-aggregatable statistics for latency SLOs
- Keep compliance periods consistent across your workload(s)
- We recommend the following defaults:
- 28 days rolling for operational needs (error budget alerting)
- Fixed calendar quarters for prioritization and lookback
- Changelog: Include one, even if your documentation tool has version history, so you can track major changes
- Put your SLO documentation in a location accessible by your team and company stakeholders
- Once your SLO PRD is finalized, treat your implementation as code and store it in your version control system
- Remember – DRY!
We hope these recommendations and template give you a head start in bringing your SLOs to production. If you find yourself in need of a tool to implement your SLOs, consider Google Cloud SLO Monitoring which allows you to create SLOs for any metric available in Google Cloud Monitoring and computes your error budget automatically, enabling burn rate-based alerting. If this process still feels daunting or you find your team in need of help with any of the above, our reliability engineering professional services team can assist. For more information, visit cloud.google.com/sre or you can contact your Google Cloud account team.
More Relevant Stories for Your Company

Collaboration Helps Nielsen Gain Better Consumer Insights and Save Costs by 20%
The Nielsen Company is one of the world’s most well-known and respected marketing research firms, with operations in over 100 countries. Its 56,000 employees work to provide insights and data that give customers a better understanding of what people watch, listen to, and buy. Those insights are essential to companies in a




Helpful and human: G Suite’s vision for your future workspace
With an accelerated shift to remote working brought on by COVID-19, it's clearer than ever that an organization's success relies on its people and how they work. No matter where they're working from, who they're working with, or what projects they're working on, organizations need to enable their employees to

How Randstad Creates Assessment Reports in Five Minutes with G Suite
For over five decades, Randstad has matched businesses worldwide with millions of temporary and permanent workers, creating long-lasting, successful working relationships. Today, the company operates a vast multinational recruitment network, with 35,000 employees applying HR expertise in markets from Norway to Malaysia, and more than 37 countries in-between. To give staff a
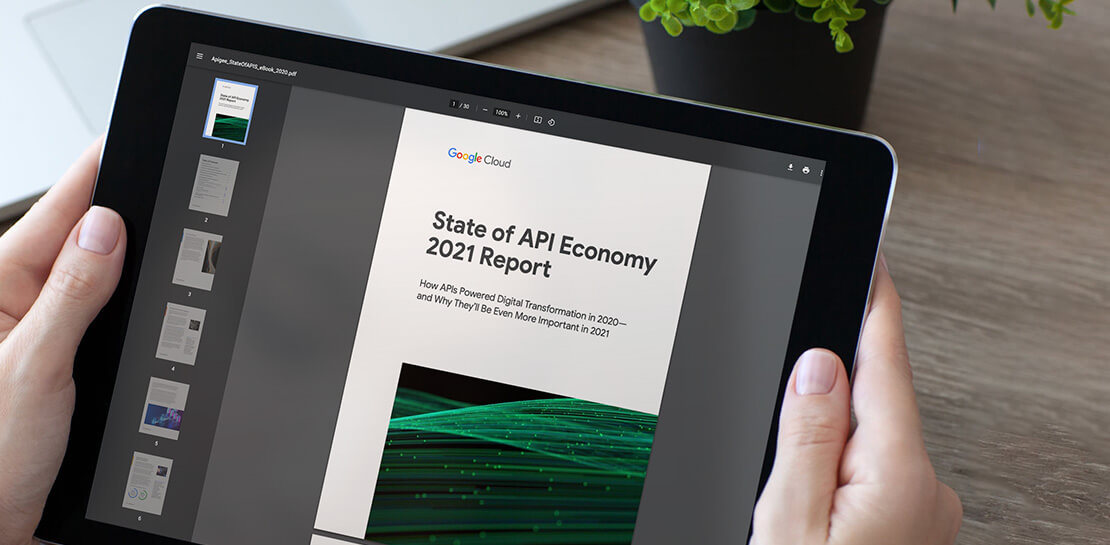
Report on API-led Digital Transformations in 2020 and the Future
In 2020, many businesses across industries turned their focus and investments towards digital strategies. APIs being an integral part of every organization's digital disruption, will grow in relevance throughout 2021. Read the report to gain more insights on driving API-led digital transformations and in-depth analysis of Google Cloud's Apigee API
